. 2020 Jan 15;287(1918):20191882.
doi: 10.1098/rspb.2019.1882. Epub 2020 Jan 15.

The ecology of human-nature interactions

Affiliations

The ecology of human-nature interactions

Masashi Soga et al. Proc Biol Sci. .

Abstract

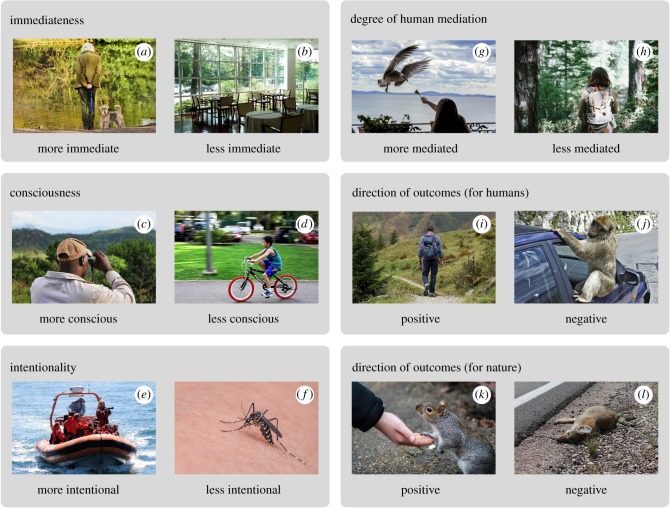
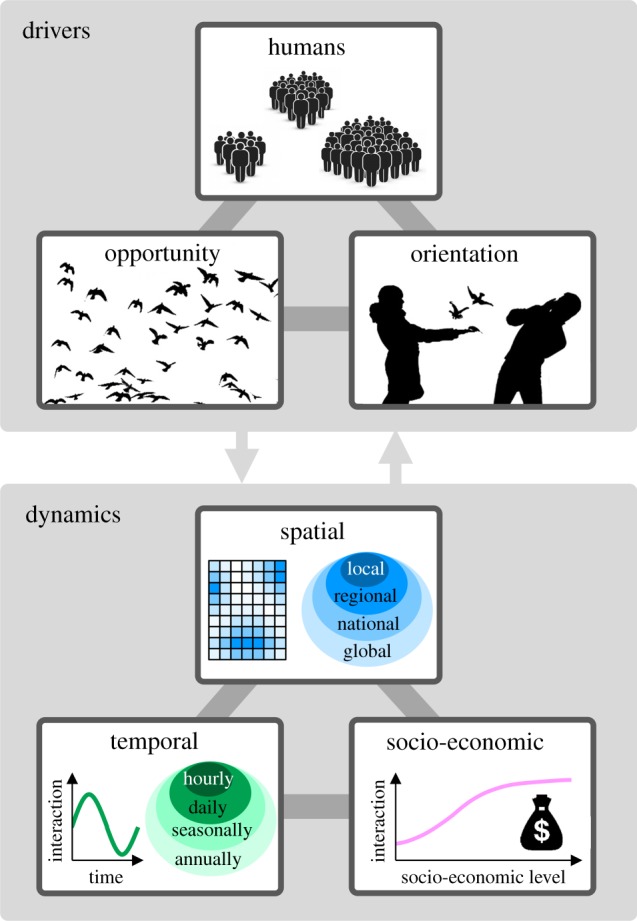
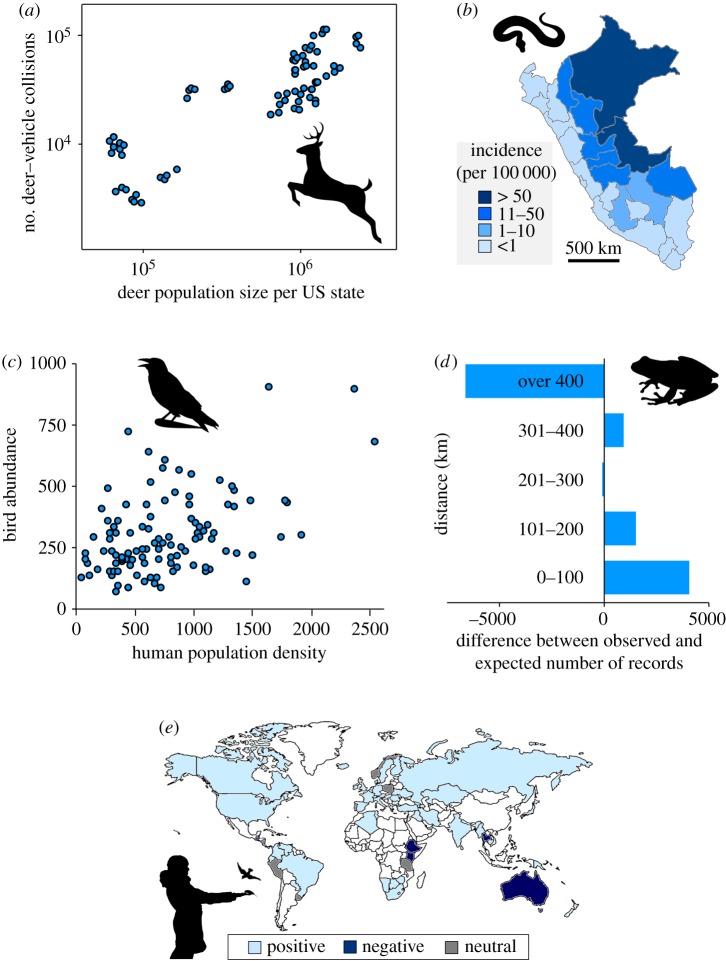
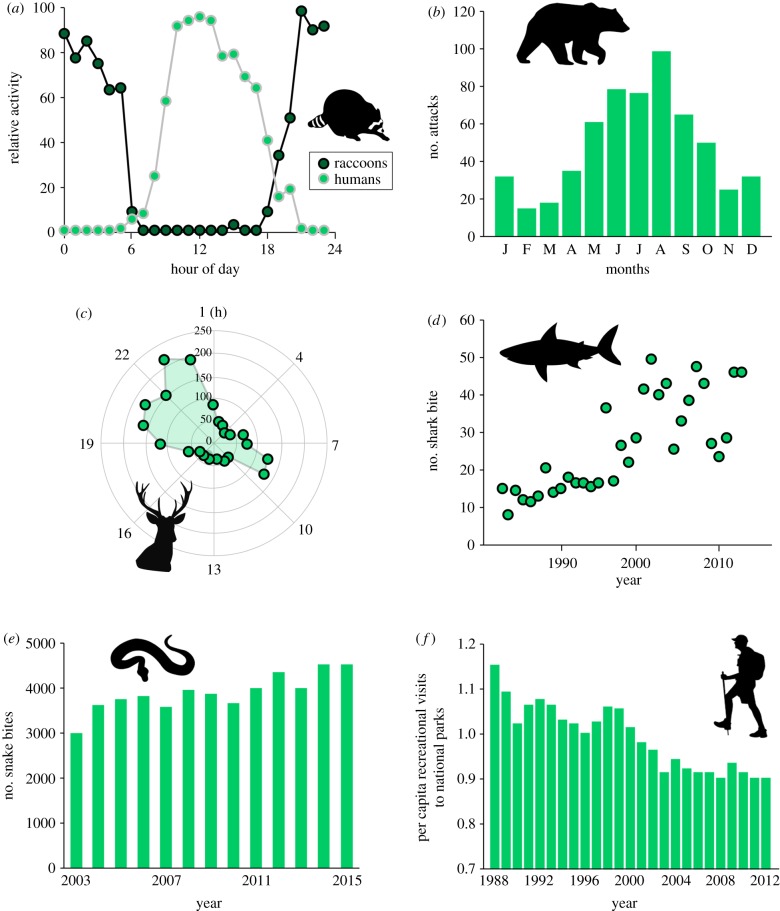
The direct interactions between people and nature are critically important in many ways, with growing attention particularly on their impacts on human health and wellbeing (both positive and negative), on people's attitudes and behaviour towards nature, and on the benefits and hazards to wildlife. A growing evidence base is accelerating the understanding of different forms that these direct human-nature interactions take, novel analyses are revealing the importance of the opportunity and orientation of individual people as key drivers of these interactions, and methodological developments are increasingly making apparent their spatial, temporal and socio-economic dynamics. Here, we provide a roadmap of these advances and identify key, often interdisciplinary, research challenges that remain to be met. We identified several key challenges, including the need to characterize individual people's nature interactions through their life course, to determine in a comparable fashion how these interactions vary across much more diverse geographical, cultural and socio-economic contexts that have been explored to date, and to quantify how the relative contributions of people's opportunity and orientation vary in shaping their nature interactions. A robust research effort, guided by a focus on such unanswered questions, has the potential to yield high-impact insights into the fundamental nature of human-nature interactions and contribute to developing strategies for their appropriate management.

Keywords: extinction of experience; global change; human–nature interactions; personalized ecology; species distribution; urbanization.


Conflict of interest statement

The authors declare no competing interests.

Figures

Figure 1.
Figure 1.
Examples of human–nature interactions across five dimensions to their typology. Examples include (a) visiting an urban park, (b) viewing trees through a window, (c) viewing wild birds, (d) encountering vegetation while cycling, (e) participating in ecotourism activities, (f) being bitten by a mosquito, (g) feeding wild birds, (h) walking in a remote protected forest, (i) hiking in a protected area, (j) being attacked by a monkey, (k) feeding squirrels and (l) hitting a fox while driving a car. All photos are from Pixabay (https://pixabay.com/ja/). (Online version in colour.)
Figure 2.
Figure 2.
Conceptual framework to illustrate the drivers and the dynamics of human–nature interactions. The three main drivers that shape the dynamics of human–nature interactions are (i) humans (i.e. distribution and behaviour of people), (ii) opportunity to interact with nature (e.g. distribution of natural environments and wildlife, phenological patterns of plants and activity patterns of animals) and (iii) orientation towards engaging with nature. Note that the three drivers of human–nature interactions here are not likely to shape the main forms of dynamics—spatial, temporal and socio-economic—of human–nature interactions independently, but rather are closely interrelated to each other. Likewise, the three types of dynamics are also likely to be interrelated, as changes in the spatial, temporal and socio-economic patterns of these interactions often occur simultaneously or consecutively (see the main text). (Online version in colour.)
Figure 3.
Figure 3.
Examples of spatial dynamics of human–nature interactions. (a) Annual number of deer–vehicle collisions as a function of deer population size in each US state (note that: each state has four data points) within the historical range of the eastern cougar, 2009–2012 [33]. (b) Geographical distribution of incidence of snake bites in Peru 2000–2015 [9]. (c) Relationship between human population density and abundance of sets of bird species that commonly display behaviours that are negative for human wellbeing (e.g. crow, magpie) in southern England [41]. (d) Differences between the observed and expected number of records of frog species obtained by the South African Frog Atlas Project within distance bands from cities [42]. The record data were collected through various methods and sources, such as herpetological volunteers' field survey and museum and personal databases (i.e. historical records), which covers approximately 100 years of frog sampling. (e) Distribution of countries that have policies with positive, negative or neutral views of wild bird feeding [43]. Light blue shading indicates countries where the modal policy position represents a positive view, dark blue shading represents countries where the modal policy position was negative and grey shading represents countries where the modal policy position was neutral concerning wild bird feeding activity (see [43] for more details). Countries shaded white have no information available. (Online version in colour.)
Figure 4.
Figure 4.
Examples of temporal dynamics of human–nature interactions. (a) Diel activity patterns of raccoons compared with humans and dogs in the Diamond Fork Area in central Utah, the US (data were collected from January to June 2015) [53]. (b) Monthly pattern in number of large carnivore attacks on humans in developed countries [7]. (c) Hourly pattern in number of wildlife–vehicle collisions in southern Belgium [54]. (d) Yearly pattern in number of shark bites in South Africa [6]. (e) Yearly pattern in number of snake bites in Mexico [9]. (f) Yearly pattern in per capita recreational visits to US national parks [13]. (Online version in colour.)
Figure 5.
Figure 5.
Examples of socio-economic dynamics of human–nature interactions. (a) Variation in level of elementary school children's immediate experiences with nature in areas of different urban intensity in China [62]. Levels of nature experiences were measured by the number of common nature-based activities (e.g. climbing trees, catching insects) in which each child participated (see [62] for more details). (b) The proportion of respondents from high and low socio-economic suburbs who fed birds and who reported seeing native birds (bellbird, tui, silvereye) in their gardens in Dunedin, New Zealand [63]. (c) Proportion of residents with trees that provide shade in the open spaces around their house across five socio-economic classes in Melbourne, Australia [64]. (d) Relationship between levels of socio-economic deprivation and the proportion of households providing food for birds in their domestic gardens in Sheffield, UK [35]. (Online version in colour.)

References

    1. Bratman GN, Hamilton JP, Daily GC. 2012. The impacts of nature experience on human cognitive function and mental health. Ann. NY Acad. Sci. 1249, 118–136. (10.1111/j.1749-6632.2011.06400.x) - DOI - PubMed
    1. Keniger LE, Gaston KJ, Irvine KN, Fuller RA. 2013. What are the benefits of interacting with nature? Int. J. Environ. Res. Public Health 10, 913–935. (10.3390/ijerph10030913) - DOI - PMC - PubMed
    1. Hartig T, Mitchell R, De Vries S, Frumkin H. 2014. Nature and health. Annu. Rev. Public Health 35, 207–228. (10.1146/annurev-publhealth-032013-182443) - DOI - PubMed
    1. Kardan O, Gozdyra P, Misic B, Moola F, Palmer LJ. 2015. Neighborhood greenspace and health in a large urban center: neighborhood greenspace and health in a large urban center. Sci. Rep. 5, 11610 (10.1038/srep11610) - DOI - PMC - PubMed
    1. Shanahan DF, Bush R, Gaston KJ, Lin BB, Dean J, Barber E, Fuller RA. 2016. Health benefits from nature experiences depend on dose. Sci. Rep. 6, 28551 (10.1038/srep28551) - DOI - PMC - PubMed