. 2020 Jan 15;18(1):7.
doi: 10.1186/s12915-019-0732-7.

Optogenetic activation of parvalbumin and somatostatin interneurons selectively restores theta-nested gamma oscillations and oscillation-induced spike timing-dependent long-term potentiation impaired by amyloid β oligomers

Affiliations

Optogenetic activation of parvalbumin and somatostatin interneurons selectively restores theta-nested gamma oscillations and oscillation-induced spike timing-dependent long-term potentiation impaired by amyloid β oligomers

Kyerl Park et al. BMC Biol. .

Abstract

Background: Abnormal accumulation of amyloid β1-42 oligomers (AβO1-42), a hallmark of Alzheimer's disease, impairs hippocampal theta-nested gamma oscillations and long-term potentiation (LTP) that are believed to underlie learning and memory. Parvalbumin-positive (PV) and somatostatin-positive (SST) interneurons are critically involved in theta-nested gamma oscillogenesis and LTP induction. However, how AβO1-42 affects PV and SST interneuron circuits is unclear. Through optogenetic manipulation of PV and SST interneurons and computational modeling of the hippocampal neural circuits, we dissected the contributions of PV and SST interneuron circuit dysfunctions on AβO1-42-induced impairments of hippocampal theta-nested gamma oscillations and oscillation-induced LTP.

Results: Targeted whole-cell patch-clamp recordings and optogenetic manipulations of PV and SST interneurons during in vivo-like, optogenetically induced theta-nested gamma oscillations in vitro revealed that AβO1-42 causes synapse-specific dysfunction in PV and SST interneurons. AβO1-42 selectively disrupted CA1 pyramidal cells (PC)-to-PV interneuron and PV-to-PC synapses to impair theta-nested gamma oscillogenesis. In contrast, while having no effect on PC-to-SST or SST-to-PC synapses, AβO1-42 selectively disrupted SST interneuron-mediated disinhibition to CA1 PC to impair theta-nested gamma oscillation-induced spike timing-dependent LTP (tLTP). Such AβO1-42-induced impairments of gamma oscillogenesis and oscillation-induced tLTP were fully restored by optogenetic activation of PV and SST interneurons, respectively, further supporting synapse-specific dysfunctions in PV and SST interneurons. Finally, computational modeling of hippocampal neural circuits including CA1 PC, PV, and SST interneurons confirmed the experimental observations and further revealed distinct functional roles of PV and SST interneurons in theta-nested gamma oscillations and tLTP induction.

Conclusions: Our results reveal that AβO1-42 causes synapse-specific dysfunctions in PV and SST interneurons and that optogenetic modulations of these interneurons present potential therapeutic targets for restoring hippocampal network oscillations and synaptic plasticity impairments in Alzheimer's disease.

Keywords: Alzheimer’s disease; Amyloid beta oligomers; Hippocampus; Optogenetics; Parvalbumin interneuron; Somatostatin interneuron; Spike timing-dependent long-term potentiation; Synapse-specific dysfunction; Theta-nested gamma oscillations.


Conflict of interest statement

The authors declare that they have no competing interests.

Figures
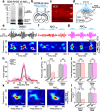
Fig. 1
Fig. 1
AβO1–42 impairs in vivo-like, optogenetically induced theta-nested gamma oscillations in hippocampal slices. a Western blot of SDS-PAGE showing AβO1–42 (trimer, tetramer, and large oligomers) after incubation at 4 °C for 0 h (left) and 18 h (right). b Micro-injection of AAV-CaMKII-ChR2-mCherry into hippocampal CA1 area of C57BL/6 mice. c Fluorescence image of ChR2-expressing PCs (ChR2-PC). SO, stratum oriens; SP, stratum pyramidale; SR, stratum radiatum. d Experimental schematic showing sinusoidal (5 Hz) blue light (470 nm) stimulation of ChR2-PC and field recordings in the CA1 area of hippocampal slices in vitro. e–g Sinusoidal blue light stimulation induces theta-nested gamma oscillations as shown in the band-pass filtered LFP (top) and the corresponding spectrograms (bottom) in DMSO-treated slice (e), after 20-min treatment of either AβO1–42 (f), or AβO42–1 (g). h–j Mean power spectral density (PSD, shade indicates SEM) of gamma oscillations (h), mean peak power (i), and mean peak frequency (j) of gamma oscillations in DMSO-treated slice (black) and following 20 min of AβO1–42 treatment in the same slices (red) or in DMSO-treated slice (black) and following 20 min AβO42–1 treatment in the same slices (magenta). k, l Representative comodulograms showing phase-amplitude coupling of gamma oscillations to theta cycle (k) and mean modulation index (l) in each condition. Paired Student’s t test (i, j, l, ***p < 0.001, ns: not significant). Data are represented as mean ± SEM
Fig. 2
Fig. 2
AβO1–42 causes synapse-specific dysfunction of PC-to-PV, but not PC-to-SST synapses. a, b Micro-injection of AAV-CaMKII-ChR2-mCherry and AAV-DIO-eYFP into CA1 area (left) and fluorescence image (right) of ChR2-expressing PCs (ChR2-PC) with eYFP-expressing PV interneurons (eYFP-PV) in PV-Cre mice (a) and ChR2-PC with eYFP-expressing SST interneurons (eYFP-SST) in SST-Cre mice (b). SO, stratum oriens; SP, stratum pyramidale; SR, stratum radiatum; SLM, stratum lacunosum-moleculare. c Experimental schematic. Whole-cell current-clamp recordings in CA1 PC, eYFP-PV, or eYFP-SST during sinusoidal (5 Hz) blue light (470 nm) stimulation (top) and representative spikes (bottom) in DMSO-treated (black) and AβO1–42-treated slices (red). d, e Mean spike frequency (d) and the number of spikes per theta cycle (e) recorded in CA1 PC (black), eYFP-PV (purple), and eYFP-SST (green). f Experimental schematic. Whole-cell voltage-clamp recordings in eYFP-PV/eYFP-SST during sinusoidal blue light stimulation (top) and representative EPSCs (bottom) in DMSO-treated (black) and AβO1–42-treated slices (red). g, h Mean EPSC amplitude (g) and mean EPSC frequency (h) in eYFP-PV (purple) and eYFP-SST (green). i Experimental schematic. Alveus stimulation to record PC-evoked EPSCs in eYFP-PV. j Representative PC-evoked EPSCs from eYFP-PV (left) and stimulus-response (S-R) curve (right) in DMSO-treated and AβO1–42-treated slices. k, l Representative PC-evoked EPSCs from eYFP-PV in response to alveus stimulation (10 pulses, 50 Hz, k, left), paired-pulse ratio (PPR) of the 2nd EPSC/1st EPSC (k, right), total EPSC charge (l, left), and EPSCs normalized to the 1st EPSC to show short-term plasticity (l, right) in DMSO-treated (filled circles) and AβO1–42-treated slices (empty circles). m–p Same as i–l but with PC-evoked EPSCs in eYFP-SST. Unpaired Student’s t test (d, e, g, h, k, l (left), o, p (left), ***p < 0.001, **p < 0.01, ns: not significant), two-way ANOVA with post hoc Tukey’s test (j, l (right), n, p (right), ###p < 0.001, ns: not significant). Data are represented as mean ± SEM
Fig. 3
Fig. 3
AβO1–42 causes synapse-specific dysfunction of PV-to-PC synapses, but not SST-to-PC synapses. a Experimental schematic. Whole-cell voltage-clamp recordings in CA1 PC (top) and representative IPSCs (bottom) during blue light-induced gamma oscillations in DMSO-treated (black), AβO1–42-treated slices (red), and DMSO-treated slice with GABAzine (gray). b, c Micro-injection of AAV-CaMKII-ChR2-mCherry and AAV-DIO-Arch-eYFP into CA1 area (top) and fluorescence image (bottom) of ChR2-expressing PCs (ChR2-PC) with Arch-expressing PV interneurons (Arch-PV) in PV-Cre mice (b) and ChR2-PC with Arch-expressing SST interneurons (Arch-SST) in SST-Cre mice (c). d, e Same as a but with inactivation of Arch-PV (d) and Arch-SST (e) using tonic yellow light (590 nm) stimulation in DMSO- and AβO1–42-treated slice. f, g Mean IPSC frequency (f) and mean IPSC amplitude (g) in each condition. h Micro-injection of AAV-DIO-ChR2-mCherry into CA1 area of PV-Cre mice (top) and fluorescence image (bottom) of ChR2-expressing PV interneurons (ChR2-PV). i, j Experimental schematic. Whole-cell voltage-clamp recordings in CA1 PC (i) to record PV-evoked IPSCs (j, left) and stimulus-response (S-R) curve (j, right) in response to different light stimulation powers. k, l Representative PV-evoked IPSCs in CA1 PC in response to light stimulation (10 pulses, 50 Hz, k, left), paired-pulse ratio (PPR) of the 2nd IPSC/1st IPSC (k, right), total IPSC charge (l, left), and IPSCs normalized to the 1st IPSC to show short-term plasticity (l, right) in DMSO-treated (filled circles) and AβO1–42-treated slices (empty circles). m–q Same as h–l but by activating ChR2-expressing SST interneurons (ChR2-SST) for SST-evoked IPSCs in SST-Cre mice. Unpaired Student’s t test (k, l (left), p, q (left), **p < 0.01, *p < 0.05, ns: not significant), one-way (f, g, ###p < 0.001, ##p < 0.01, ns: not significant) and two-way ANOVA with post hoc Tukey’s test (j, l (right), o, q (right), ###p < 0.001, #p < 0.05, ns: not significant). Data are represented as mean ± SEM
Fig. 4
Fig. 4
Optogenetic activation of PV interneurons restores AβO1–42-induced impairment of theta-nested gamma oscillations. a Micro-injection of AAV-CaMKII-ChR2-mCherry and AAV-DIO-C1V1-eYFP virus into CA1 area of PV-Cre mice. b Fluorescence image of ChR2-PC with C1V1-expressing PVs (C1V1-PV). c Experimental schematic. Sinusoidal (5 Hz) blue light (470 nm) and yellow light (590 nm) stimulation for activation of ChR2-PC and C1V1-PV, respectively, and field recording in CA1 area in AβO1–42-treated slices. d Sinusoidal blue and yellow light stimulation induces theta-nested gamma oscillations as shown in the band-pass filtered LFP (top) and the corresponding spectrogram (bottom), which results in the restoration of gamma oscillations in AβO1–42-treated slices. e–g Mean PSD (shade indicates SEM) of gamma oscillations (e), mean peak power (f), and mean peak frequency (g) of gamma oscillations in DMSO-treated slice (black), after 20-min treatment of AβO1–42 in the same slice (red), and with yellow light stimulation of C1V1-PV (yellow) during blue light-induced gamma oscillations. h, i Representative comodulograms showing phase-amplitude coupling of gamma oscillations to theta cycle (h) and mean modulation index (i) in each condition. j–n Schematic illustration of reciprocal PC-PV circuit (j), corresponding phase histogram (k), vector phases and lengths in polar plots (l), mean vector length (m), and circular mean vector phase (n) of CA1 PC’s spike, EPSC in PV, PV’s spike, and IPSC in CA1 PC recorded during gamma oscillations in each condition. One-way repeated-measures (f, g, i), one-way ANOVA with post hoc Tukey’s test (m, ###p < 0.001, ##p < 0.01, #p < 0.05, ns: not significant), and Watson-Williams test (n, ***p < 0.001, **p < 0.01, *p < 0.05, ns: not significant). Data are represented as mean ± SEM. Data in kn was collected from the different number of slices (DMSO 23, AβO1–42 18, AβO1–42 + C1V1-PV 14) and animals (DMSO 17, AβO1–42 10, AβO1–42 + C1V1-PV 8)
Fig. 5
Fig. 5
Optogenetic activation of SST interneurons restores AβO1–42-induced impairment of theta-nested gamma oscillation-induced tLTP. a Experimental schematic. Whole-cell current-clamp recordings in CA1 PC and Schaffer collateral (SC) stimulation for theta-nested gamma oscillation-like tLTP induction at CA3-CA1 excitatory synapses. b tLTP was induced by pairing presynaptic SC stimulation with postsynaptic CA1 PC spike bursts (4 spikes at 100 Hz) with a + 10 ms time window, repeated 200 times at 5 Hz. Inset: enlarged EPSP evoked by presynaptic SC stimulation, scale bar 10 ms, 1 mV. c–e EPSP slopes normalized to mean of 10-min baseline in DMSO-treated slice (c), + D-AP5 (50 μM) in DMSO-treated slice (d) and in AβO1–42-treated slices (e). Black arrow: onset of tLTP induction. Test pathways (filled circles), control pathways (empty circles). Insets: representative EPSPs at indicated time points (1, 2 or 1′, 2′). f Mean of normalized EPSPs slopes of last 5 min of test (filled bars) and control pathways (empty bars) in DMSO-treated slices (black), + D-AP5 in DMSO-treated slices (dotted black) and in AβO1–42-treated slices (red). g Micro-injection of AAV-DIO-ChR2-mCherry to CA1 area in SST-Cre and PV-Cre mice (top) and fluorescence images (bottom) of ChR2-expressing SST interneurons (ChR2-SST, left) and ChR2-expressing PV interneurons (ChR2-PV, right). h–j Same as c–e but tLTP induction with blue light stimulation (blue bar) for ChR2-SST activation (h), for ChR2-SST activation in the presence of D-AP5 (50 μM, i), and for activation of ChR2-PV (j) in AβO1–42-treated slices. k Same as f but with ChR2-SST activation (green), ChR2-SST activation in the presence of D-AP5 (dotted green), and ChR2-PV activation (purple) in AβO1–42-treated slices. Paired Student’s t test for comparing test and control pathways (f, k, *p < 0.05, ns: not significant), one-way ANOVA with post-hoc Tukey’s test for comparing test pathways in different conditions (f, k, #p < 0.05). Data are represented as mean ± SEM
Fig. 6
Fig. 6
AβO1–42 causes dysfunction of SST interneuron-mediated disinhibition to CA1 PC. a, b Experimental setup for whole-cell voltage-clamp recordings of IPSCs in CA1 PC during theta-nested gamma oscillation-like tLTP induction. CA1 PC spikes were elicited by stimulating the CA1 PC axons in CA1 alveus. c IPSCs evoked by SC stimulation alone (black) and pairing of SC stimulation with alveus stimulation in DMSO-treated slices (gray). Disinhibition was measured by the difference in IPSCs amplitudes of the two conditions. d Same as c but in AβO1–42-treated slices. e, f Same as a–c but with activation of ChR2-expressing SST interneuron (ChR2-SST) with blue light (470 nm) in AβO1–42-treated slices. g Comparison of disinhibition of IPSCs amplitude in DMSO-treated (black), AβO1–42-treated slices (red) and with activation of ChR2-SST interneuron in AβO1–42-treated slices (blue). One-way ANOVA with post hoc Tukey’s test (g, #p < 0.05, ns: not significant). Data are represented as mean ± SEM
Fig. 7
Fig. 7
Distinct roles of PV and SST interneurons in gamma oscillogenesis and theta-nested gamma oscillation-induced tLTP. a Schematic diagram of CA3-CA1 hippocampal network model consisting of Hodgkin-Huxley-type computational models of CA1 PC, PV interneuron (PV model), SST interneuron (SST model), and a feedforward inhibition-mediating interneuron (IN model). The CA3 input activates IN and also provides excitation to the dendritic spine of the CA1 PC. b Firing rate plotted as a function of depolarizing current steps in 20 pA in PV interneuron (purple) and SST interneuron (green) recorded in vitro (empty circle, data from Additional file 4: Figure S4c, l), and that of the PV and SST models (filled circle). c Schematic of a deterministic [Ca2+]i-dependent spike timing-dependent plasticity (STDP) model. d A simulation of theta-nested gamma oscillation-induced tLTP. Oscillatory current (Itheta, 5 Hz, 20 pA) superimposed with a step current (Istep, 15 pA) was simulated to CA1 PC (top) to mimic gamma-frequency spikes in CA1 PC (middle). For tLTP induction, stimulation of CA3 input preceded the CA1 PC spikes by 10 ms, repeated at 5 Hz (bottom). e, f Representative raster plot of each neuron model with SST activation (e) or without SST activation (f). g Representative [Ca2+]i at CA1 PC spine during tLTP induction with SST activation (black) or without SST activation (red). h Change in the normalized synaptic weight of CA3-CA1 synapse plotted as a function of time with (black) and without SST activation (red)

Similar articles

Cited by

References

    1. Hardy J, Selkoe DJ. The amyloid hypothesis of Alzheimer’s disease: progress and problems on the road to therapeutics. Science. 2002;297(5580):353–356. doi: 10.1126/science.1072994. - DOI - PubMed
    1. Selkoe DJ. Alzheimer’s disease is a synaptic failure. Science. 2002;298(5594):789–791. doi: 10.1126/science.1074069. - DOI - PubMed
    1. Walsh DM, Selkoe DJ. Deciphering the molecular basis of memory failure in Alzheimer’s disease. Neuron. 2004;44(1):181–193. doi: 10.1016/j.neuron.2004.09.010. - DOI - PubMed
    1. Lambert MP, Barlow AK, Chromy BA, Edwards C, Freed R, Liosatos M, Morgan TE, Rozovsky I, Trommer B, Viola KL, et al. Diffusible, nonfibrillar ligands derived from Abeta1-42 are potent central nervous system neurotoxins. Proc Natl Acad Sci U S A. 1998;95(11):6448–6453. doi: 10.1073/pnas.95.11.6448. - DOI - PMC - PubMed
    1. Verret L, Mann EO, Hang GB, Barth AM, Cobos I, Ho K, Devidze N, Masliah E, Kreitzer AC, Mody I, et al. Inhibitory interneuron deficit links altered network activity and cognitive dysfunction in Alzheimer model. Cell. 2012;149(3):708–721. doi: 10.1016/j.cell.2012.02.046. - DOI - PMC - PubMed

Publication types

LinkOut - more resources