. 2020 Jan 14;21(1):11.
doi: 10.1186/s13059-019-1913-y.

HIFI: estimating DNA-DNA interaction frequency from Hi-C data at restriction-fragment resolution

Affiliations

HIFI: estimating DNA-DNA interaction frequency from Hi-C data at restriction-fragment resolution

Christopher Jf Cameron et al. Genome Biol. .

Abstract

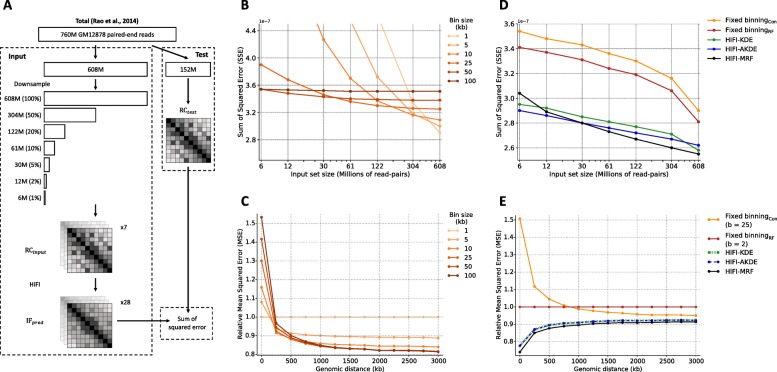
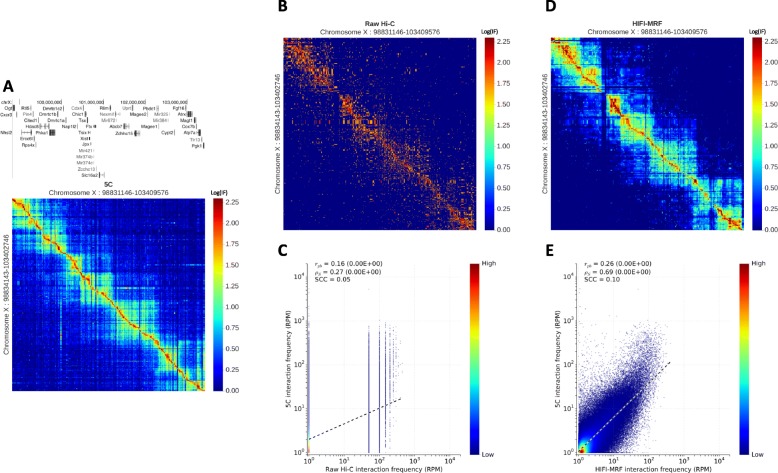
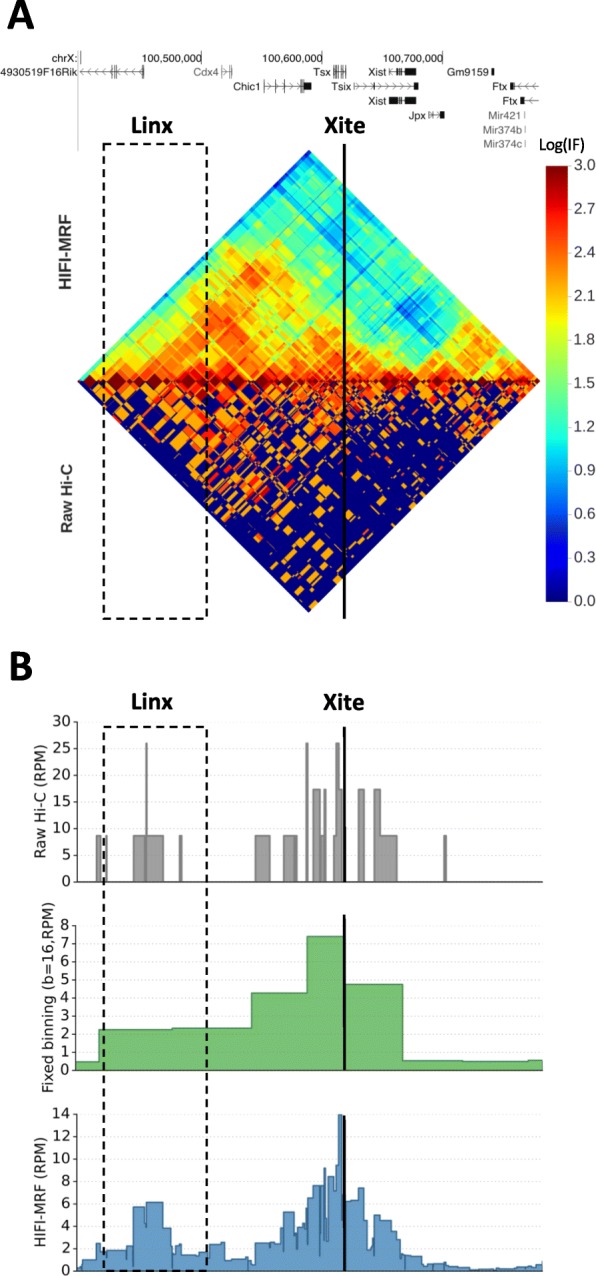
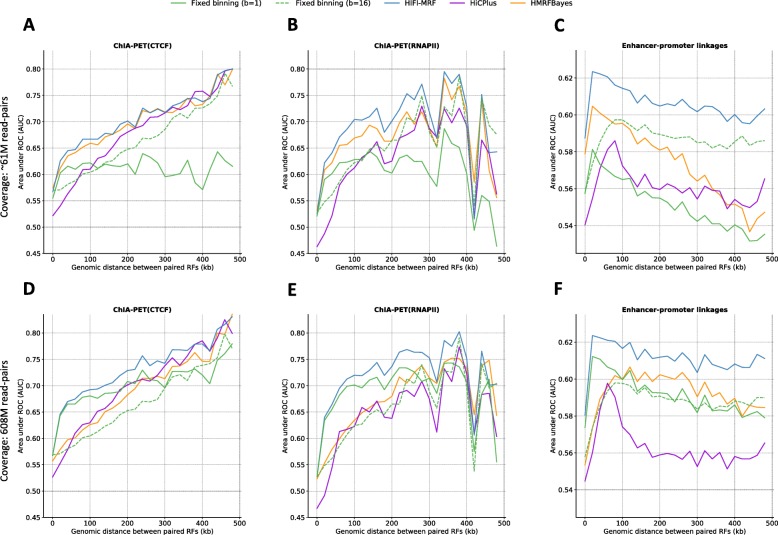
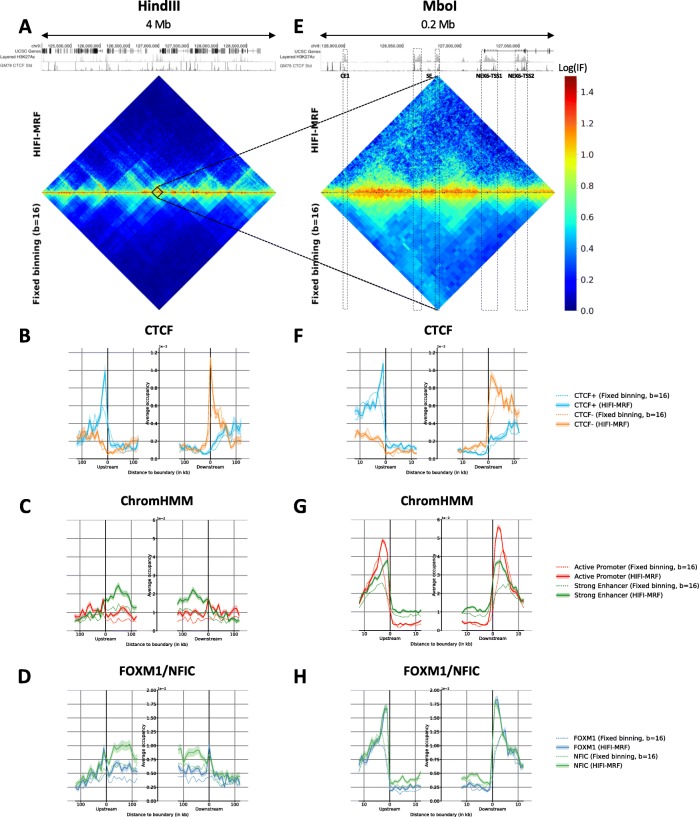
Hi-C is a popular technique to map three-dimensional chromosome conformation. In principle, Hi-C's resolution is only limited by the size of restriction fragments. However, insufficient sequencing depth forces researchers to artificially reduce the resolution of Hi-C matrices at a loss of biological interpretability. We present the Hi-C Interaction Frequency Inference (HIFI) algorithms that accurately estimate restriction-fragment resolution Hi-C matrices by exploiting dependencies between neighboring fragments. Cross-validation experiments and comparisons to 5C data and known regulatory interactions demonstrate HIFI's superiority to existing approaches. In addition, HIFI's restriction-fragment resolution reveals a new role for active regulatory regions in structuring topologically associating domains.

Keywords: 5C; ChIA-PET; Chromosome conformation capture; Density estimation; Hi-C; Markov random field; Topologically associating domains; subTADs.


Conflict of interest statement

The authors declare that they have no competing interests.

Figures

Fig. 1
Fig. 1
Cross-validation of fixed-binning and HIFI methodologies. a Schematic representation of cross-validation methodology to assess the accuracy of fixed-binning and proposed HIFI methodologies. b Cross-validation error for canonical fixed-binning approaches, for different bin sizes, as a function of coverage, see also Additional file 1: Figure S1 for similar analyses of RF fixed binning, HIFI-KDE, and HIFI-AKDE. c Analysis of canonical fixed-binning error (relative to error with one RF per bin) across genomic distance between RF-pairs. No singular bin size performs best for all genomic distances. d Comparison of errors for different approaches. For fixed binning and HIFI-KDE, the optimal bin size or bandwidth was chosen separately for each coverage level. Nonetheless, HIFI-MRF outperforms all other approaches. e Comparison of errors (relative to error obtained with fixed binning using two RFs per bin) by genomic distance of RF pairs, using as input a set of 304M read pairs (50% of total training set). HIFI-MRF performs best across all distances
Fig. 2
Fig. 2
Recapitulation of 5C observations by HIFI-MRF. a IF matrix obtained by 5C of the 4.5-Mb locus surrounding the Xist gene in mouse embryonic stem cells [7]. Note the use of true-size heatmaps, where the height (resp. width) of a row (resp. column) is proportional to the size of the RF it represents. b Raw, RF resolution Hi-C data for the same region [6]. c Correlation of 5C and raw Hi-C data at RF resolution (Pearson rpb = 0.16, p value <10−16; Spearman ρs = 0.27, two-sided Student’s t test p value <10−16); stratum-adjusted correlation coefficient (SCC) [30] = 0.05). d IF matrix estimated by HIFI-MRF from the same Hi-C data. Observe the similarity to the 5C data in a. e Correlation of 5C and HIFI-MRF-processed Hi-C data at RF resolution (Pearson rpb = 0.26, p value <10−16; Spearman ρs = 0.69, p value <10−16); SCC = 0.10)
Fig. 3
Fig. 3
HIFI-MRF reveals fine-scale regulatory contacts in Hi-C data. Heatmap (a) and virtual 4C [60, 61] plots based on raw, binned, or HIFI-MRF processed data (b) showing the long-range interaction between Tsix and its transcriptional regulator, Linx, on chromosome X of female mice as observed by Nora et al. [7] using 5C. This interaction is more easily observed in HIFI-MRF data than in raw or binned Hi-C data
Fig. 4
Fig. 4
Positive/negative RF contact delineation analysis. The ability of different HiC data analysis approaches to distinguish positive from negative (control) contacts is measured, for various data sets, using the area under the receiver operating characteristic curve (AUROC) for univariate predictors using as input the predicted IF values. a, d CTCF-mediated contacts identified by ChIA-PET [33]. b, e RNAPII-mediated contacts identified by ChIA-PET [33], c, f Inferred enhancer-promoter linkages based on DHS correlation [35]. To allow for the comparison with HiCPlus and HMRFBayes, only contacts occurring on chromosomes 9 to 22, X, and Y, and within a distance of 1 Mb, are analyzed. Top (ac) and bottom (df) rows represent the performance of the classifiers applied to Hi-C data of size 60.8M (10% of input set) and 608M (100% of input set), respectively. Genome-wide results for HIFI are shown in Additional file 1: Figure S8. Similar results are observed for ChIA-PET RAD21 (Additional file 1: Figure S9)
Fig. 5
Fig. 5
Analysis of RF resolution TAD and subTAD boundaries in GM12878. Analyses were performed on both Hi-C data resulting from a HindIII (3.4 kb per RF on average (ad)) and a MboI restriction digest (434 bp per RF on average (eh), from Rao et al. [23]). TAD and subTAD boundary predictions were made on IF matrices produced either by HIFI-MRF or a fixed-binning approach (16 RF per bin, i.e., approx. 50 kb per bin for HindIII and 7 kb per bin for MboI). a IF matrices produced by HIFI-MRF (top) and fixed binning (bottom) for a 4-Mb locus surrounding the NEK6 locus (chr9:124999244-128993971). b, f CTCF occupancy as a function of distance to the nearest TAD (b) or subTAD (f) boundary, separately for sites on the forward and reverse strands. Convergent CTCF sites are enriched at both TAD and subTAD boundaries. Shaded band indicate 95% confidence intervals of the estimate of the mean occupancy. c, g Coverage of active promoters (red) and strong enhancers (green) identified by ChromHMM, as a function of the distance to the nearest TAD (c) or subTAD (g) boundary. These regions are very strongly enriched just outside of subTAD boundaries, but less so around TAD boundaries. d, h Occupancy of two transcription factors, FOXM1 and NFIC, as a function of distance to the nearest TAD (b) or subTAD (f) boundary. While most TFs have an occupancy peak at TAD and subTAD boundaries, the extent of the enrichment within TADs varies from low (e.g., FOXM1) to high (e.g., NFIC). e IF matrices produced by HIFI-MRF (top) and fixed binning (bottom) for the 200-kb NEK6 locus (chr9:126879748-127079891). Regulatory regions identified in Huang et al. [62] are marked SE (super enhancer), CE1 (conventional enhancer), and NEK6-TSS1 and NEK6-TSS2 (alternative promoters). Notice how all these regions lie between visible subTADs

References

    1. Dekker J, Rippe K, Dekker M, Kleckner N. Capturing chromosome conformation. Science. 2002;295(5558):1306–11. doi: 10.1126/science.1067799. - DOI - PubMed
    1. Fraser J, Williamson I, Bickmore WA, Dostie J. An overview of genome organization and how we got there: from FISH to Hi-C. Microbiol Mol Biol Rev. 2015;79(3):347–72. doi: 10.1128/MMBR.00006-15. - DOI - PMC - PubMed
    1. Holwerda S, de Laat W. Chromatin loops, gene positioning, and gene expression. Front Genet. 2012;3:217. doi: 10.3389/fgene.2012.00217. - DOI - PMC - PubMed
    1. Cavalli G, Misteli T. Functional implications of genome topology. Nat Struct Mol Biol. 2013;20(3):290–9. doi: 10.1038/nsmb.2474. - DOI - PMC - PubMed
    1. Lieberman-Aiden E, van Berkum NL, Williams L, Imakaev M, Ragoczy T, Telling A, Amit I, Lajoie BR, Sabo PJ, Dorschner MO, Sandstrom R, Bernstein B, Bender MA, Groudine M, Gnirke A, Stamatoyannopoulos J, Mirny LA, Lander ES, Dekker J. Comprehensive mapping of long-range interactions reveals folding principles of the human genome. Science. 2009;326(5950):289–93. doi: 10.1126/science.1181369. - DOI - PMC - PubMed

Publication types

Grants and funding

LinkOut - more resources