. 2020 Feb 20;7(1):ENEURO.0303-19.2019.
doi: 10.1523/ENEURO.0303-19.2019. Print 2020 Jan/Feb.

Optogenetic Control of Spine-Head JNK Reveals a Role in Dendritic Spine Regression

Affiliations

Optogenetic Control of Spine-Head JNK Reveals a Role in Dendritic Spine Regression

Patrik Hollos et al. eNeuro. .

Abstract

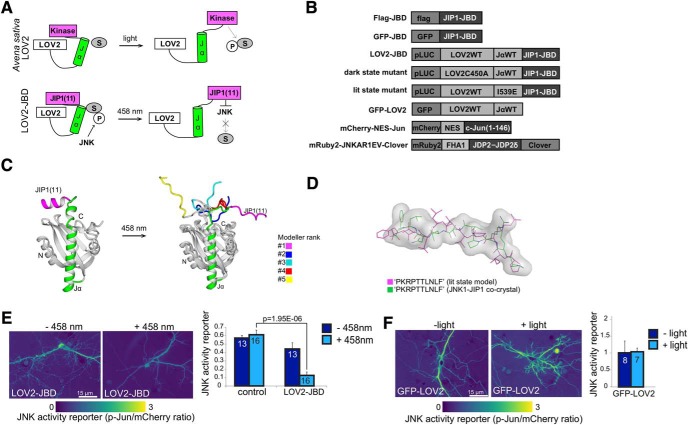
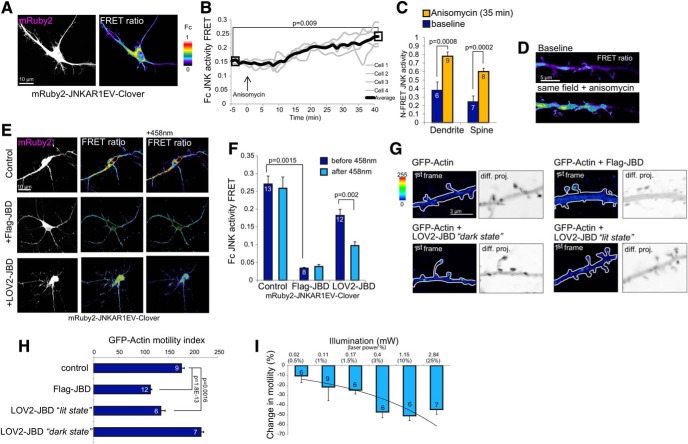
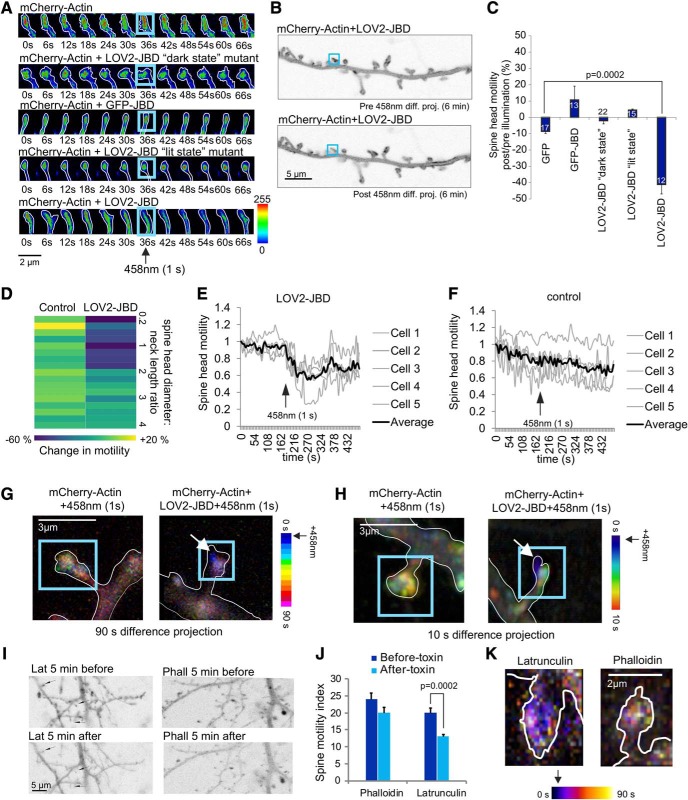
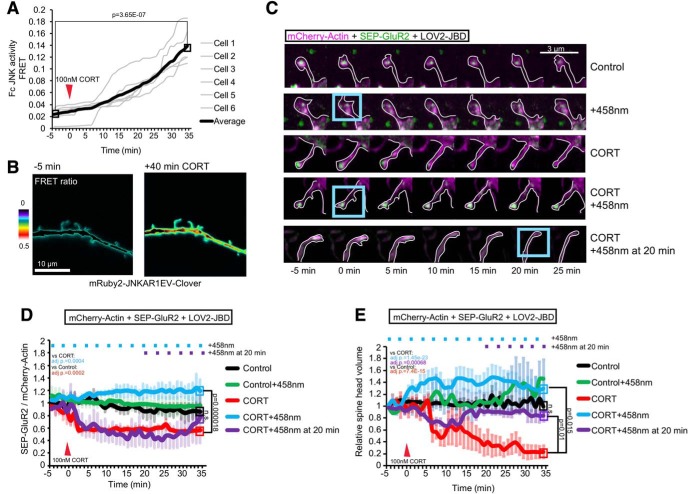
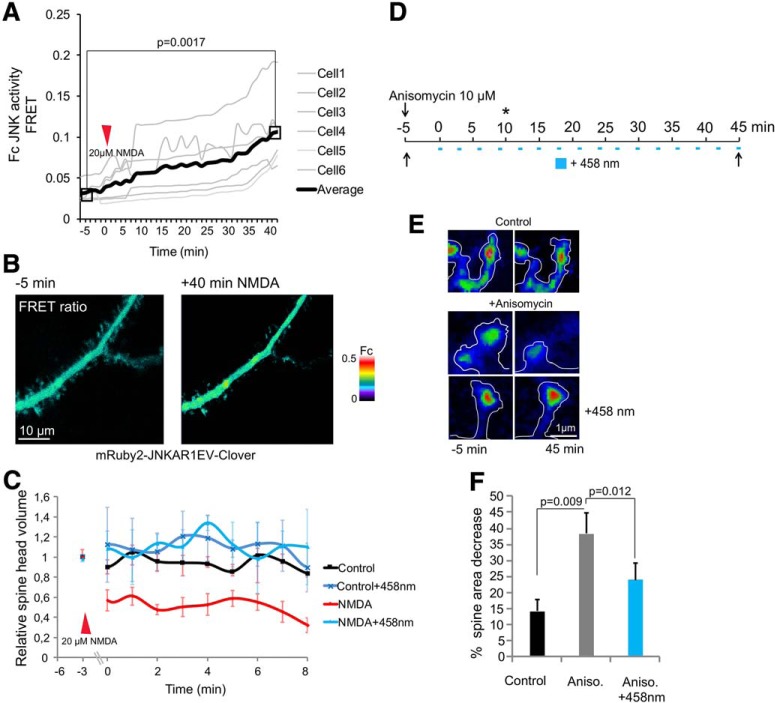
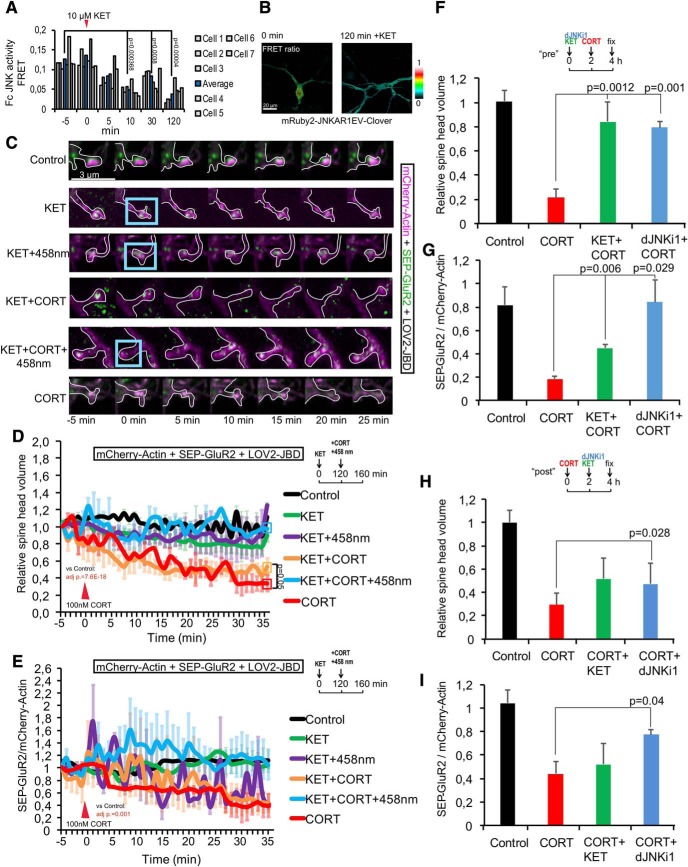
In this study, we use an optogenetic inhibitor of c-Jun NH2-terminal kinase (JNK) in dendritic spine sub-compartments of rat hippocampal neurons. We show that JNK inhibition exerts rapid (within seconds) reorganization of actin in the spine-head. Using real-time Förster resonance energy transfer (FRET) to measure JNK activity, we find that either excitotoxic insult (NMDA) or endocrine stress (corticosterone), activate spine-head JNK causing internalization of AMPARs and spine retraction. Both events are prevented upon optogenetic inhibition of JNK, and rescued by JNK inhibition even 2 h after insult. Moreover, we identify that the fast-acting anti-depressant ketamine reduces JNK activity in hippocampal neurons suggesting that JNK inhibition may be a downstream mediator of its anti-depressant effect. In conclusion, we show that JNK activation plays a role in triggering spine elimination by NMDA or corticosterone stress, whereas inhibition of JNK facilitates regrowth of spines even in the continued presence of glucocorticoid. This identifies that JNK acts locally in the spine-head to promote AMPAR internalization and spine shrinkage following stress, and reveals a protective function for JNK inhibition in preventing spine regression.

Keywords: elimination; hippocampal neurons; kinase; optogenetics; spine; stress.


Figures

Figure 1.
Figure 1.
Design and validation of the LOV2-JBD inhibitor. A, Schematic showing activation of LOV2 photo-domain from Avena sativa by light. The proposed mode of action of LOV2-JBD is shown in the lower panel where an 11-mer peptide inhibitor of JNK is released from the constrained conformation on photostimulation, facilitating binding to and inhibition of JNK. B, Constructs used in this study. C, Superimposed, top five lit-state model predictions for LOV2-JBD. In the top-ranked model, JIP1(11) (magenta) takes on a relaxed conformation projecting away from the core. D, JIP1(11) from the lit-state model (magenta) superimposed on the crystal structure of JIP1(11) from the JNK1-JIP1 co-crystal (green). E, mCherry-NES-Jun fluorescence provides a surrogate reporter of JNK activity in hippocampal neurons expressing mCherry-NES-Jun (control) or mCherry-NES-Jun with LOV2-JBD. Reporter activity is fluorescence intensity of phosphorylated c-Jun (P-Jun)/mCherry fluorescence intensity. Photostimulation of LOV2-JBD reduces JNK activity in hippocampal neurons; however (F) photostimulation of GFP-LOV2 does not. Data on dark-state and lit-state mutants are in Extended Data Figure 1-1. Mean data ± SEM and Student’s t test p values are shown. Cell numbers (from at least two experimental repeats) are indicated on the bars.
Figure 2.
Figure 2.
Photoactivation of LOV2-JBD reduces actin dynamics in dendritic spines. A, Hippocampal neurons expressing mRuby2-JNKAR1EV-Clover FRET reporter provide a real-time readout of JNK activity. The mRuby2 image (left) indicates reporter expression and FRET image (right) indicates JNK activity, which is high in the cytoplasmic compartment. The look up table (LUT) shows FRET ratios (Fc) from 0 to 1. B, mRuby2-JNKAR1EV-Clover FRET reporter activity from hippocampal neuron dendrites increases following JNK activation following anisomycin (10 μM) treatment. C, N-FRET shows that JNK is activated in dendrites and spines 40 min following anisomycin (10 μM). Mean data ± SEM are shown; p values are from Student’s t test. Extended Data Figure 2-1 shows mRuby2-JNKAR1EV-Clover FRET has improved dynamic range compared to YPET-JNKAR1EV-CFP. D, Representative image of mRuby2-JNKAR1EV-Clover FRET in dendritic spines. E, FRET images from live cell analysis indicate Flag-JBD inhibits JNK, as does LOV2-JBD following photostimulation for 30 s with 0.4 mW of 458-nm laser. F, Corrected FRET (Fc) from multiple experiments as described in E. Measurements were from five regions of interest per cell, from four cells from at least two experimental repeats. Mean data ± SEM are shown. Adjusted p values are shown from repeated measures one-way ANOVA with Bonferroni correction. Extended Data Figure 2-2 shows independent readout of JNK activity changed due to excitation of the FRET probe with 488-nm laser. G, GFP-actin displacement is shown in arithmetic difference projections (diff. proj.) depicting summed GFP-actin displacements from 11-min imaging. Darker pixels represent higher motility. Scale bar = 3 μm. H, Calculated motility index from several recordings as described in G. Flag-JBD and LOV2-JBD lit-state mutants significantly reduce spine motility. Mean data ± SEM are shown. Adjusted p values are shown from repeated measures one-way ANOVA with Bonferroni correction I, The minimal illumination required to photoactivate LOV2-JBD is shown. Motility changes from neurons expressing mCherry-actin plus LOV2-JBD and exposed to increasing 458-nm illlumination are shown; 0.4 mW (achieved using 3% laser power) was the minimum irradiance needed to elicit a maximal response. Motility was calculated from four to six spines per cell and two to three cells per condition from at least two experimental repeats.
Figure 3.
Figure 3.
Photoactivation of the LOV2-JBD inhibitor rapidly reduces actin motility in the peripheral domain of the spine. A, Time-lapse sequences from 16-d hippocampal neurons expressing mCherry-actin and LOV2-JBD variants. ROIs (blue squares) encompassing spine-heads were photostimulated for 1 s at 36 s using 0.4 mW of 458-nm light. Spine-head motility was reduced following light only in cells expressing LOV2-JBD. Additional examples are in Extended Data Figure 3-1A. B, Arithmetic difference projections of mCherry-actin before (pre) and after (post) 458-nm illumination of the spine (blue box). LOV2-JBD immobilized mCherry-actin in photoactivated spines only. Dendritic shaft mCherry-actin was unchanged. C, Quantitative data on mCherry actin motility. Mean data ± SEM are shown. Spine numbers are indicated on the bars. D, mCherry-actin motility changes are plotted according to spine head diameter:neck length ratio. Data from spines with head diameter:neck length ratios corresponding to “mushroom” spines is in Extended Data Figure 3-1B. E, Time-lapse of spine-head mCherry-actin motility shows LOV2-JBD immobilizes actin motility within 6 s of photoactivation. F, Light alone does not alter actin dynamics. For E-F, more than or equal to four spines were measured per cell. G, Color-coded time projections provide spatial information on mCherry-actin motility over 90-s recording. Photoactivation is at 0 s. Images are acquired at 6-s intervals and coded with a unique hue (LUT). Mixed color (white-ish) indicates continued motility over time. Blue indicates no further movement after that time point. LOV2-JBD-expressing neurons display reduced motility following light. H, Higher resolution maximum projections of temporally color-coded dendritic spines are shown from 10-s time lapses acquired at 1-s intervals. These show mCherry-actin is immobilized in the spine periphery. Additional examples with actin footprints and movies generated from the time lapses are in Extended Data Figure 3-1CE. I, The effect of latrunculin and phalloidin on dendritic spine motility were tested. Arithmetic projection images before and after 458-nm light indicate effect on actin dynamics. J, Quantitative data from I indicate that latrunculin reduces actin motility. Measurements are from ≥10 cells and multiple spines from separate experiments. Mean data ± SEM are shown. K, Temporal color coding of spines from neurons treated with latrunculin or phalloidin are shown.
Figure 4.
Figure 4.
Corticosterone activates JNK and induces SEP-GluR2 removal and spine regression. A, Time-lapse recording of JNK activity in dendritic spines after corticosterone (CORT) application. Normalized Fc FRET is from six cells and more than or equal to four spines per cell. B, Representative FRET ratio images from mRuby2-JNKAR1EV-Clover expressing cells. C, Representative images of time-lapse sequences (D, E) from 16-d hippocampal neurons expressing mCherry-actin (magenta), SEP-GluR2 (green), and LOV2-JBD. Cells were treated with CORT (100 nM) at 0 min, and LOV2-JBD was photoactivated using 458-nm 1-s light pulses (using 3% laser power, LSM-880 Airyscan) applied to ROI (blue boxes) at 3-min intervals where indicated (+458 nm), or in lower panels, after a 20 min delay. SEP-GluR2 was imaged using the 488-nm laser (0.8% laser power with LSM-880 Airyscan), to minimize cross-activation of LOV2-JBD. D, Quantitative data on cell surface SEP-GluR2 fluorescence is from eight experiments as depicted in C. E, Estimated spine-head volume is normalized to baseline volume, averaged over 3 min before treatment. Extended Data Figure 4-1 shows experiments repeated as in C–E with CORT treatment using YFP as an inert filler instead of mCherry-actin. Quantitative data are calculated from eight experiments. Mean data ± SEM are shown. Adjusted p values comparing full timelines are from repeated measures one-way ANOVA with Bonferroni correction.
Figure 5.
Figure 5.
NMDA activates spine-head JNK and induces retraction. A, Time lapse of JNK activity from mRuby2-JNKAR-1EV-Clover FRET reporter. ROI FRET (Fc) was measured from spines of 16-d hippocampal neurons before and after NMDA (20 μM). B, Representative FRET images before and after NMDA. C, The estimated spine-head volume from neurons expressing mCherry-actin and LOV2-JBD before (–3 min) or after treatment with NMDA are shown. Continuous photoactivation of LOV2-JBD was achieved using 1-s pulses of 458-nm laser (3% power) at 3-min intervals. LOV2-JBD photoactivation prevented NMDA-induced spine retraction. D, The experimental setup for anisomycin (10 μM) treatment and photoactivation timeline is shown. The “*” indicates time point at which JNK was activated. E, Neurons were treated with or without anisomycin and spine volume measured at 45 min (as described in D). Anisomycin induced spine retraction which was prevented by LOV2-JBD photoactivation. F, Mean data ± SEM from 20–24 spines/treatment is shown. Adjusted p values comparing full timelines are shown from repeated measures one-way ANOVA with Bonferroni correction.
Figure 6.
Figure 6.
Ketamine inhibits JNK and prevents spine regression when given prophylactically, whereas JNK inhibition provides more robust rescue even 2 h after CORT. A, We tested the effect of ketamine (10 μM) on JNK activity in 16-d hippocampal neurons using the mRuby2-JNKAR1EV-Clover FRET reporter. FC FRET responses in spine-head ROIs are from 7 separate experiments plotted individually; p values are shown from repeated measures one-way ANOVA with Bonferroni correction. Ketamine inhibited JNK activity, visible by 10 min postaddition. B, The effect was long lasting. Representative FRET ratio images show mRuby2-JNKAR1EV-Clover JNK activity reporter FRET before and 2 h following ketamine. C, Representative images of 16-d hippocampal neurons expressing mCherry-actin (magenta), SEP-GluR2 (green) ± LOV2-JBD. Cells were stimulated with 100 nM corticosterone (CORT) or 10 μM ketamine (KET), as indicated. Blue boxes indicate ROI where 458-nm light was applied (1-s pulses at 3-min intervals) to photoactivate LOV2-JBD. D, Estimated spine volume changes were calculated from multiple images as shown in C, normalized to baseline. Eight cells, four spines per cell were used. E, Quantitative data of cell surface SEP-GluR2 (SEP-Glur2 fluorescence/mCherry-actin fluorescence) are shown from the same cells as in D. Measurements are from eight experiments. F, Dendritic spine volume changes were calculated from cells pretreated with 10 μM ketamine or 10 μM DJNKI-1 (to inhibit JNK) 2 h before addition of CORT (100 nM) for 2 h. G, Cell surface SEP-GluR2 levels (SEP-GluR2 fluorescence/mCherry-actin fluorescence) was measured from the same cells. H, Estimated spine volume changes were from more than or equal to eight experiments; 16-d neurons were treated with CORT (100 nM) for 2 h followed by KET (10 μM) or DJNKI-1 (10 μM). Estimated spine volume was measured and volume at 4 h was expressed relative to control. I, Cell surface GluR2 levels (SEP-GluR2/mCherry-actin) were calculated from the same cells. Mean data ± SEM are shown. Adjusted p values are shown from repeated measures one-way ANOVA with Bonferroni correction.

References

    1. Attardo A, Fitzgerald JE, Schnitzer MJ (2015) Impermanence of dendritic spines in live adult CA1 hippocampus. Nature 523:592–596. 10.1038/nature14467 - DOI - PMC - PubMed
    1. Basu S, Saha PK, Roszkowska M, Magnowska M, Baczynska E, Das N, Plewczynski D, Wlodarczyk J (2018) Quantitative 3-D morphometric analysis of individual dendritic spines. Sci Rep 8:3545. 10.1038/s41598-018-21753-8 - DOI - PMC - PubMed
    1. Bennett S, Thomas AJ (2014) Depression and dementia: cause, consequence or coincidence? Maturitas 79:184–190. 10.1016/j.maturitas.2014.05.009 - DOI - PubMed
    1. Berry KP, Nedivi E (2017) Spine dynamics: are they all the same? Neuron 96:43–55. 10.1016/j.neuron.2017.08.008 - DOI - PMC - PubMed
    1. Bertling E, Englund J, Minkeviciene R, Koskinen M, Segerstråle M, Castrén E, Taira T, Hotulainen P (2016) Actin tyrosine-53-phosphorylation in neuronal maturation and synaptic plasticity. J Neurosci 36:5299–5313. 10.1523/JNEUROSCI.2649-15.2016 - DOI - PMC - PubMed

Publication types