. 2020 Jan 14;11(1):e03042-19.
doi: 10.1128/mBio.03042-19.

Quantitative Framework for Model Evaluation in Microbiology Research Using Pseudomonas aeruginosa and Cystic Fibrosis Infection as a Test Case

Affiliations

Quantitative Framework for Model Evaluation in Microbiology Research Using Pseudomonas aeruginosa and Cystic Fibrosis Infection as a Test Case

Daniel M Cornforth et al. mBio. .

Abstract

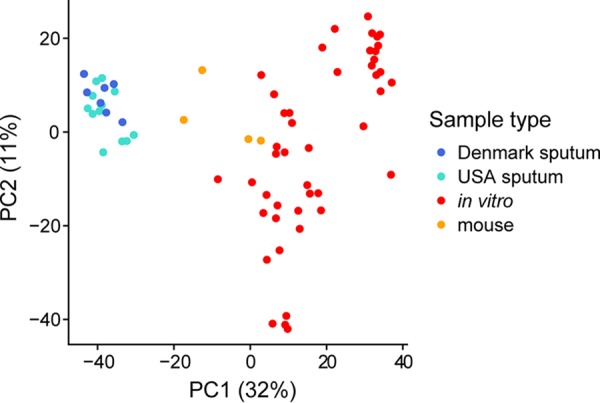
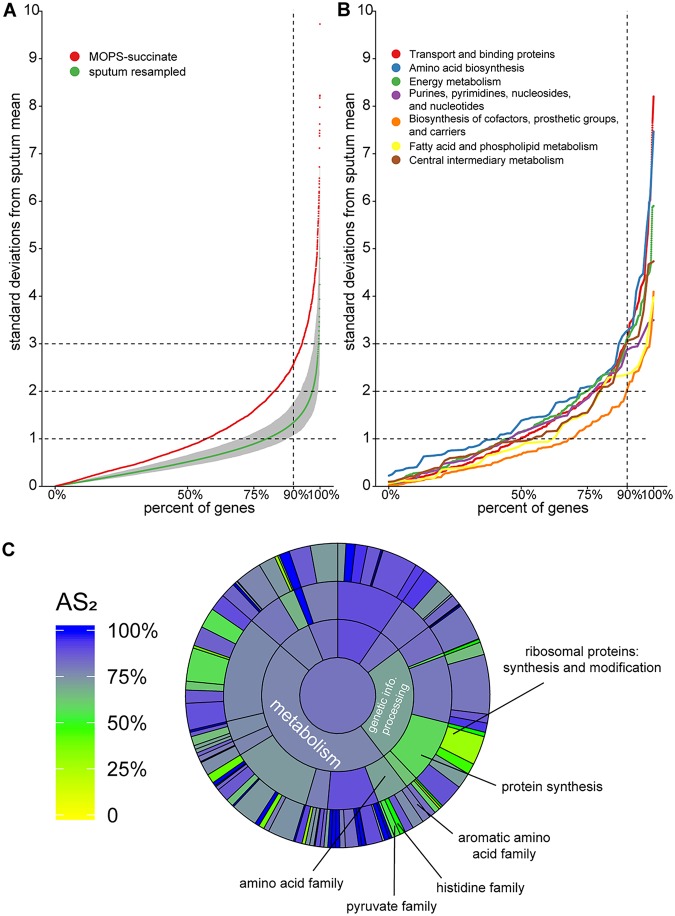
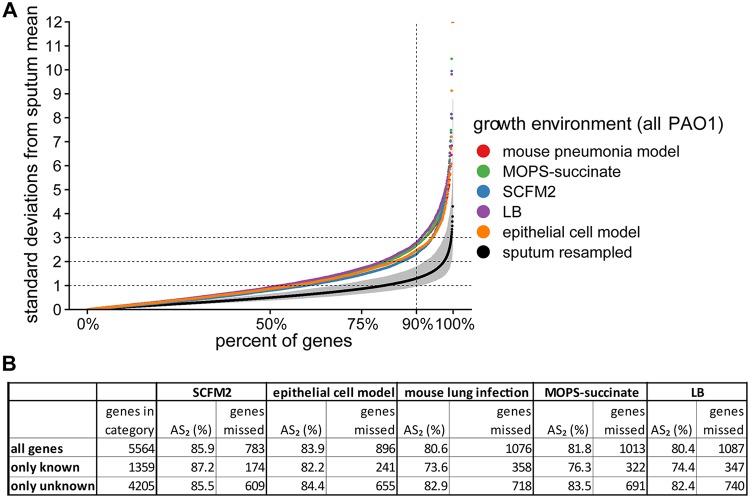
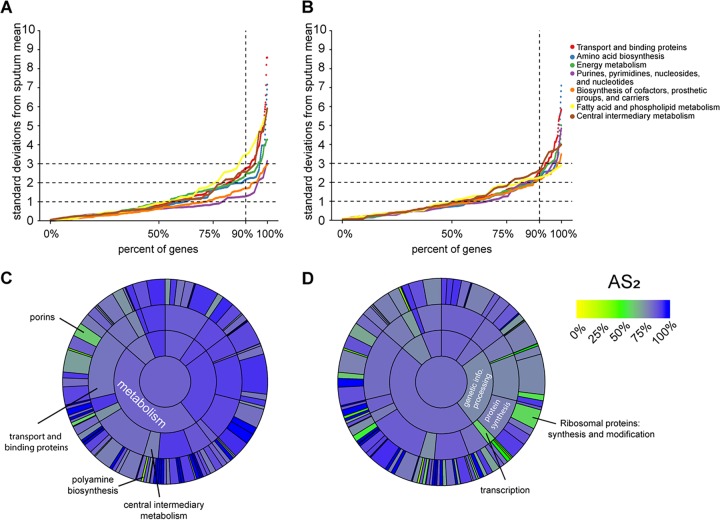
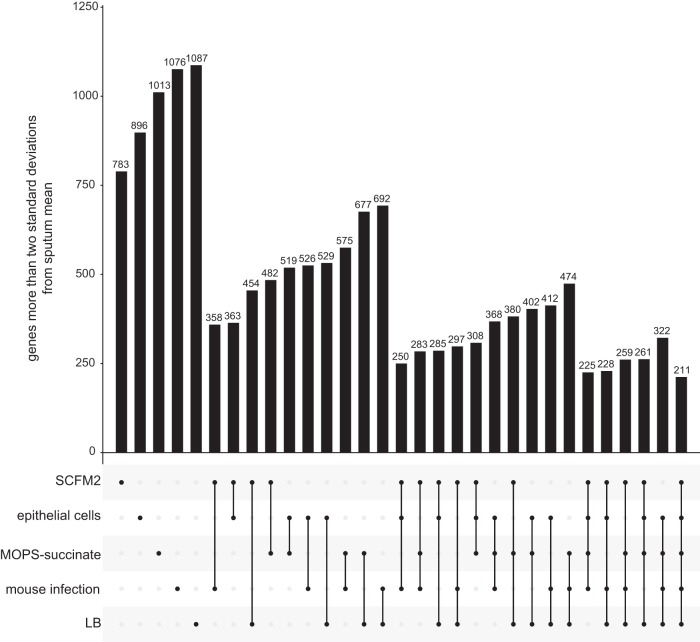
Laboratory models are a cornerstone of modern microbiology, but the accuracy of these models has not been systematically evaluated. As a result, researchers often choose models based on intuition or incomplete data. We propose a general quantitative framework to assess model accuracy from RNA sequencing data and use this framework to evaluate models of Pseudomonas aeruginosa cystic fibrosis (CF) lung infection. We found that an in vitro synthetic CF sputum medium model and a CF airway epithelial cell model had the highest genome-wide accuracy but underperformed on distinct functional categories, including porins and polyamine biosynthesis for the synthetic sputum medium and protein synthesis for the epithelial cell model. We identified 211 "elusive" genes that were not mimicked in a reference strain grown in any laboratory model but found that many were captured by using a clinical isolate. These methods provide researchers with an evidence-based foundation to select and improve laboratory models.IMPORTANCE Laboratory models have become a cornerstone of modern microbiology. However, the accuracy of even the most commonly used models has never been evaluated. Here, we propose a quantitative framework based on gene expression data to evaluate model performance and apply it to models of Pseudomonas aeruginosa cystic fibrosis lung infection. We discovered that these models captured different aspects of P. aeruginosa infection physiology, and we identify which functional categories are and are not captured by each model. These methods will provide researchers with a solid basis to choose among laboratory models depending on the scientific question of interest and will help improve existing experimental models.

Keywords: Pseudomonas aeruginosa; cystic fibrosis; infection; model; transcriptomics.


Figures

FIG 1
FIG 1
P. aeruginosa transcriptomes from human CF sputum cluster distinctly from in vitro and mouse acute lung transcriptomes using principal-component analysis. The analysis is based on 2,606 genes that had at least one read mapping to them in all samples (see Data Set S2 for this shared gene list). For clarity, in all laboratory conditions, only one replicate from each experiment is shown, which is identified in Data Set S1 in the supplemental material.
FIG 2
FIG 2
Genome-wide accuracy metric for strain PAO1 grown planktonically in MOPS-succinate. (A) Percentages of PAO1 genes (x axis) within different numbers of standard deviations of the mean expression in human CF sputum (y axis). For each gene, the mean and standard deviation of normalized read counts among the sputum samples were calculated. The mean expression for each gene in MOPS-succinate was then determined, and a z-score (the number of standard deviations each gene is from the mean expression in CF sputum) was calculated. For reference, we performed the same procedure on 100 randomly resampled pairs of human CF sputum samples to provide a robust assessment of the variance in these samples (sputum resampled). The mean and 95% confidence interval for each of these resampled values for each gene are shown. Any genes with values over 10 standard deviations from the sputum mean are not shown. (B) An accuracy metric was calculated for PAO1 grown in MOPS-succinate for all TIGRFAM metabolism meta roles. (C) AS2 for each TIGRFAM meta role, main role, and sub role category for PAO1 grown in MOPS-succinate. The color in the middle represents the AS2 for all PAO1 genes (those with or without TIGRFAM designations). The next level out from the middle of the circle contains “meta roles,” the next contains “main roles,” and the outermost layer contains “sub roles.” The area of each category is proportional to the number of genes in that category.
FIG 3
FIG 3
Genome-wide accuracy metric for PAO1 grown in five model systems. The model systems include an acute mouse pneumonia model, planktonic growth in MOPS-succinate, SCFM2 with no shaking, planktonic growth in LB, and growth in a CF airway epithelial cell model. (A) Percentage of PAO1 genes (x axis) within different numbers of standard deviations of the mean expression in human CF sputum (y axis) for each model, calculated as described in Fig. 2A. For reference, we performed the same procedure on 100 randomly resampled pairs of human CF sputum samples to provide a robust assessment of the variance in these samples (sputum resampled). The mean and 95% confidence interval of these resampled values for each gene is shown. Any genes with values over 12 standard deviations from the sputum mean are not shown. (B) Table containing the accuracy scores (AS2) and number P. aeruginosa genes in each model not within two standard deviations of the mean in CF sputum (genes missed). The genes are divided into “all genes,” “known, and “unknown.” “Unknown” refers to genes that have a TIGRFAM “main role” with either no category designation, have a “main role” annotated as “unknown function,” or are not annotated in the TIGRFAM database. We calculated pairwise t tests between sample types using genome-wide AS2 scores for individual replicates in each sample type, with a Bonferroni adjustment for multiple tests. The most significant comparisons between model types were for SCFM2 compared to LB (P = 0.015), the mouse pneumonia model (P = 0.018), and MOPS-succinate (P = 0.073). All other model pairs had adjusted P values of >0.2.
FIG 4
FIG 4
Accuracy metric for TIGRFAM subcategories for P. aeruginosa PAO1 in SCFM2 and the CF airway epithelial cell infection model. (A and B) Percentages of P. aeruginosa PAO1 genes within each TIGRFAM metabolism sub role” whose mean expression in SCFM2 (A) and CF airway epithelial cell infection model (B) transcriptomes fall within different numbers of standard deviations of the mean expression in sputum samples (absolute value of z-score, calculated as described in Fig. 2A). (C and D) AS2 for each TIGRFAM meta role, main role, and sub role category for SCFM2 (C) and the CF airway epithelial cell infection model (D). The color in the middle represents the AS2 for all PAO1 genes (those with or without TIGRFAM designations). The next level out from the middle of the circle contains “meta roles,” the next contains “main roles,” and the outermost layer contains “sub roles.” The area of each category is proportional to the number of genes in that category.
FIG 5
FIG 5
Number of genes whose expression is not within two standard deviations of the CF sputum transcriptome means for any infection model among each possible combination of models. For example, the sixth bar indicates that 358 genes have expression outside two standard deviations from the mean of sputum sample transcriptomes for both SCFM2, as well as for the mouse pneumonia model. The final column indicates that 211 genes have expression outside two standard deviations in all of the five evaluated models.

References

    1. Lagier J-C, Edouard S, Pagnier I, Mediannikov O, Drancourt M, Raoult D. 2015. Current and past strategies for bacterial culture in clinical microbiology. Clin Microbiol Rev 28:208–236. doi: 10.1128/CMR.00110-14. - DOI - PMC - PubMed
    1. Zak O, Sande MA. 1999. Handbook of animal models of infection. Elsevier, New York, NY.
    1. Rossi E, Falcone M, Molin S, Johansen HK. 2018. High-resolution in situ transcriptomics of Pseudomonas aeruginosa unveils genotype independent pathophenotypes in cystic fibrosis lungs. Nat Commun 9:3459. doi: 10.1038/s41467-018-05944-5. - DOI - PMC - PubMed
    1. Turner KH, Everett J, Trivedi U, Rumbaugh KP, Whiteley M. 2014. Requirements for Pseudomonas aeruginosa acute burn and chronic surgical wound infection. PLoS Genet 10:e1004518. doi: 10.1371/journal.pgen.1004518. - DOI - PMC - PubMed
    1. Kragh KN, Alhede M, Rybtke M, Stavnsberg C, Jensen PO, Tolker-Nielsen T. 2018. The inoculation method could impact the outcome of microbiological experiments. Appl Environ Microbiol 84:e02264-17. doi: 10.1128/AEM.02264-17. - DOI - PMC - PubMed

Publication types