. 2020 Jan 14;11(1):277.
doi: 10.1038/s41467-019-14068-3.

Dynamic organelle distribution initiates actin-based spindle migration in mouse oocytes

Affiliations

Dynamic organelle distribution initiates actin-based spindle migration in mouse oocytes

Xing Duan et al. Nat Commun. .

Abstract

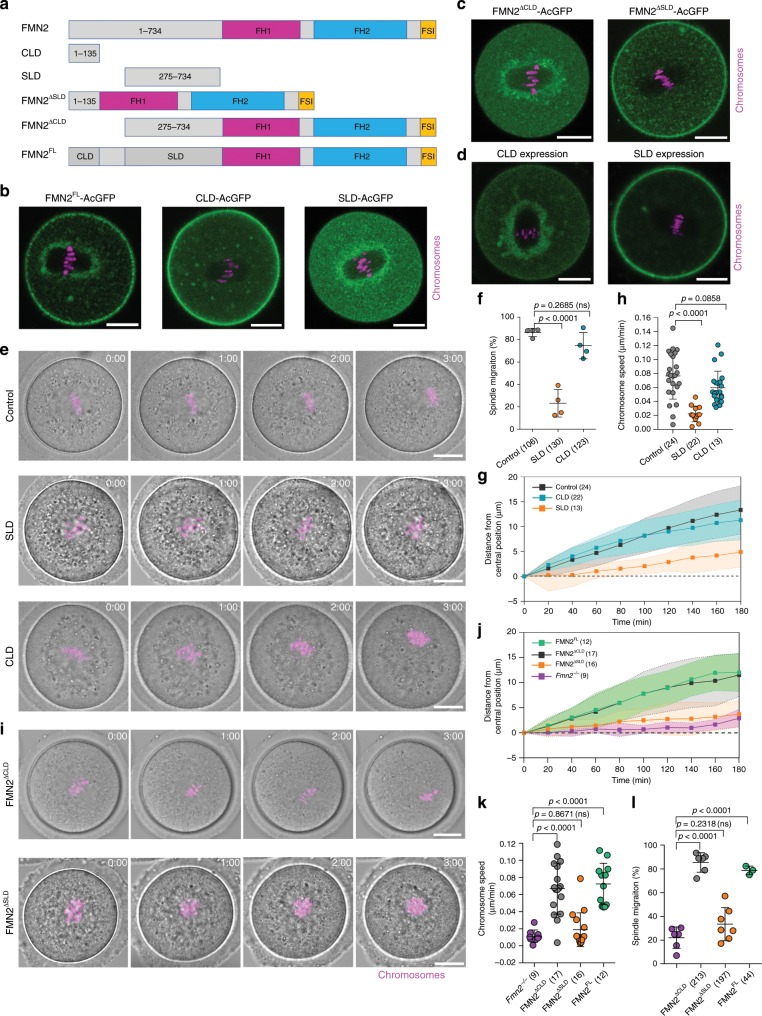
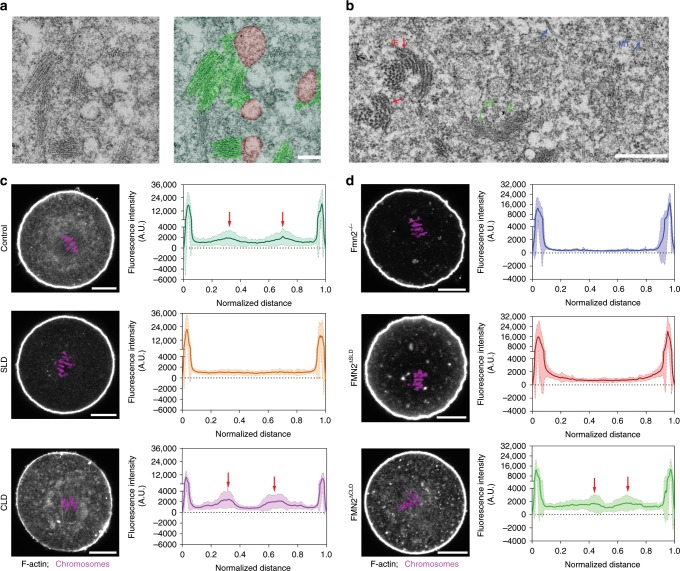
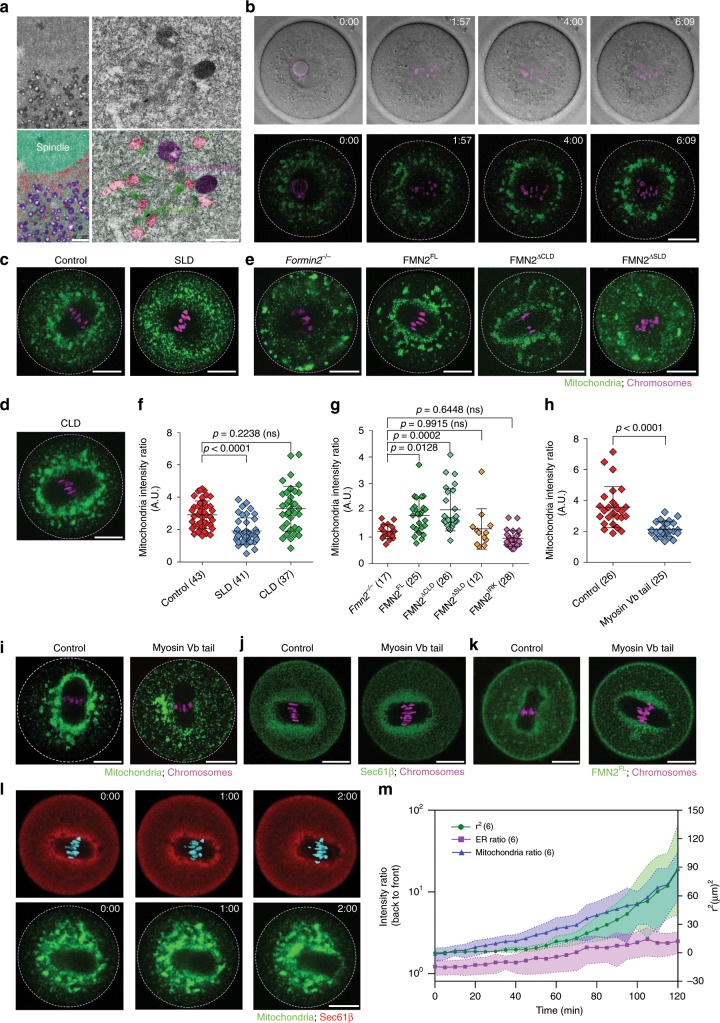
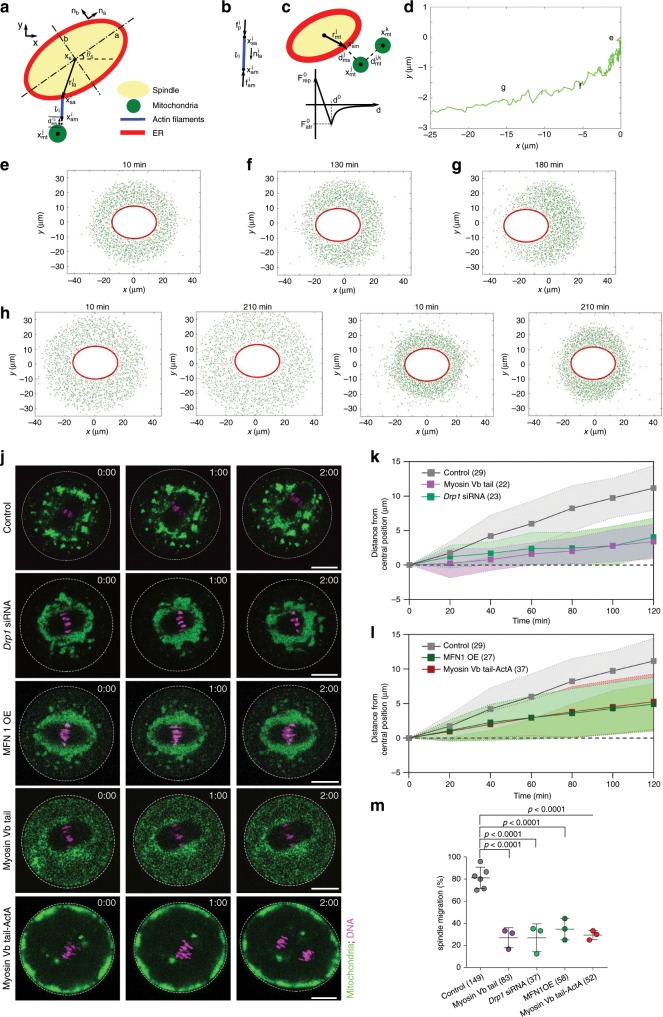
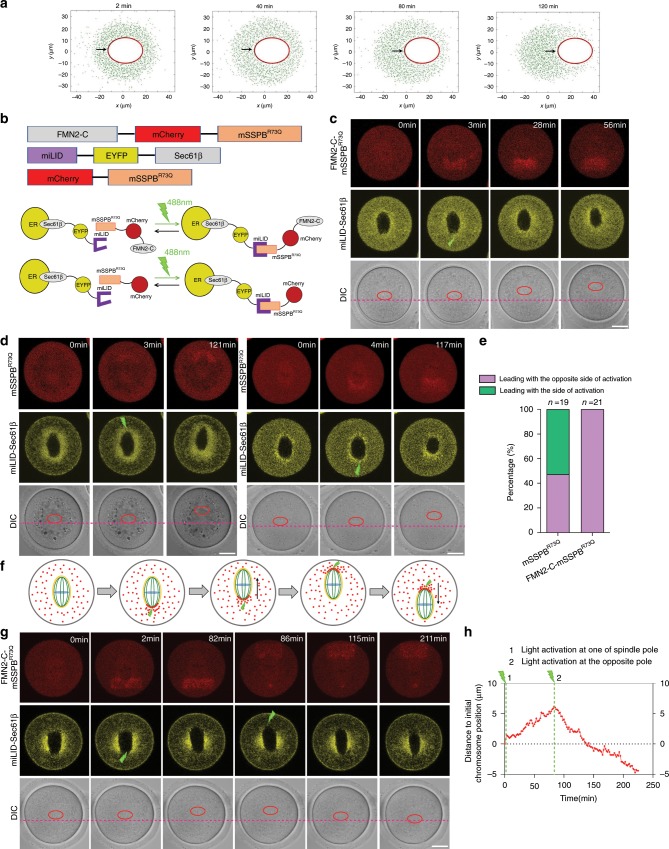
Migration of meiosis-I (MI) spindle from the cell center to a sub-cortical location is a critical step for mouse oocytes to undergo asymmetric meiotic cell division. In this study, we investigate the mechanism by which formin-2 (FMN2) orchestrates the initial movement of MI spindle. By defining protein domains responsible for targeting FMN2, we show that spindle-periphery localized FMN2 is required for spindle migration. The spindle-peripheral FMN2 nucleates short actin bundles from vesicles derived likely from the endoplasmic reticulum (ER) and concentrated in a layer outside the spindle. This layer is in turn surrounded by mitochondria. A model based on polymerizing actin filaments pushing against mitochondria, thus generating a counter force on the spindle, demonstrated an inherent ability of this system to break symmetry and evolve directional spindle motion. The model is further supported through experiments involving spatially biasing actin nucleation via optogenetics and disruption of mitochondrial distribution and dynamics.


Conflict of interest statement

The authors declare no competing interests.

Figures

Fig. 1
Fig. 1. Spindle peripheral targeting of FMN2 is necessary and sufficient for MI spindle migration.
a Schematic diagrams showing various FMN2 constructs used in this study. FH1: formin homology domain 1; FH2: formin homology domain 2; FSI: formin–spire interaction. b Images showing the localization of full length FMN2 (green), aa 1–135 region of FMN2 (cortical localization domain: CLD) and aa 275–734 (spindle periphery localization domain: SLD) in wild-type oocytes. Scale bar, 20 µm. c Representative images (green) show the localization of FMN2∆CLD and FMN2∆SLD in wild-type oocytes. Representative results, n = 23 (left) and 7 (right). Scale bar, 20 µm. d Representative images show the effect of SLD and CLD expressions on full-length FMN2 localization. Representative results, n = 5 (left) and 20 (right). Scale bar, 20 µm. e Representative time-lapse images of spindle/chromosomes migration in wild-type oocytes or oocytes with SLD or CLD expression. Scale bar, 20 µm. f Quantification of the percentage of oocytes that underwent spindle migration after SLD and CLD expressions in wild-type oocytes from four independent experiments. g Chromosomes were tracked in oocytes as shown in e and the chromosomes movements were plotted. Data are represented as mean ± SD, from three independent experiments. h The speed of spindle/chromosomes migration was analyzed from the plots in g. Data are from three independent experiments. i Representative time-lapse images of chromosomes migration after FMN2∆SLD and FMN2∆CLD expression in Fmn2−/ oocytes. Representative results, n = 16 (upper) and 17 (lower). Scale bar, 20 µm. j The centroids of chromosomes were tracked and chromosomes movements were plotted as the distance from the initial central position over time. Data are from three independent experiments. k The speed of chromosomes migration was analyzed from the plots in j. l Quantification of the percentage of oocytes that underwent spindle migration after FMN2∆SLD, FMN2∆CLD, FMN2FL expression in Fmn2−/− oocytes. Data are from at least three independent experiments. All the data in this figure were analyzed by one side ANOVA, Tukey’s multiple comparisons test. Data are represented as mean ± SD, and oocyte numbers are indicated in brackets. Source data are provided as a Source Data file.
Fig. 2
Fig. 2. Spindle peripheral FMN2 is required for actin polymerization surrounding the spindle.
a Representative EM images of MI oocytes show that short bundles of actin filaments form comet tail-like end-on association with the surface of ER-like vesicles. Red, ER-like vesicles. Green, F-actin bundles. Representative results, n = 3. Scale bar, 0.2 µm. b Representative EM images of MI oocytes show different appearance and thickness of microfilament (MF, green arrow), intermediate filament (IF, red arrow) or microtubule (MT, blue arrow). Representative results, n = 3. Scale bar, 0.5 µm. c Representative images of rhodamine phalloidin staining of F-actin after SLD or CLD expression in wild-type oocytes. The accumulation of F-actin surrounding the spindle was disrupted in oocytes expressing SLD but not CLD. The curves show the average of fluorescence intensity trace of actin along a thick line crossing the mid-zone of the MI spindle and the shades show the SD of the central lines (see Supplementary Fig. 1c). Red arrows point to actin intensity peaks around the spindle. n = 21 (control), n = 13 (CLD), n = 21 (SLD). Scale bar, 20 µm. d Representative images of phalloidin staining in Fmn2/− oocytes with FMN2∆SLD or FMN2∆CLD expression. FMN2∆CLD rescued the spindle peripheral F-actin accumulation in Fmn2−/− oocytes. Line traces of average fluorescence intensity of actin and SD (shade) are shown as in c. n= 19 (Fmn2/−), n = 15 (FMN2∆CLD), n = 17 (FMN2∆SLD). Scale bar, 20 µm.
Fig. 3
Fig. 3. Dynamic distribution of mitochondria during MI spindle migration.
a Electron microscopy images showing the concentration of mitochondria immediately outside the ER-like vesicles zone surround the spindle. Red, ER-like vesicles. Purple, mitochondria, Green, actin filaments. n = 3. Scale bar, left: 2 µm; right: 0.5 µm. b Representative time-lapse DIC images (upper panels) and images of mitochondrial distribution (low panels) during and after GVBD in wild-type oocyte. n = 8. Scale bar, 20 µm. c, d Representative images of mitochondria distribution in control (n= 43), SLD-expressing (c, n= 41) and CLD-expressing (d, n= 37) oocytes. Scale bar, 20 µm. e Representative images of mitochondria distribution in Fmn2/− oocyte (n = 17) without or with the expression of FMN2FL (n = 25), FMN2∆CLD (n = 26), and FMN2∆SLD (n = 12). Scale bar, 20 µm. f Quantification of mitochondria accumulation around spindle (mitochondria at spindle periphery/mitochondria outside spindle periphery) in control, SLD and CLD-expressing wild-type oocytes. Data are from four independent experiments. g Quantification of mitochondria accumulation around the spindle in Fmn2/− oocyte, or FMN2FL, FMN2∆CLD, FMN2∆SLD, FMN2IRK-expressing Fmn2−/− oocytes. Data are from three independent experiments. h Quantification of mitochondria accumulation around the spindle in control and myosin Vb tail-expressing oocytes. Data are from four independent experiments. Two-tailed unpaired t-test. i Representative images of mitochondria distribution in control (n = 26) and myosin Vb tail-expressing (n = 25) oocytes. Scale bar, 20 µm. j and k Representative images of ER (j, n= 17) and FMN2 (k, n = 12)) localization in control and myosin Vb tail-expressing oocytes. Scale bar, 20 µm. l Representative time-lapse images of ER and mitochondria distribution during spindle migration in wild-type oocytes. Scale bar, 20 µm. m Quantification of mitochondria and ER distribution during spindle migration. Green line: r2; Blue line: mitochondria ratio; Magenta line: ER ratio. SD was shown by the shade. The data in Fig. 5f, g was analyzed by one-side ANOVA, Tukey’s multiple comparisons test. Data are represented as mean ± SD. Source data are provided as a Source Data file. Oocyte numbers are indicated in brackets.
Fig. 4
Fig. 4. A Mathematical model of MI spindle migration.
a Illustration of the coordinate system of the spindle, actin filaments, and mitochondria. The ER, which carries FMN2, is assumed to attach to the spindle at all time. More details of the model can be found in the section “Methods”. b Force balance on each actin filament. c Top: illustration of the repulsion and attraction force among mitochondria and between the spindle and mitochondria. Bottom: Diagram of the repulsion and attraction force as a function of distance d. d Trajectory of the center of the spindle in the control case. eg Simulations showing the relative position of the spindle and the mitochondria distribution at three different time points as marked in the trajectory in d. e Initial state, f starting migration, g mid-way of migration. Note that due to their very short length, actin filaments are not visible in these representations. h Model for myosin Vb tail expression. i Model for Drp1 knockdown. j Representative time-lapse images of mitochondria distribution during spindle migration in control siRNA-injected (n = 29), Drp1 siNRA-injected (n = 23), myosin Vb tail-expressing (n = 22), MFN1 over-expressing (OE) (n = 27), or Myosin Vb tail-Acta-expressing oocytes (n = 37). Green, mitochondria. Magenta, chromosomes. Scale bar, 20 µm. k, l Centroids of chromosomes were tracked in oocytes and the movement of chromosomes position were plotted in Drp1 siRNA-injected, myosin Vb tail-expressing (k), MFN1 OE, or myosin Vb tail-Acta-expressing (l) oocytes. Data are represented as mean ± SD, from three independent experiments. Oocyte numbers are indicated in brackets. m Quantification of the percentage of oocytes that underwent spindle migration for WT oocyte, Drp1 siRNA-injected, MFN1OE, myosin Vb tail-expressing, and myosin Vb tail-ActA-expressing oocytes. See Supplementary Fig. 6a, b for the efficiency of Drp1 knockdown. Data are represented as mean ± SD. Data are from three independent experiments. One side ANOVA, Tukey’s multiple comparisons test. Data are represented as mean ± SD. Oocyte numbers are indicated in brackets. Source data are provided as a Source Data file.
Fig. 5
Fig. 5. Asymmetric actin nucleation leads to biased direction of spindle migration.
a A representative of 15 simulations showing each time that if the initial distribution of actin nucleation is asymmetric between the two spindle halves, the spindle will move to the side opposite to the one with more actin nucleation, as a result of more pushing force at the end with more actin nucleation. (The black arrow shows the pole of spindle that has more actin nucleation). b Top: constructs used for optogenetic activation of additional actin nucleation at one end of the spindle, the C-terminal half of FMN2 was fused to mCherry-mSSPBR73Q domain, Sec61β fused to miLID-EYFP. Bottom: illumination with 488 nm light leads to miLID domain binding with mSSPBR73Q, thus recruiting FMN2-C-mCherry or the control mCherry alone to the ER. c Recruitment of FMN2-C-mCherry-mSSPBR73Q to one spindle pole (green strike) by photoactivation of the miLID-EYFP-Sec61β induced the spindle movement with the opposite pole leading. Red ellipses show the positions of chromosomes. Red lines show the initial positions of chromosomes. n = 21. Scale bar, 20 µm. d Recruitment of the control mCherry-mSSPBR73Q to one spindle pole (green strikes) resulted in roughly equal frequency for each pole to lead the spindle movement. Red ellipses show the positions of chromosomes. Red lines show the initial chromosomes positions. n = 19. Scale bar, 20 µm. e Quantification of spindle migration direction after recruiting mCherry-mSSPBR73Q or FMN2-C-mCherry-mSSPBR73Q to one spindle pole. n= 19 (mCherry-mSSPBR73Q), n = 21 (FMN2-C-mCherry-mSSPBR73Q). f Schematics of the experiment in which FMN2-C-mCherry-mSSPBR73Q was recruited to one of the spindle poles by the first light exposure (green strike at 2 min), and after the spindle initiated apparent movement, a second illumination recruited FMN2-C-mCherry-mSSPBR73Q to the opposite pole (green strike at 86 min). g A representative montage from the experiment described in f, showing the second illumination reversed the direction of spindle migration. Red ellipses show the positions of chromosomes. Red lines show the initial chromosome positions. n = 5. Scale bar, 20 µm. h A plot of the movement of chromosome position in g. Green strike represents the time of two different activations by 488 nm light. Source data are provided as a Source Data file.

References

    1. Maro B, Verlhac MH. Polar body formation: new rules for asymmetric divisions. Nat. Cell Biol. 2002;4:E281–E283. doi: 10.1038/ncb1202-e281. - DOI - PubMed
    1. Li L, Zheng P, Dean J. Maternal control of early mouse development. Development. 2010;137:859–870. doi: 10.1242/dev.039487. - DOI - PMC - PubMed
    1. Sun QY, Schatten H. Regulation of dynamic events by microfilaments during oocyte maturation and fertilization. Reproduction. 2006;131:193–205. doi: 10.1530/rep.1.00847. - DOI - PubMed
    1. Clift D, Schuh M. Restarting life: fertilization and the transition from meiosis to mitosis. Nat. Rev. Mol. Cell Biol. 2013;14:549–562. doi: 10.1038/nrm3643. - DOI - PMC - PubMed
    1. Li R, Albertini DF. The road to maturation: somatic cell interaction and self-organization of the mammalian oocyte. Nat. Rev. Mol. Cell Biol. 2013;14:141–152. doi: 10.1038/nrm3531. - DOI - PubMed

Publication types

MeSH terms