Comparative Study
. 2020 Jan 14;11(1):247.
doi: 10.1038/s41467-019-14118-w.

Integrated single cell analysis of blood and cerebrospinal fluid leukocytes in multiple sclerosis

Affiliations
Comparative Study

Integrated single cell analysis of blood and cerebrospinal fluid leukocytes in multiple sclerosis

David Schafflick et al. Nat Commun. .

Abstract

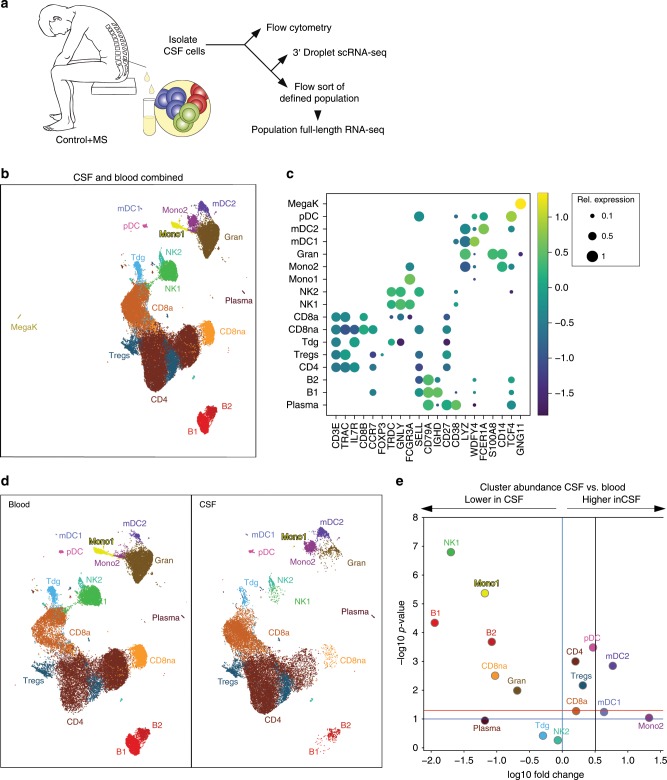
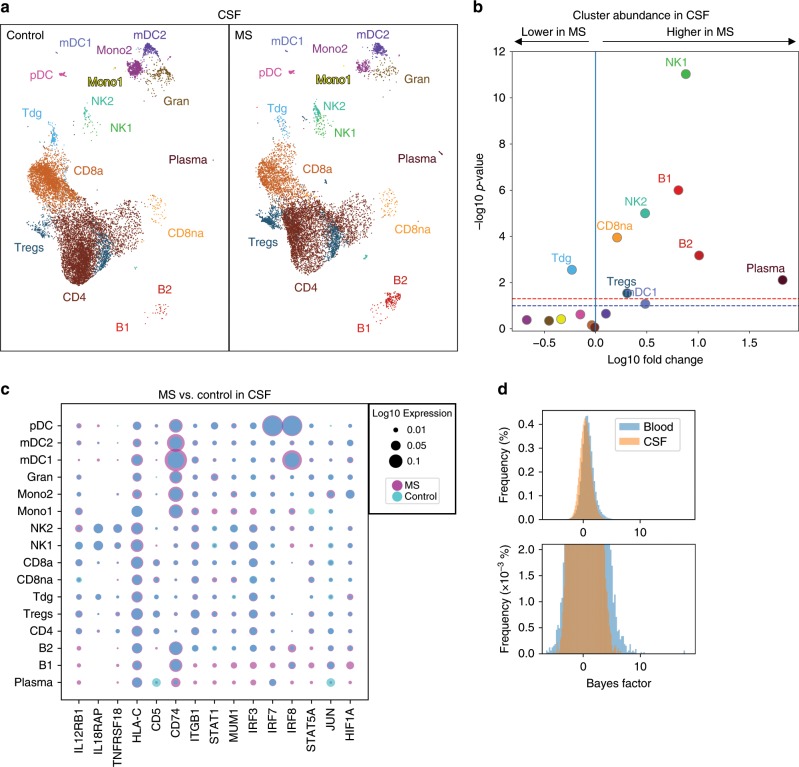
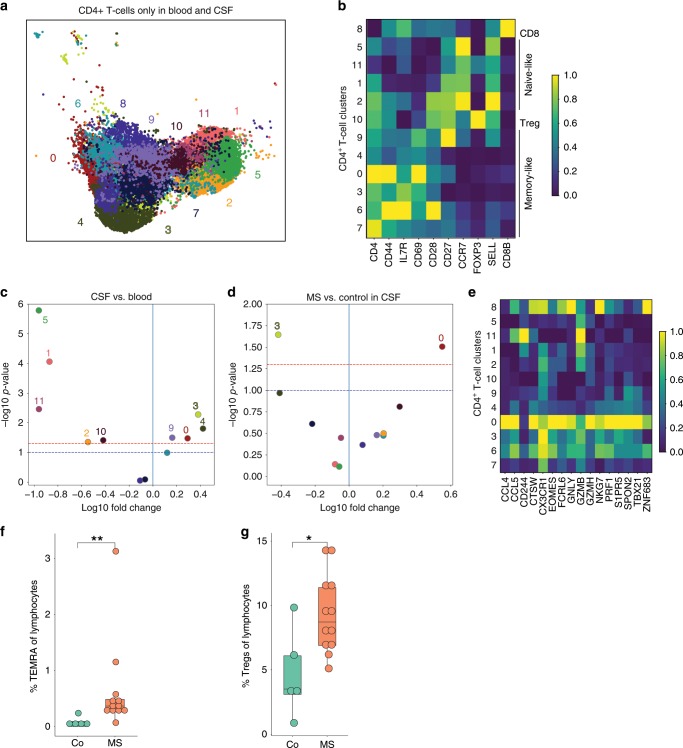
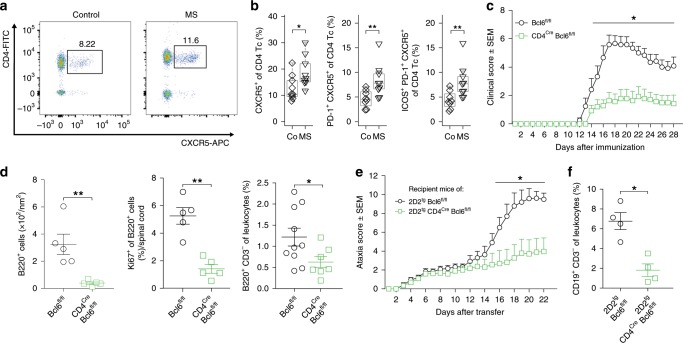
Cerebrospinal fluid (CSF) protects the central nervous system (CNS) and analyzing CSF aids the diagnosis of CNS diseases, but our understanding of CSF leukocytes remains superficial. Here, using single cell transcriptomics, we identify a specific location-associated composition and transcriptome of CSF leukocytes. Multiple sclerosis (MS) - an autoimmune disease of the CNS - increases transcriptional diversity in blood, but increases cell type diversity in CSF including a higher abundance of cytotoxic phenotype T helper cells. An analytical approach, named cell set enrichment analysis (CSEA) identifies a cluster-independent increase of follicular (TFH) cells potentially driving the known expansion of B lineage cells in the CSF in MS. In mice, TFH cells accordingly promote B cell infiltration into the CNS and the severity of MS animal models. Immune mechanisms in MS are thus highly compartmentalized and indicate ongoing local T/B cell interaction.


Conflict of interest statement

The authors declare no competing interests.

Figures

Fig. 1
Fig. 1. Single-cell transcriptomics reconstructs the compartment-specific leukocyte composition of CSF and blood.
a Schematic of the study design (Methods). b Uniform Manifold Approximation and Projection (UMAP) plot representing 17 color-coded cell clusters identified in merged single-cell transcriptomes of blood (42,969) and CSF (22,357) cells from control (n = 4) and multiple sclerosis (MS; n = 4) patients (Methods). Cluster names were manually assigned. c Dotplot depicting selected marker genes in cell clusters. Dot size encodes percentage of cells expressing the gene, color encodes the average per cell gene expression level. d UMAP plots comparing blood (left) and CSF (right) cell clustering. Please note that the MegaK cluster is disregarded for higher resolution. e Volcano plot depicting differences of cluster abundance in CSF compared to blood plotting fold change (log10) against p value (−log10) based on beta-binomial regression (Methods). Horizontal line indicates significance threshold. Cluster key: pDC, plasmacytoid dendritic cells (DC); mDC1, myeloid DC type 1; Mono1, monocyte cluster 1 preferentially blood-derived; Mono2, monocyte cluster 2 preferentially CSF-derived; gran, granulocytes; Tdg, γδ T cells; CD8na, non-activated CD8+ T cells; CD8a, activated CD8+ T cells; Tregs, regulatory CD4+ T cells; CD4, CD4+ T cells; NK, natural killer cells; MegaK, megakaryocytes; B1/B2, B cell subsets; plasma, plasmablasts. Source data for (c) listing the differential expression values for all cells merged are provided in Supplementary Dataset 1. Source data for (d, e) listing the differential expression values for CSF vs. blood are provided in Supplementary Dataset 2.
Fig. 2
Fig. 2. MS predominantly alters CSF cell composition and blood cell transcription.
a Comparative UMAP plots depicting only CSF cells from control (12,705 cells, left plot) and MS (9652 cells, right plot) donors. Color coding and cluster names are as in Fig. 1. b Volcano plot showing differences of cluster abundance of only CSF cells in MS samples compared to controls plotted as fold change (log10) against p value (−log10) based on beta-binomial regression. c Dotplot depicting selected genes differentially expressed in at least one cluster of MS cells compared to controls in CSF. Dot size encodes percentage of cells expressing the gene. Purple indicates higher, and turquoise indicates lower expression in MS, respectively. d Bayes factor (BF) frequency histogram in all cluster-specific case-control differential expression analyses colored by tissue. Higher magnification in bottom panel. Only clusters with a minimum of ten cells per tissue per disease state are included. Please note that the BF is proportional to the likelihood of differential expression (i.e., higher BF indicates more likely DE). Source data for (b, c) listing the differential expression values for MS vs. controls in CSF are provided in Supplementary Dataset 5. Source data for (d) listing the BFs for CSF vs. blood are provided in Supplementary Dataset 2.
Fig. 3
Fig. 3. Cytotoxic-like population of CD4+ T cells is induced in the CSF in MS.
a UMAP plot showing sub-clustering of all CD4+ T cells combined from blood (13,933 cells) and CSF (11,172 cells). Sub-clusters are numbered 0–11. b Heatmap depicting per cluster average expression of selected T cell subset marker genes. Expression values were normalized per gene with 0 reflecting the lowest expression and 1 reflecting the highest expression. c Volcano plot showing differences of CD4+ T cell cluster abundance in CSF compared to blood as fold change (log10) against p value (−log10) based on Student’s t-test. d Volcano plot showing differences of CD4+ T cell cluster abundance in MS compared to control within CSF based on Student’s t-test. e Heatmap showing average gene expression of selected cytotoxicity markers derived from. Expression values were normalized per gene with 0 reflecting the lowest expression and 1 reflecting the highest expression. f The proportion of TEMRA cells (CD45RA+CD27) among live lymphocytes in the CSF of control (co; n = 5) and MS (n = 12) patients was quantified by flow cytometry. g The proportion of Treg cells (CD25highCD127low) among live lymphocytes in the CSF of donors as in f was quantified by flow cytometry. Mann–Whitney U test, *p < 0.05, **p < 0.01. The lower and upper edges of the box plots represent the lower and the upper quartile, respectively, the horizontal line inside the box indicates the median, and the whiskers extend to the most extreme values within the 1.5 interquartile range of the lower/upper quartile. Source data for (b, e) listing the differential expression values for all CD4+ T cells are provided in Supplementary Dataset 6. Source data for (f, g) listing the TEMRA and TREGS frequencies are provided in the Source Data file.
Fig. 4
Fig. 4. TFH cells expand in the CSF in MS and promote MS animal models.
a Representative flow cytometry dotplot of CSF cells from a control and MS patient after gating on live CD3+ cells. Gating and sorting strategy is depicted in Supplementary Fig. 10a. b Proportion of CXCR5+ (left), of PD-1+CXCR5+ (middle), and of ICOS+PD-1+CXCR5+ (right) cells among live CD3+CD4+ T cells in CSF of control (co; n = 9) and MS (n = 9) patients quantified by flow cytometry. c Active EAE was induced in Bcl6fl/fl (wildtype, circles, n = 6) and CD4CreBcl6fl/fl (squares, n = 7) mice using MOG35-55 peptide (Methods). Mice were monitored daily for clinical EAE signs. One representative of three independent experiments is shown. d At day 28 after EAE induction, the density of B220+ leukocytes was quantified in spinal cord paraffin cross sections by histology (left). The proportion of Ki67+ among B220+ cells was quantified (middle). The proportion of CD3B220+ cells was quantified by flow cytometry at peak of EAE (right). Gating strategy is depicted in Supplementary Fig. 16a. e Naive CD4 + T cells were sorted from Bcl6fl/fl2D2tg mice (wildtype, circles, n = 6) and CD4CreBcl6fl/fl2D2tg mice (squares, n = 8), differentiated in vitro (Methods), and intravenously injected into wild-type recipient mice at 5 × 106 cells per mouse. Recipients were monitored for signs of EAE. One representative out of five independent experiments is shown. f At day 28 after transfer, the proportion of CD3CD19+ leukocytes in brain and spinal cord was quantified by flow cytometry. Gating strategy is depicted in Supplementary Fig. 16b. Mann–Whitney U test, *p < 0.05, **p < 0.01, ***p < 0.005. The lower and upper edges of the box plots represent the lower and the upper quartile, respectively, the horizontal line inside the box indicates the median, and the whiskers extend to the most extreme values within the 1.5 interquartile range of the lower/upper quartile. cf show mean ± s.e.m., source data listing the flow cytometry results and the clinical scores are provided in the Source Data file.

References

    1. Iliff JJ, et al. A paravascular pathway facilitates CSF flow through the brain parenchyma and the clearance of interstitial solutes, including amyloid beta. Sci. Transl. Med. 2012;4:147ra111. doi: 10.1126/scitranslmed.3003748. - DOI - PMC - PubMed
    1. Schlager C, et al. Effector T-cell trafficking between the leptomeninges and the cerebrospinal fluid. Nature. 2016;530:349–353. doi: 10.1038/nature16939. - DOI - PubMed
    1. Engelhardt B, et al. Vascular, glial, and lymphatic immune gateways of the central nervous system. Acta Neuropathol. 2016;132:317–338. doi: 10.1007/s00401-016-1606-5. - DOI - PMC - PubMed
    1. Han S, et al. Comprehensive immunophenotyping of cerebrospinal fluid cells in patients with neuroimmunological diseases. J. Immunol. 2014;192:2551–2563. doi: 10.4049/jimmunol.1302884. - DOI - PMC - PubMed
    1. Ransohoff RM, Engelhardt B. The anatomical and cellular basis of immune surveillance in the central nervous system. Nat. Rev. Immunol. 2012;12:623–635. doi: 10.1038/nri3265. - DOI - PubMed

Publication types

MeSH terms