. 2020 Jan 14;10(1):229.
doi: 10.1038/s41598-019-57110-6.

Single-cell transcriptional profiles in human skeletal muscle

Affiliations

Single-cell transcriptional profiles in human skeletal muscle

Aliza B Rubenstein et al. Sci Rep. .

Abstract

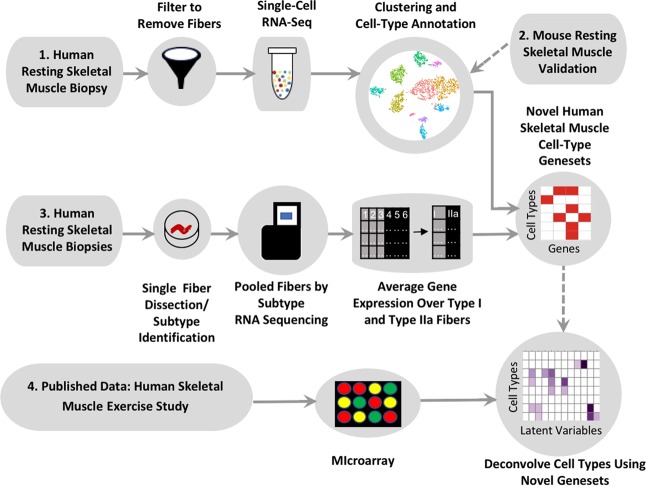
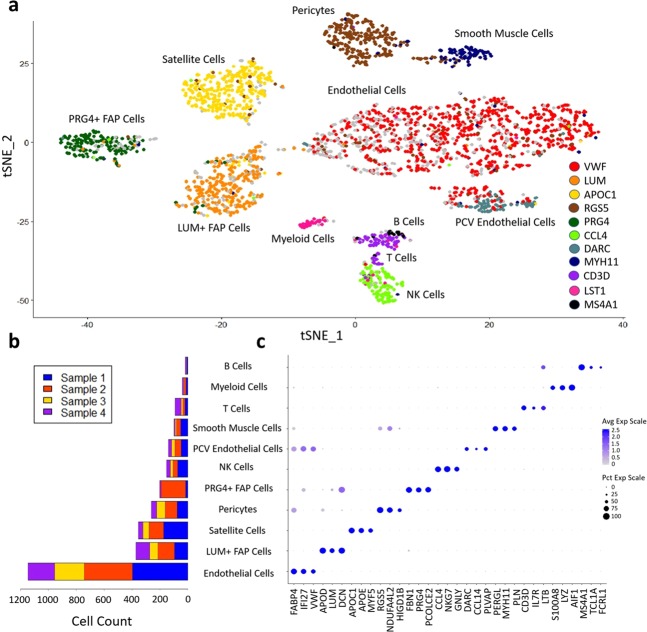
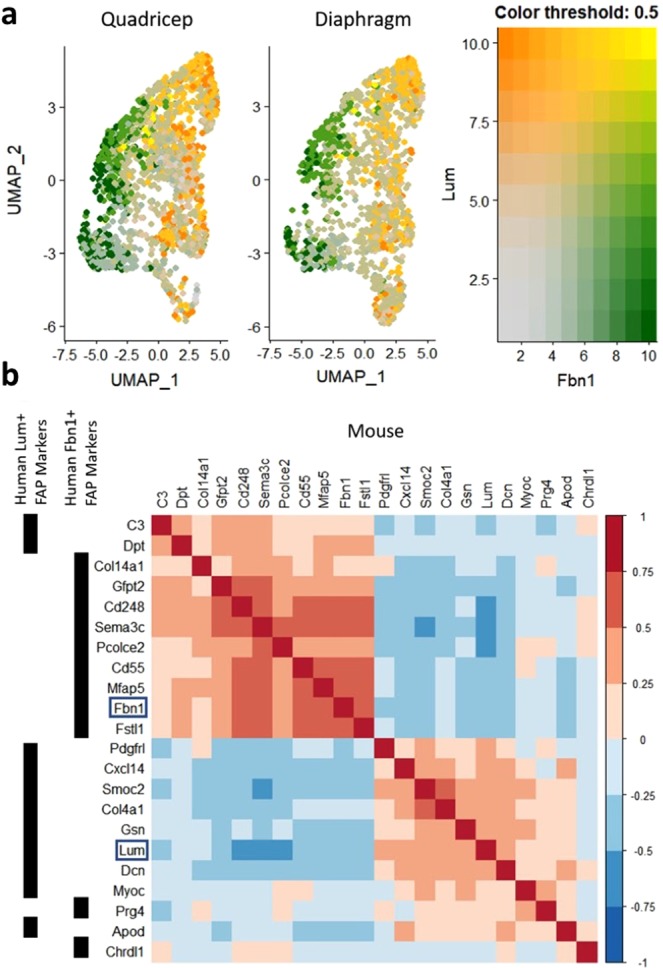
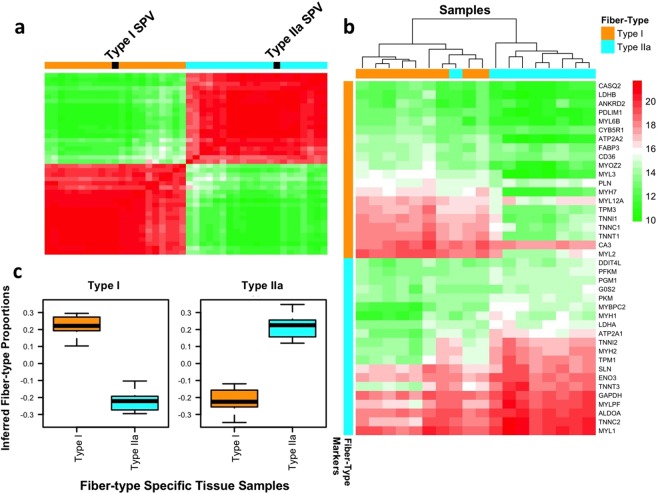
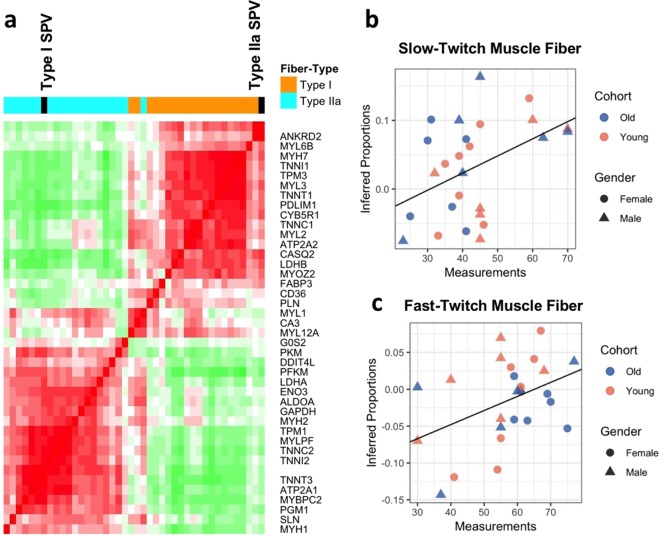
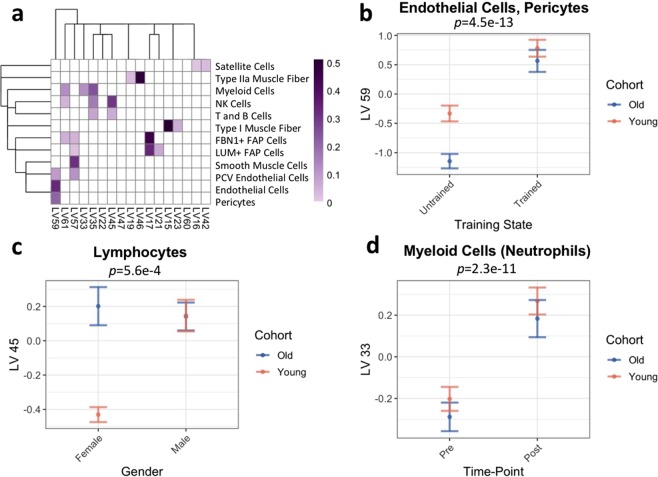
Skeletal muscle is a heterogeneous tissue comprised of muscle fiber and mononuclear cell types that, in addition to movement, influences immunity, metabolism and cognition. We investigated the gene expression patterns of skeletal muscle cells using RNA-seq of subtype-pooled single human muscle fibers and single cell RNA-seq of mononuclear cells from human vastus lateralis, mouse quadriceps, and mouse diaphragm. We identified 11 human skeletal muscle mononuclear cell types, including two fibro-adipogenic progenitor (FAP) cell subtypes. The human FBN1+ FAP cell subtype is novel and a corresponding FBN1+ FAP cell type was also found in single cell RNA-seq analysis in mouse. Transcriptome exercise studies using bulk tissue analysis do not resolve changes in individual cell-type proportion or gene expression. The cell-type gene signatures provide the means to use computational methods to identify cell-type level changes in bulk studies. As an example, we analyzed public transcriptome data from an exercise training study and revealed significant changes in specific mononuclear cell-type proportions related to age, sex, acute exercise and training. Our single-cell expression map of skeletal muscle cell types will further the understanding of the diverse effects of exercise and the pathophysiology of muscle disease.


Conflict of interest statement

The authors declare no competing interests.

Figures

Figure 1
Figure 1
Schematic showing workflow of gene signature determination and skeletal muscle tissue deconvolution. Top (1): a skeletal muscle biopsy from the vastus lateralis obtained from a young healthy male was prepared by dissociation and filtering of skeletal muscle fibers. The cells were subjected to scRNA-seq using 10X Chromium. Normalization and clustering was performed by Seurat and clusters were manually identified as cell types. Top right (2): Confirmation of selected human skeletal muscle scRNA-seq cell types by mouse skeletal muscle scRNA-seq assay. Middle (3): skeletal muscle biopsies from the vastus lateralis of nine old healthy males were each used to isolate 96 individual muscle fibers. A small portion of each muscle fiber was clipped and subjected to SDS-PAGE to determine the MHC isoform. For each subject, all Type I fibers were pooled and all Type IIa fibers were pooled, for a total of 18 fiber-type specific samples which were then subjected to RNA-seq. After quality control and normalization, gene expression was averaged over all Type I samples and all Type IIa samples separately to obtain fiber-type specific gene signatures. Bottom (4): a previously published dataset, consisting of microarray profiling of skeletal muscle biopsies from the vastus lateralis of 28 healthy young and old males and females was deconvolved using the previously determined mononuclear and multinucleated cell-type gene signatures. Biopsies were obtained before and 4 h after an acute resistance exercise bout at the onset and end of 12 weeks of resistance training (3 d/wk).
Figure 2
Figure 2
Single-cell RNA-seq cell-type analysis of human mononuclear muscle cells. (a) Cell-type labeled t-SNE plot of mononuclear cells from a combined set of four samples of a muscle biopsy. Cells are colored by their expression of top cell-type differentiating markers. Gray cells do not express any top cell-type differentiating markers, which may be due to transcript drop-out. (b) Bar graph of cell-type composition for each of the four muscle samples highlighting the heterogeneity of muscle cell-type composition. (c) Dot plot of gene expression of three top cell-type differentiating markers. Dot color reflects average gene expression and dot size represents percent of cells expressing the gene.
Figure 3
Figure 3
Human mononuclear muscle cell-type clustering analysis. (a) Heatmap and dendrogram of mononuclear cell types in muscle, clustered by their expression of top cell-type differentiating marker genes. (b) Box plot of cell-cell pearson correlation coefficients for each cell type. Higher values for a given cell type suggest greater homogeneity of gene expression between the cells of that cell type.
Figure 4
Figure 4
Single-cell RNA-seq cell-type analysis of mouse mononuclear muscle cells. (a) UMAP plot of FAP cells isolated from quadriceps and diaphragm, colored by their expression of FBN1 (green) and LUM (orange). (b) Correlation plot of the gene expression for 11 top markers for each human FAP cell subtype (FBN1+ and LUM+) over the mouse samples. Genes are arranged via hierarchical clustering with their human FAP subtype marker assignment labeled by the black bars on the left of the figure. The location of FBN1 and LUM are emphasized by boxes.
Figure 5
Figure 5
Fiber-type gene signatures and fiber-type specific tissue deconvolution. (a) Heatmap of gene expression for twenty markers per fiber-type over eighteen fiber-type specific tissue samples. Heatmap values are regularized-log transformed gene expression values. (b) Correlation heatmap for twenty gene markers per fiber-type. Estimated cell-type proportions (SPVs) for each fiber-type delineated in black; SPVs correlate with gene markers for each fiber-type. (c) Box plots showing estimated proportions of Type I fibers (left plot) and Type IIa fibers (right plot) within Type I specific tissue samples (orange boxes) and Type IIa specific tissue samples (blue boxes).
Figure 6
Figure 6
Fiber-type deconvolution of microarray dataset. (a) Correlation heatmap of twenty marker genes for each fiber-types. Estimated cell-type proportions (SPVs) for each fiber-type delineated in black; SPVs correlate with gene markers for each fiber-type. (b,c) Correlation of estimated Type I and Type IIa fiber-type proportions with biochemically measured slow-twitch and fast-twitch fiber-type proportions, respectively (slow-twitch: p = 0.02, fast-twitch: p = 0.03).
Figure 7
Figure 7
PLIER deconvolution of all skeletal muscle cell types. (a) Heatmap of association of cell types with LVs. The heatmap scale is arbitrary and should only be used to compare one association with another. (b) Difference in LV59 (endothelial cells/pericytes) between trained and untrained subjects. Points represent means of all trained and all untrained samples and error bars represent standard error. Both cohorts are depicted (orange for young and blue for old). (four-way ANOVA p = 4.5e–13) (c) Difference in LV45 (lymphocytes) between male and female subjects (four-way ANOVA p = 0.00056). Points represent means of all male and all female subjects and error bars represent standard error. Both cohorts are depicted (orange for young and blue for old). (d) Difference in LV33 (myeloid cells [neutrophils]) between pre- and post-acute exercise bout (four-way ANOVA p = 2.3e−11). Points represent means of all pre- and all 4 hour post-acute exercise samples and error bars represent standard error. Both cohorts are depicted (orange for young and blue for old).

References

    1. Bentzinger CF, Wang YX, Dumont NA, Rudnicki MA. Cellular dynamics in the muscle satellite cell niche. EMBO Rep. 2013;14:1062–1072. doi: 10.1038/embor.2013.182. - DOI - PMC - PubMed
    1. Saltin, B. & Gollnick, P. D. in Handbook of Physiology: Skeletal Muscle (eds. Peachy, L. D., Adnan, R. & Geiger, S. R.) 555–631 (1983).
    1. Bottinelli R, Pellegrino MA, Canepari M, Rossi R, Reggiani C. Specific contributions of various muscle fibre types to human muscle performance: an in vitro study. J. Electromyogr. Kinesiol. 1999;9:87–95. doi: 10.1016/S1050-6411(98)00040-6. - DOI - PubMed
    1. Trappe S, et al. Skeletal muscle signature of a champion sprint runner. J. Appl. Physiol. 2015;118:1460–1466. doi: 10.1152/japplphysiol.00037.2015. - DOI - PMC - PubMed
    1. Konopka AR, Trappe TA, Jemiolo B, Trappe SW, Harber MP. Myosin heavy chain plasticity in aging skeletal muscle with aerobic exercise training. J. Gerontol. A Biol. Sci. Med. Sci. 2011;66:835–841. doi: 10.1093/gerona/glr088. - DOI - PMC - PubMed

Publication types