. 2020 Jan;4(1):97-110.
doi: 10.1038/s41551-019-0501-5. Epub 2020 Jan 14.

Cytosine and adenine base editing of the brain, liver, retina, heart and skeletal muscle of mice via adeno-associated viruses

Affiliations

Cytosine and adenine base editing of the brain, liver, retina, heart and skeletal muscle of mice via adeno-associated viruses

Jonathan M Levy et al. Nat Biomed Eng. 2020 Jan.

Abstract

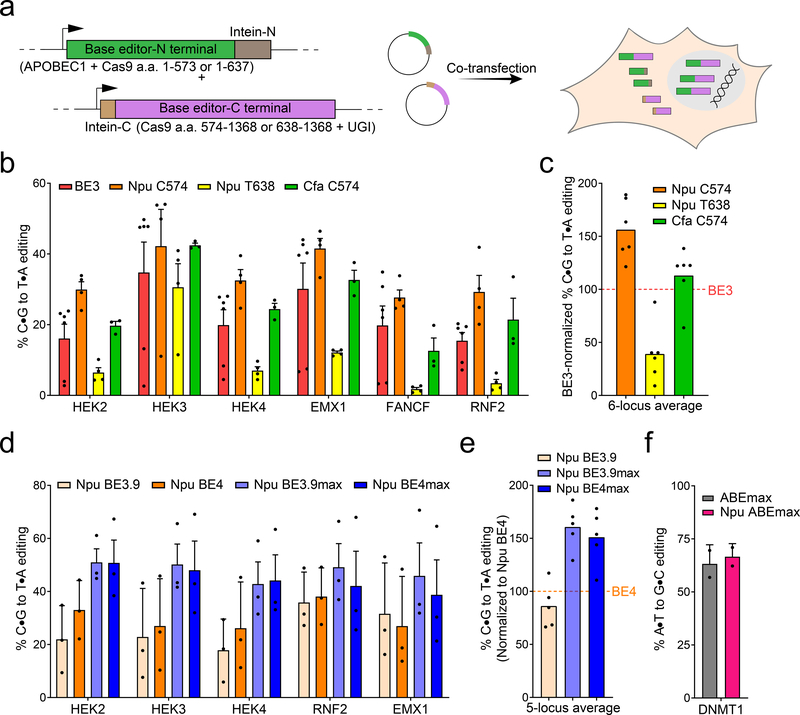
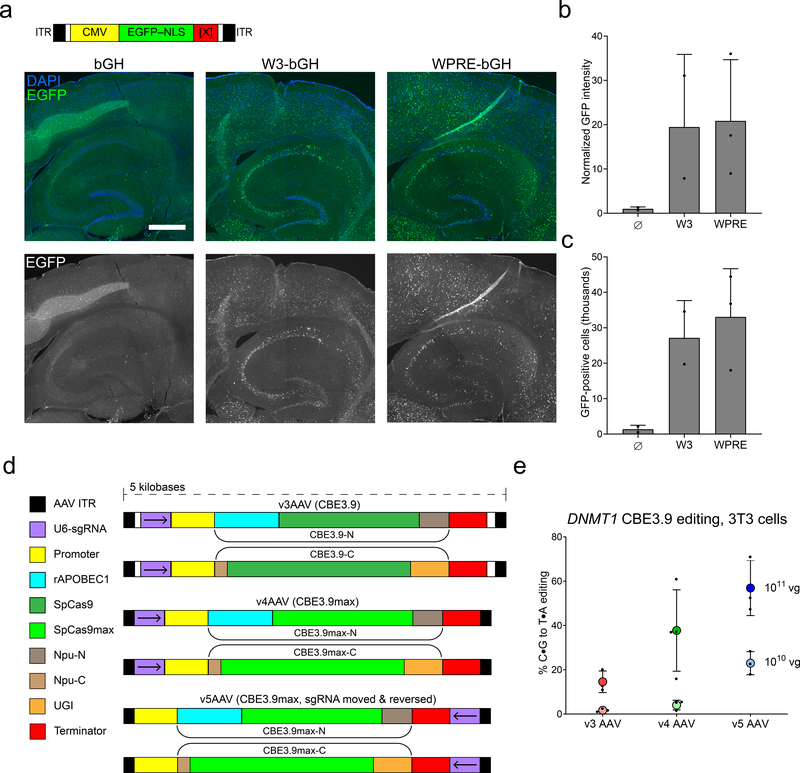
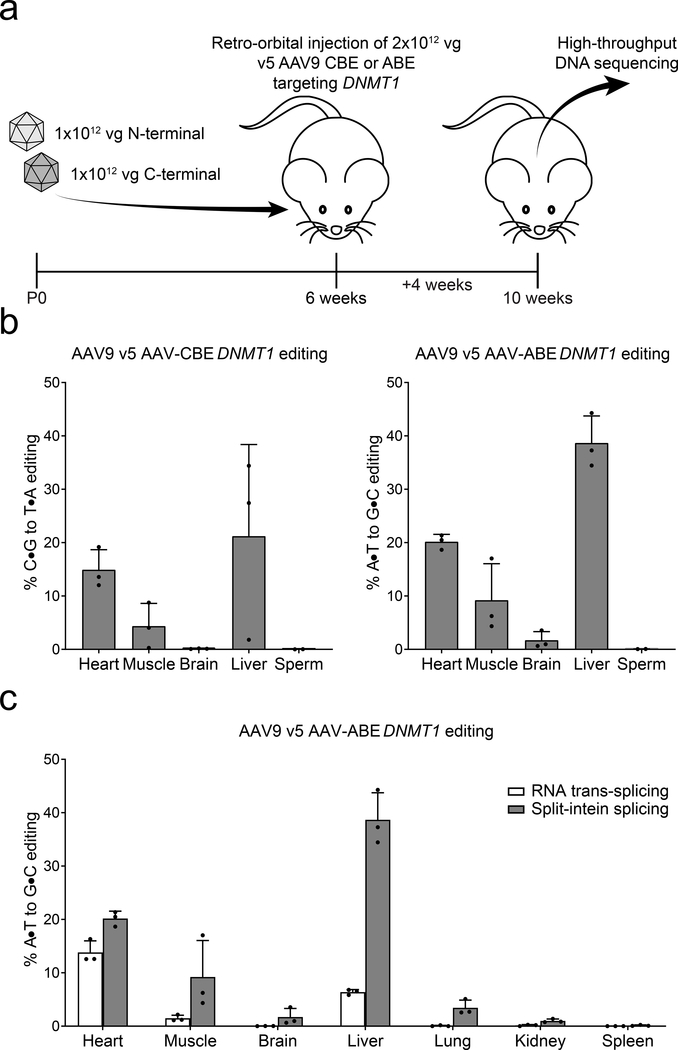
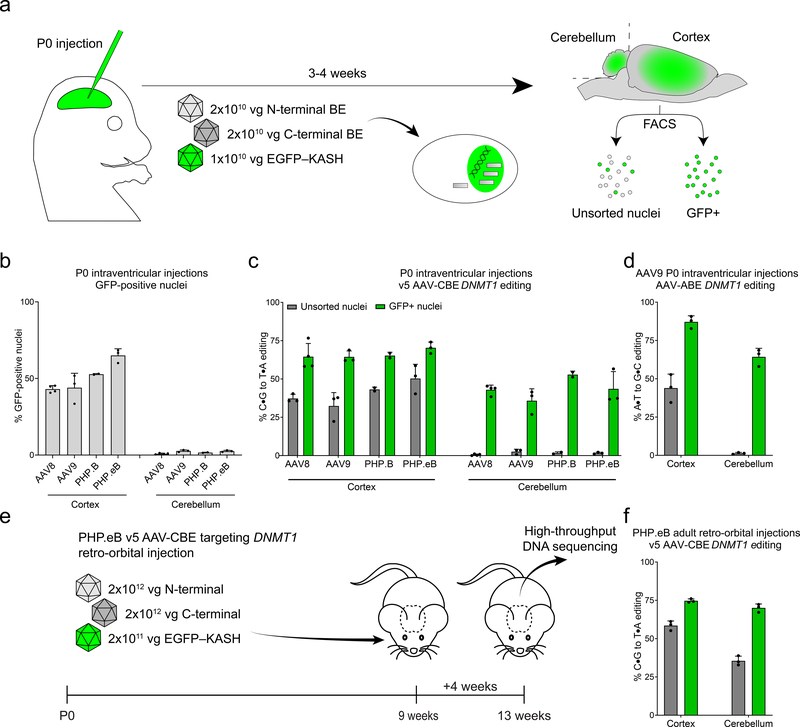
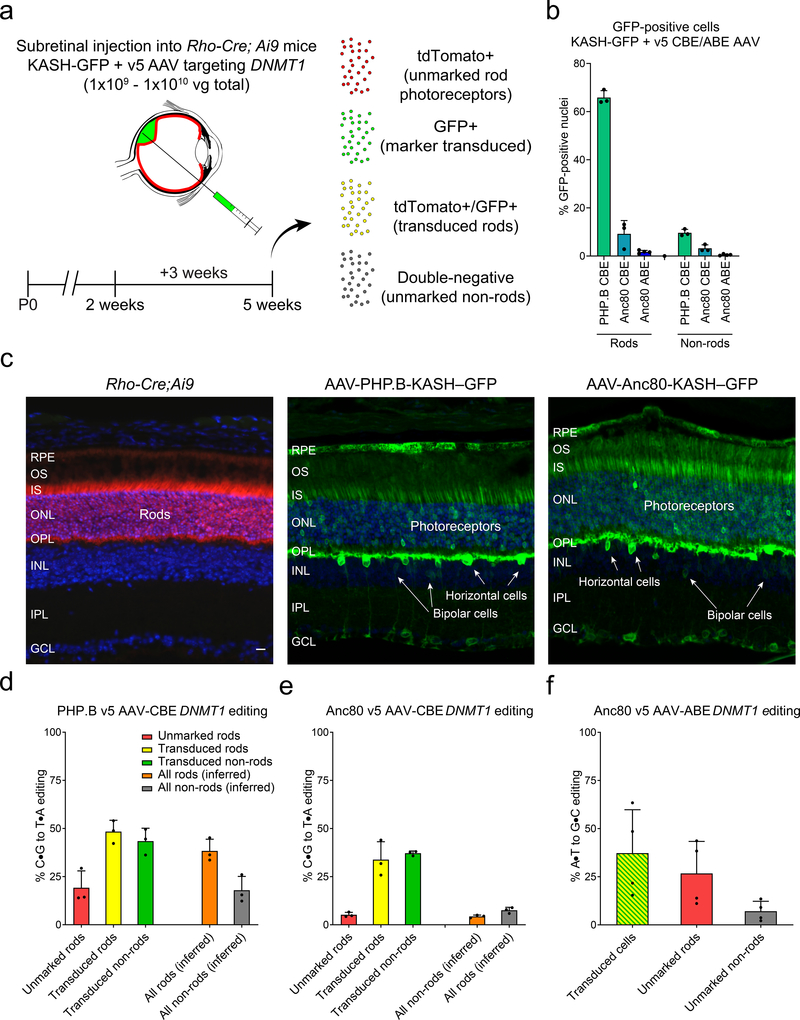
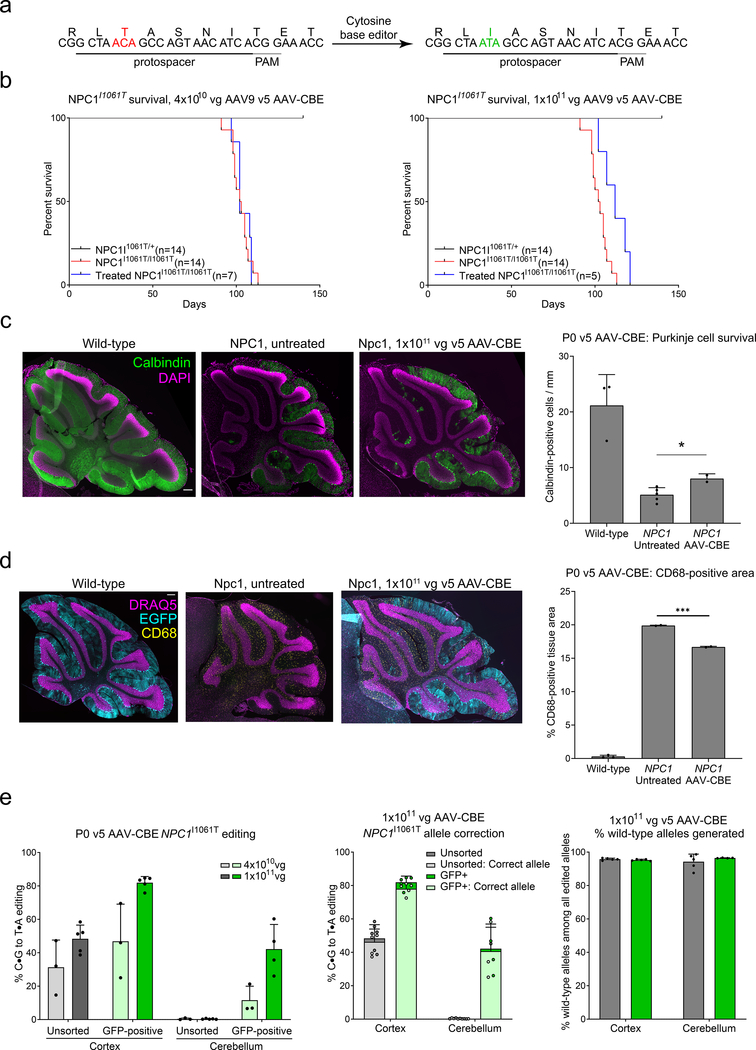
The success of base editors for the study and treatment of genetic diseases depends on the ability to deliver them in vivo to the relevant cell types. Delivery via adeno-associated viruses (AAVs) is limited by AAV packaging capacity, which precludes the use of full-length base editors. Here, we report the application of dual AAVs for the delivery of split cytosine and adenine base editors that are then reconstituted by trans-splicing inteins. Optimized dual AAVs enable in vivo base editing at therapeutically relevant efficiencies and dosages in the mouse brain (up to 59% of unsorted cortical tissue), liver (38%), retina (38%), heart (20%) and skeletal muscle (9%). We also show that base editing corrects, in mouse brain tissue, a mutation that causes Niemann-Pick disease type C (a neurodegenerative ataxia), slowing down neurodegeneration and increasing lifespan. The optimized delivery vectors should facilitate the efficient introduction of targeted point mutations into multiple tissues of therapeutic interest.


Conflict of interest statement

Competing interests

D.R.L. is a consultant and co-founder of Beam Therapeutics, Prime Medicine, Editas Medicine, and Pairwise Plants, companies that use genome editing. D.R.L., J.M.L., W-H. Y., and L.W.K. have filed patent applications on AAV systems for base editor delivery.

Figures

Fig. 1 |
Fig. 1 |. Development of split-intein cytosine and adenine base editors.
a, Intein reconstitution strategy. Two separately encoded protein fragments fused to split-intein halves splice to reconstitute full-length protein following co-expression. b, Lipofection of intact BE3 (red), split BE3 with the Npu split-intein site between E573/C574 (orange) or K637/T638 (yellow), or split BE3 with the Cfa split-intein site between E573/C574 (green) into HEK293T cells followed by high-throughput sequencing of six test loci to determine base editing efficiency. c, Comparison of average editing data in (b), normalized to BE3 levels (dotted line). BE3-normalized editing at each locus (black dots) was averaged. d, “BEmax” optimization of nuclear localization signals and codon usage increases editing efficiency at six standard loci. BE3.9max and BE4max show comparable editing efficiencies. e, Comparison of average editing data in (d), normalized to BE4 levels (dotted line). f, Lipofection of ABEmax (grey) or Npu-split E573/C574 ABEmax (magenta) into NIH 3T3 cells for generation of a split-intein adenosine base editor. In (b), (d), and (f), dots represent values and bars represent mean+SD of n=3 (b) and (d) or n=2 (f) independent biological replicates (see Methods for details). Dots in (c) and (e) represent locus averages.
Fig. 2 |
Fig. 2 |. Optimization of split-intein base editor AAVs.
a, GFP expression three weeks after injection of 1×10¹¹ vg of GFP–NLS-bGH (n=2 mice, 12 images), GFP–NLS-W3-bGH (n=3 mice, 18 images), or GFP–NLS-WPRE-bGH (n=2 mice, 18 images) into six-week-old C57BL/6 mice. Representative images of horizontal brain slices show hippocampus and neocortex. Top panels show DAPI and EGFP signals overlaid; bottom panels show EGFP signal only. The scale bar represents 500 μm. b, Transcriptional regulatory element optimization. Total GFP signal measured by ImageJ from mice described in (a). See methods for a detailed description of imaging and analysis procedures. c, Number of GFP-positive cells per horizontal brain slice from the mice described in (a). GFP-positive cells were identified by ilastik / CellProfiler as described in the image analysis section of the Methods. d, Schematic of v3, v4, and v5 AAV variants. Arrows indicate direction of U6 promoter transcription. The CBE3.9 coding sequence consists of rAPOBEC1 (teal), spCas9 D10A nickase (green), and UGI (tan). Small white boxes in v3 are non-essential backbone sequences removed in v4 and v5 AAV. See Supplementary Fig. 2 for the schematic of v5 AAV-ABEmax. e, Cytosine base editing efficiencies in NIH 3T3 cells seeded at 50,000 cells/well following a 14-day incubation with the indicated doses of v3 AAV, v4 AAV, and v5 AAV. Dots and bars in (b) and (c) represent individual replicates and mean+SD of n=2 (bGH and W3-bGH) or n=3 mice (WPRE). Colored circles and error bars in (e) represent mean±SD. Dots in (e) represent values for independent biological replicates (n=3–4).
Fig. 3 |
Fig. 3 |. Systemic injection of v5 AAV9 editors results in cytosine and adenine base editing in heart, muscle, and liver.
a, Six-week-old C57BL/6 mice were treated by retro-orbital injection of 2×10¹² vg total of v5 AAV9. After 4 weeks, organs were harvested and genomic DNA of unsorted cells was sequenced. b, Cytosine or adenine base editing by v5 AAV CBE3.9max or v5 AAV ABEmax, respectively, in the indicated organs. c, Comparison of adenine base editing from v5 AAV-mediated ABEmax (grey bars) and from trans-mRNA splicing (white bars). The trans-splicing constructs were modified to enable direct comparison by replacing the muscle-specific Spc5–12 promoter with the Cbh promoter for ubiquitous expression, and replacing the DMD-targeting sgRNA with the DNMT1-targeting sgRNA. Bars represent mean+SD of n=3 mice.
Fig. 4 |
Fig. 4 |. AAV-mediated cytosine and adenine base editing in the central nervous system by two delivery routes.
a, Schematic of P0 intraventricular injections. P0 C57BL/6 mice were co-injected with 4×10¹⁰ vg total of v5 CBE3.9max or ABEmax AAV targeting DNMT1 and 1×10¹⁰ vg Cbh-KASH–GFP. Sorting for GFP-positive cells enriches for triply transduced cells. Tissue was harvested 3–4 weeks after injection, and cortex and cerebellum were separated. Cortical tissue comprises neocortex and hippocampus. For each tissue, nuclei were dissociated and analyzed as unsorted (all nuclei) or GFP-positive populations for DNA sequencing. b, Percent GFP-positive nuclei measured by flow cytometry following P0 injection. c, Cytosine base editing efficiency following P0 v5 CBE3.9max AAV injection in cortex and cerebellum at DNMT1 for unsorted nuclei (grey) and GFP-positive nuclei (green) (For (b) and (c), AAV8, n=4; AAV9, n=3; PHPB, n=2; PHPeB; n=3). d, Adenosine base editing efficiency following P0 v5 CBE3.9max AAV9 injection in cortex and cerebellum at DNMT1 for unsorted nuclei (grey) and GFP-positive nuclei (green) (n=3). e, Schematic of retro-orbital injections. Brains from 9-week-old C57BL/6 mice were harvested 4 weeks after injection with 4×10¹² vg total v5 CBE3.9max or ABEmax AAV targeting DNMT1 and 2×10¹¹ vg KASH–GFP AAV, then processed and analyzed as described in Fig. 4. f, Cytosine base editing in unsorted (grey) and GFP-positive (green) cortical and cerebellar cells following the procedure described in (a) (n=3). In all cases, bars represent mean+SD. Black dots represent individual mice.
Fig. 5 |
Fig. 5 |. AAV-mediated cytosine and adenine base editing in the retina following sub-retinal injections of 2-week-old Rho-Cre;Ai9 mice.
a, Schematic of sub-retinal injections. Two-week-old Rho-Cre; Ai9 mice were treated by sub-retinal injection of 1×10⁹ to 1×10¹⁰ vg total of v5 CBE3.9max or v5 ABEmax AAV targeting DNMT1. Three weeks after injection, injected retinas were sorted into GFP-negative/tdTomato-positive (rod photoreceptors not transduced with GFP; red bars), tdTomato-positive/GFP-positive (transduced rods; yellow bars), GFP-positive/tdTomato-negative (marker transduced non-rods; green bars), and double-negative populations (unmarked non-rods, not shown). b, Percentage of GFP transduced rod photoreceptors or non-rod retinal cells followed by subretinal injection of AAV mix of PHP.B-CBE, Anc80-CBE and Anc80-ABE AAV, respectively. The dose of AAV-GFP is 2×10⁹ vg for PHP.B-CBE mix, 3.3×10⁸ vg for Anc80-CBE mix and 4.5×10⁸ vg for Anc80-ABE mix. c, Expression of tdTomato in the rod photoreceptor cells of Rho-Cre;Ai9 mice (left panel). Retinal transduction of PHP.B-GFP (middle panel) or Anc80-GFP (right panel) at 5×10⁹ vg. Scale bar = 20 μm. The images are representative of n=2 independent experiments. d, Cytosine base editing by v5 CBE3.9max PHP.B AAV in injected retinas. Retinas were injected with 6.5×10⁸ vg of each split-editor half. Editing percentage in all rods (orange bars) was inferred as ((editing % in GFP transduced rods)*(number of transduced rods) + (editing % in unmarked rods)*(number of unmarked rods)) / total rods. This calculation was repeated for non-rods (grey bars). e, Cytosine base editing by v5 CBE3.9max Anc80 AAV in photoreceptors and other retinal cells. Retinas were injected with 4×10⁹ vg of each split-editor half. Editing efficiencies in all rods (orange bars) and all non-rods (grey bars) were inferred as described for (b). f, Adenine base editing by v5 ABEmax Anc80 AAV in photoreceptors. Retinas were injected with 4.5×10⁸ vg of each split-editor half. All GFP-positive cells were pooled in this experiment, resulting in a single GFP-positive population containing tdTomato-positive and tdTomato-negative cells (yellow/green bar).. Black dots represent individual eyes. For (b) and (d) - (f), bars represent mean+SD of independent injections (PHP.B-CBE, n=3; Anc80-CBE, n=3; Anc80-ABE, n=4).
Fig. 6 |
Fig. 6 |. Base editing of Npc1I1061T in the mouse CNS.
a, Schematic of the Npc1 locus highlighting the mutation in exon 21, the protospacer and PAM sequence targeted, and the desired CBE-mediated reversion of I1061T. The scale bar represents 5 kilobases. b, Kaplan-Meier plots of untreated homozygous Npc1I1061T mice (red; n=14), Npc1I1061T heterozygous mice (black; n=14), and mice injected with either 4×10¹⁰ vg total of v5 CBE3.9max AAV9 targeting NPC1I1061T (left plot, blue; n=7), or with 1×10¹¹ vg total v5 CBE3.9max AAV9 targeting Npc1I1061T (right plot, blue; n=5). Following 1×10¹¹ vg injection, the median survival increases from 102.5 to 112 days, p=0.02 by Mantel-Cox test. c, Immunofluorescent measurement of Purkinje cell survival. Images are representative Calbindin-stained midline sagittal cerebellar slices from P98-P105 mice. Surviving calbindin-positive cells appear in green, and DAPI is pseudocolored magenta. In the quantification of imaging data, each point represents the average number of Purkinje cells per slice for each mouse. Wild-type, n=3 mice, 9 images; Npc1I1061T untreated, n=5 mice, 20 images; Npc1I1061T AAV-CBE, n=2 mice, 16 images. Untreated vs. treated, two-sided t-test, p= 0.0327. d, Immunofluorescent measurement of CD68+ tissue area. Images are representative CD68-stained midline saggital cerebellar slices from P98-P105 mice. EGFP–KASH labeled cells appear in cyan, CD68+ cells appear in yellow, and DRAQ5 signal is pseudocolored magenta. The untreated mice are uninjected and do not express GFP. In the quantification of CD68+ tissue area, each point represents the average per mouse. Wild-type, n=3 mice, 15 images; Npc1I1061T untreated, n=2 mice, 6 images; Npc1I1061T AAV-CBE, n=2 mice, 10 images. Untreated vs. treated, two-sided t-test, p=0.0005. e, Cortical and cerebellar base editing in P0 mice injected with v5 AAV9 targeting Npc1I1061T. In the left subpanel, lighter bars report editing in unsorted (grey) or GFP-positive (green) cells following injection of n=3 mice with 4×10¹⁰ vg (2×10¹⁰ vg of each split base editor half); darker bars correspond to editing following injection of n=5 mice with 1×10¹¹ vg (5×10¹⁰ vg of each split base editor half). The middle subpanel reports base editing to the precisely corrected wild-type allele shown in (a) from the 1×10¹¹ vg injections. Lighter bars indicate the frequency of alleles that are corrected to the wild-type sequence; replotted darker bars indicate total C•G-to-T•A editing of the T1061 codon colored red in (a). The right subpanel shows precisely corrected (wild-type) alleles as a percentage of all edited alleles in mice injected with 1×10¹¹ vg. In (b), tick marks indicate animal deaths. In all other panels, bars represent mean+SD. Dots represent individual mice. Scale bars represent 200 μm. Statistical tests for immunofluorescence are two-sided t-tests without multiple comparison corrections.

References

    1. Landrum MJ et al. ClinVar: public archive of relationships among sequence variation and human phenotype. Nucleic acids research 42, D980–985, doi:10.1093/nar/gkt1113 (2014). - DOI - PMC - PubMed
    1. Rees HA & Liu DR Base editing: precision chemistry on the genome and transcriptome of living cells. Nature reviews. Genetics 19, 770–788, doi:10.1038/s41576-018-0059-1 (2018). - DOI - PMC - PubMed
    1. Komor AC, Kim YB, Packer MS, Zuris JA & Liu DR Programmable editing of a target base in genomic DNA without double-stranded DNA cleavage. Nature 533, 420–424, doi:10.1038/nature17946 (2016). - DOI - PMC - PubMed
    1. Gaudelli NM et al. Programmable base editing of A*T to G*C in genomic DNA without DNA cleavage. Nature 551, 464–471, doi:10.1038/nature24644 (2017). - DOI - PMC - PubMed
    1. Komor AC et al. Improved base excision repair inhibition and bacteriophage Mu Gam protein yields C:G-to-T:A base editors with higher efficiency and product purity. Sci Adv 3, eaao4774, doi:10.1126/sciadv.aao4774 (2017). - DOI - PMC - PubMed

Publication types