. 2020 Jan 14;7(1):4.
doi: 10.1186/s40658-020-0271-x.

Comparison of NEMA characterizations for Discovery MI and Discovery MI-DR TOF PET/CT systems at different sites and with other commercial PET/CT systems

Affiliations

Comparison of NEMA characterizations for Discovery MI and Discovery MI-DR TOF PET/CT systems at different sites and with other commercial PET/CT systems

Alexandre Chicheportiche et al. EJNMMI Phys. .

Abstract

Background: This article compares the physical performance of the 4-ring digital Discovery MI (DMI) and PMT-based Discovery MI-DR (DMI-DR) PET/CT systems. Physical performance was assessed according to the NEMA NU 2-2012 standards. Performance measures included spatial resolution, image quality, scatter fraction and count rate performance, and sensitivity. Energy and timing resolutions were also measured. Published DMI and DMI-DR performance studies from other centers are reviewed and compared.

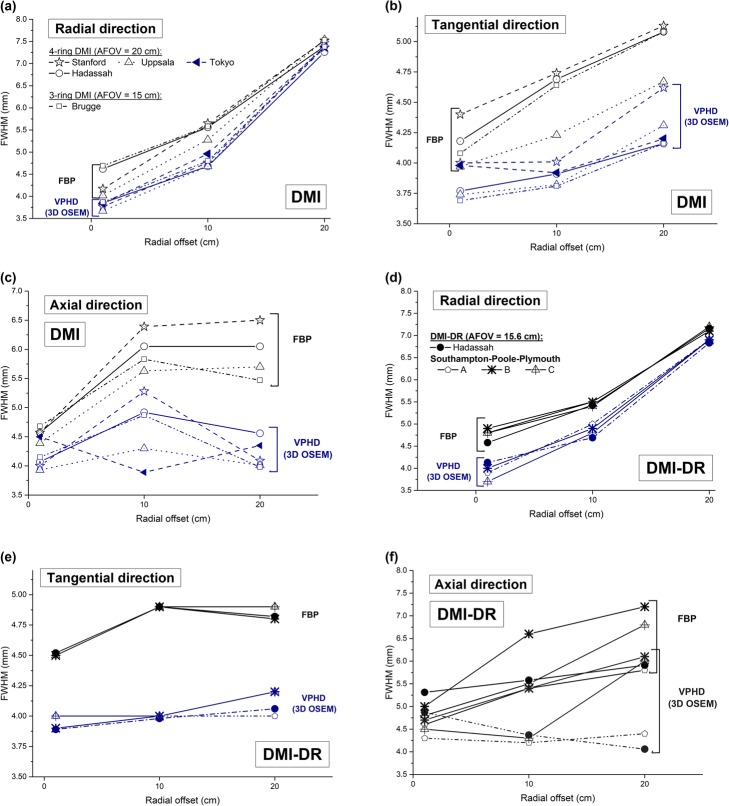
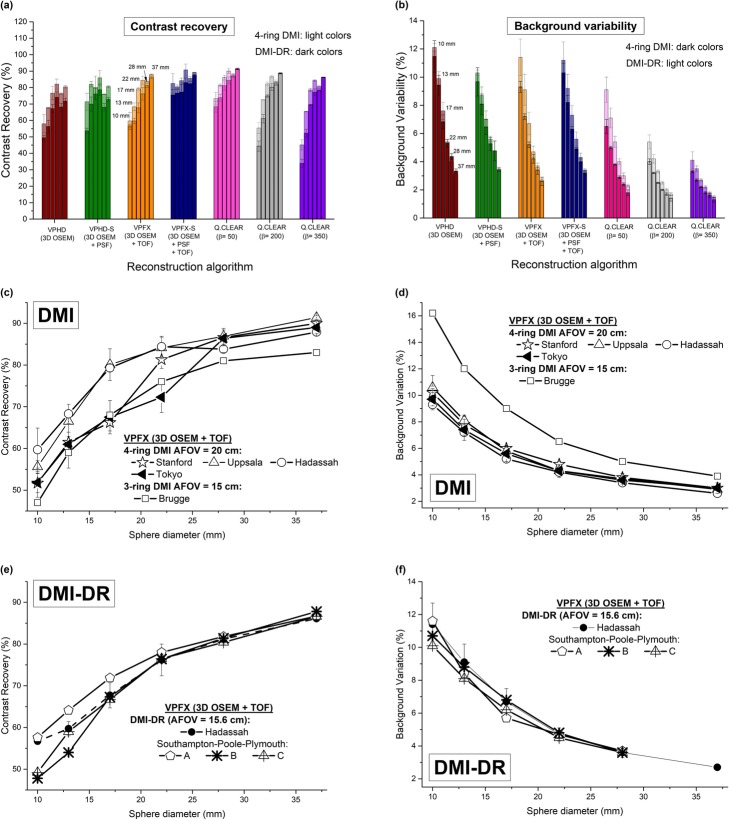
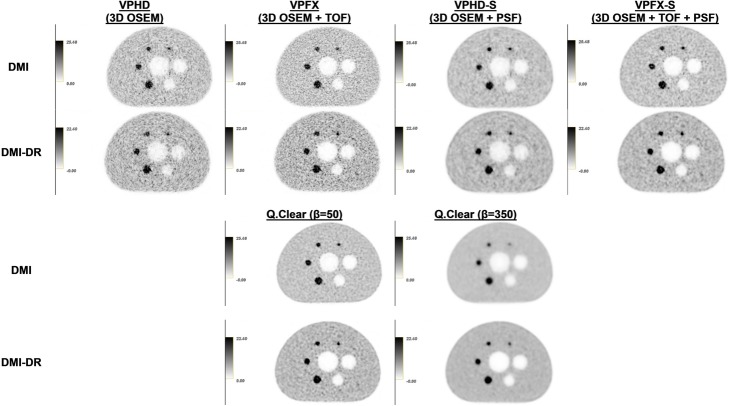
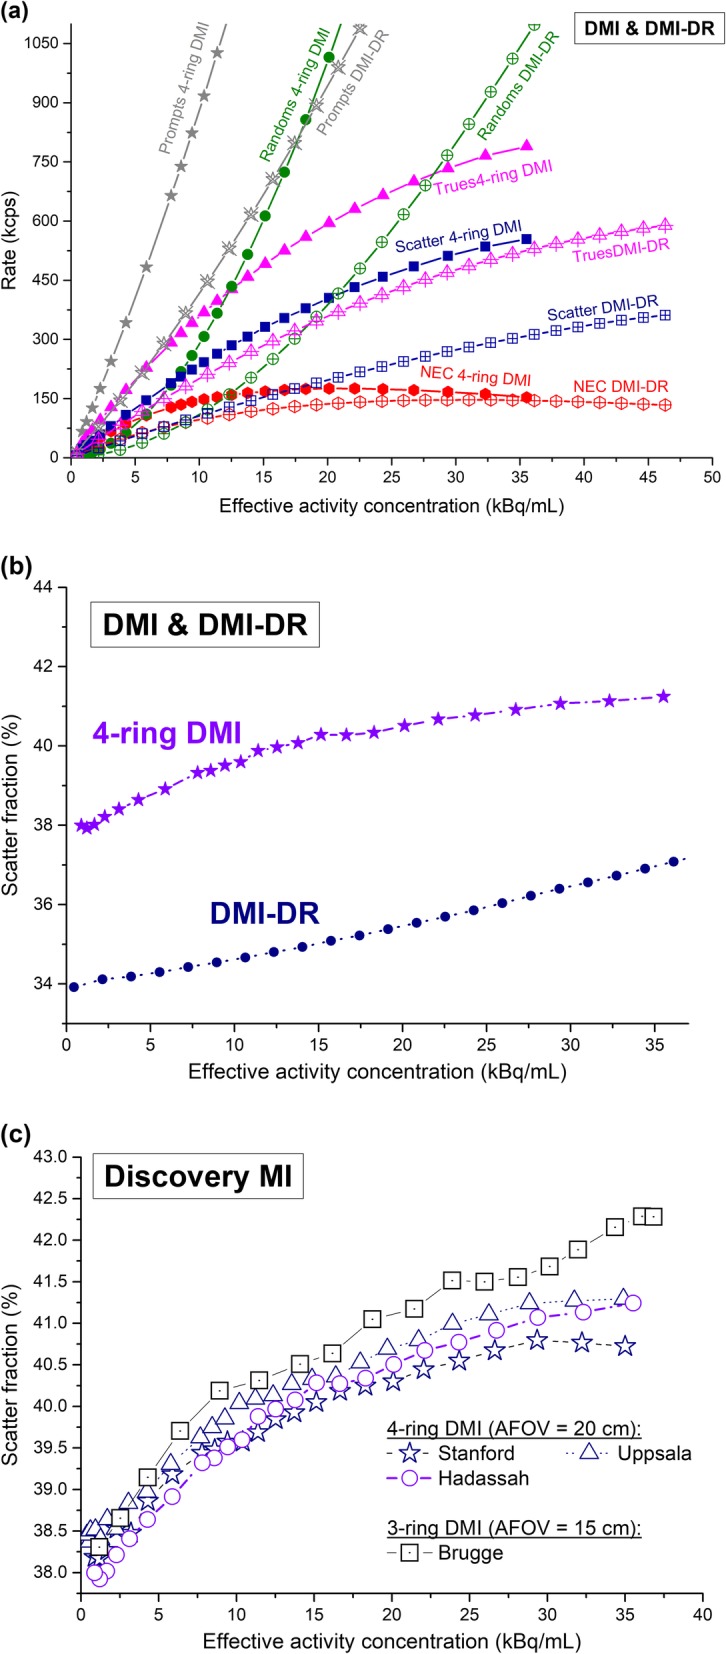
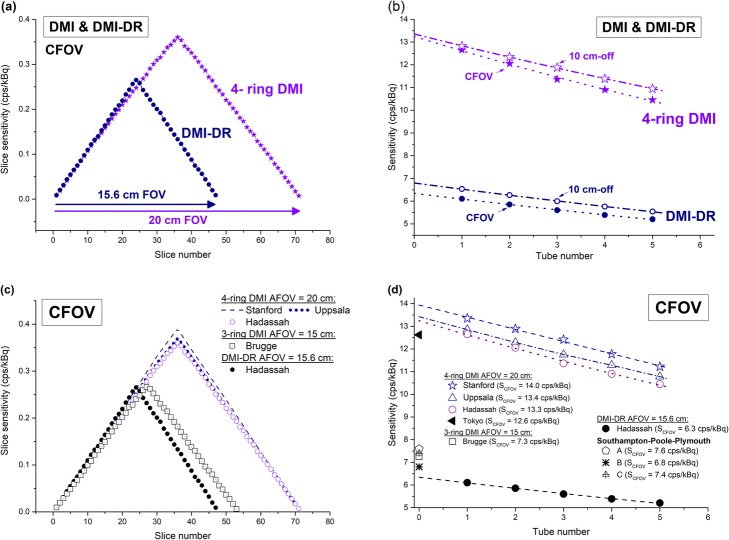
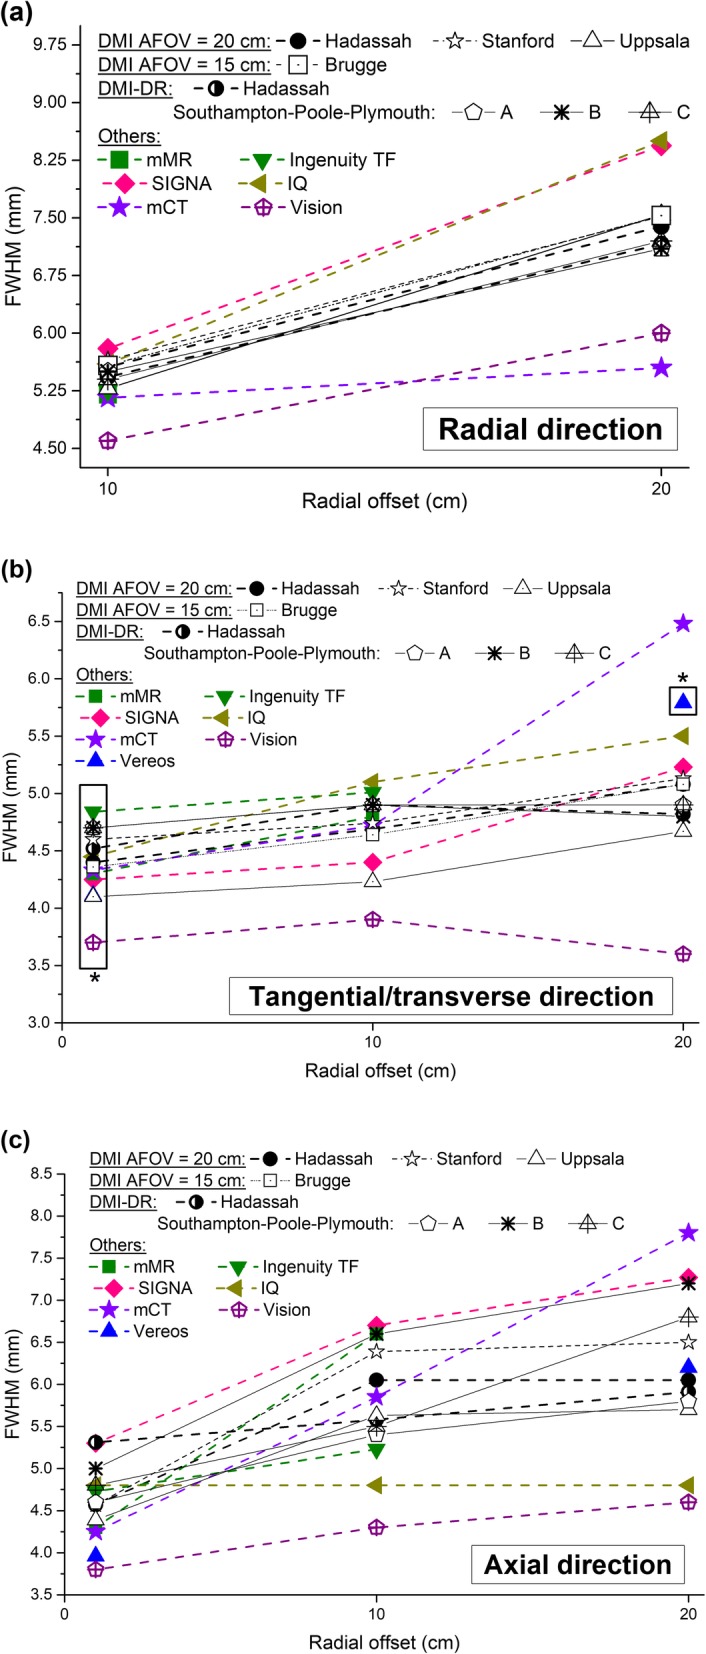
Results: 4-ring DMI spatial resolution at 1-cm radial offset in the radial, tangential and axial directions was 4.62, 4.18 and 4.57 mm, respectively, compared with the DMI-DR system values of 4.58, 4.52, and 5.31 mm. Measured sensitivity was 13.3 kcps/MBq at the center of the FOV and 13.4 kcps/MBq 10 cm off-center for the SiPM-based DMI system. DMI-DR system sensitivity was 6.3 kcps/MBq at the center of the FOV and 6.8 kcps/MBq at 10 cm off-center. DMI measured noise equivalent count rate peak was 175.6 kcps at 20.1 kBq/ml; DMI-DR was 146.7 kcps at 31.7 kBq/ml. Scatter fraction was 40.5% and 36.6%, respectively. DMI image contrast recovery (CR) values ranged from 73.2% (10 mm sphere) to 91.0% (37 mm sphere); DMI-DR, values ranged from 68.4% to 91.4%. DMI background variability (BV) was 1.8%-6.5%; DMI-DR was 2.3%-9.1%. The Q.Clear algorithm improved image quality, increasing CR and decreasing BV in both systems. The photopeak energy resolution was 9.63% and 12.19% for DMI and DMI-DR, respectively. The time-of-flight (TOF) resolution was 377.26 ps and 552.71 ps, respectively. Compared with measurements in other centers, results were similar and showed an absolute mean relative deviation of 6% for DMI and 7% for DMI-DR overall performance results.

Conclusions: Performance measures were higher for the 4-ring DMI than the DMI-DR system. The biggest advantages of the 4-ring DMI vs DMI-DR are improved sensitivity and count rate performance. This should allow a better image signal-to-noise ratio (SNR) for the same acquisition times or, similar SNR with lower acquisition times or injected activity. In its 3-ring configuration, the DMI showed worse performance results than the PMT-based system in terms of count rate scatter fraction and image quality (for similar axial FOV).

Keywords: Discovery MI; Discovery MI-DR; NEMA; PET/CT; Physical performance.


Conflict of interest statement

The authors declare that they have no conflict of interest.

.

Figures

Fig. 1
Fig. 1
Radial, tangential, and axial spatial resolutions in mm (FWHM) at 1, 10, and 20 cm radial offset obtained a Hadassah for the a-c DMI and d-f DMI-DR systems using FBP and VPHD (3D OSEM) reconstruction algorithms and compared with results obtained in other centers [–5]
Fig. 2
Fig. 2
a Contrast recovery (%) and b background variability (%) for Discovery MI, and Discovery MI-DR PET/CT systems using VPHD (3D OSEM), VPHD-S (3D OSEM + PSF), VPFX (3D OSEM + TOF), VPFX-S (3D OSEM + TOF + PSF) reconstruction algorithms and Q.Clear with β = 50, 200, and 350. Results obtained at Hadassah for VPFX reconstruction algorithms are compared to Stanford and Uppsala [2], Tokyo [3] and Brugge [4] measurements for DMI (c-d) and to Southampton-Poole-Plymouth [5] for DMI-DR (e-f)
Fig. 3
Fig. 3
Central slices of the NEMA IEC image quality body phantom acquired during the image quality tests for the Discovery MI and Discovery MI-DR PET/CT systems. Images were reconstructed with the VPHD (3D OSEM), VPFX (3D OSEM + TOF), VPHD-S (3D OSEM + PSF), VPFX-S (3D OSEM + TOF + PSF) reconstruction algorithms and with Q.Clear, with β = 50 and β = 350. The gray-scale next to each phantom image represents the activity concentration in kBq/mL
Fig. 4
Fig. 4
Count rate performance (prompts, NECR, true, random and scatter values) in kcps (a) and scatter fraction (b), versus the effective activity concentration in kBq/mL for the Discovery MI and Discovery MI-DR PET/CT systems at Hadassah. Comparison of the scatter fraction obtained at Hadassah, Stanford, and Uppsala [2] and Brugge [4] for the DMI system is presented in (c)
Fig. 5
Fig. 5
a Slice sensitivity profile at CFOV for DMI and DMI-DR. b Successive measurements of the count rate at CFOV and 10-cm radial offset using five aluminum sleeves and an extrapolation process to get the NEMA attenuation-free sensitivity in air. Comparison of the sensitivity results for the DMI and DMI-DR systems with results obtained in other centers [–5] is presented in figures (c) and (d)
Fig. 6
Fig. 6
Resolution in mm (FWHM) for DMI, DMI-DR, Siemens Biograph mCT Flow [17, 18], Philips Ingenuity TF [21], Philips Vereos [22, 23], GE Discovery IQ [24, 25], GE SIGNA [26], Siemens Biograph mMR [18, 19] and digital Biograph Vision [20] systems in the a radial, b tangential or transverse (box with star) and c axial directions
Fig. 7
Fig. 7
a Contrast recovery (%), b background variability (%), c peak NECR, peak trues, scatter fraction at NECR peak, and corresponding activity concentrations and d sensitivity at CFOV and 10-cm radial offset for DMI, DMI-DR, Siemens Biograph mCT Flow [17, 18], Philips Ingenuity TF [21], Philips Vereos [22, 23], GE Discovery IQ [24, 25], GE SIGNA [26], Siemens Biograph mMR [18, 19] and digital Biograph Vision [20]

References

    1. National Electrical Manufacturers Association . Performance measurements of positron emission tomographs (PET) Rosslyn, USA: NEMA Standards Publication NU 2-2012; 2012.
    1. Hsu David F.C., Ilan Ezgi, Peterson William T., Uribe Jorge, Lubberink Mark, Levin Craig S. Studies of a Next-Generation Silicon-Photomultiplier–Based Time-of-Flight PET/CT System. Journal of Nuclear Medicine. 2017;58(9):1511–1518. doi: 10.2967/jnumed.117.189514. - DOI - PubMed
    1. Wagatsuma K, Miwa K, Sakata M, Oda K, Ono H, Kameyama M, et al. Comparison between new-generation SiPM-based and conventional PMT-based TOF-PET/CT. Phys Med. 2017;42:203–210. doi: 10.1016/j.ejmp.2017.09.124. - DOI - PubMed
    1. Vandendriessche D, Uribe J, Bertin H, De Geeter F. Performance characteristics of silicon photomultiplier based 15-cm AFOV TOF PET/CT. EJNMMI Phys. 2019;6:8. doi: 10.1186/s40658-019-0244-0. - DOI - PMC - PubMed
    1. Michopoulou S, O’Shaughnessy E, Thomson K, Guy MJ. Discovery molecular imaging digital ready PET/CT performance evaluation according to the NEMA NU2-2012 standard. Nucl Med Commun. 2019;40:270–277. doi: 10.1097/MNM.0000000000000962. - DOI - PubMed