. 2020 Apr 6;217(4):e20190179.
doi: 10.1084/jem.20190179.

Mutation position is an important determinant for predicting cancer neoantigens

Affiliations

Mutation position is an important determinant for predicting cancer neoantigens

Aude-Hélène Capietto et al. J Exp Med. .

Abstract

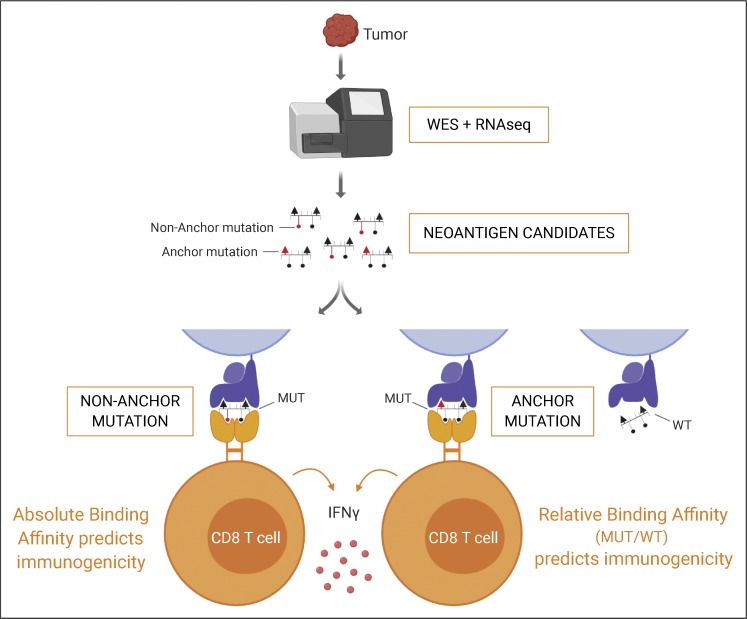
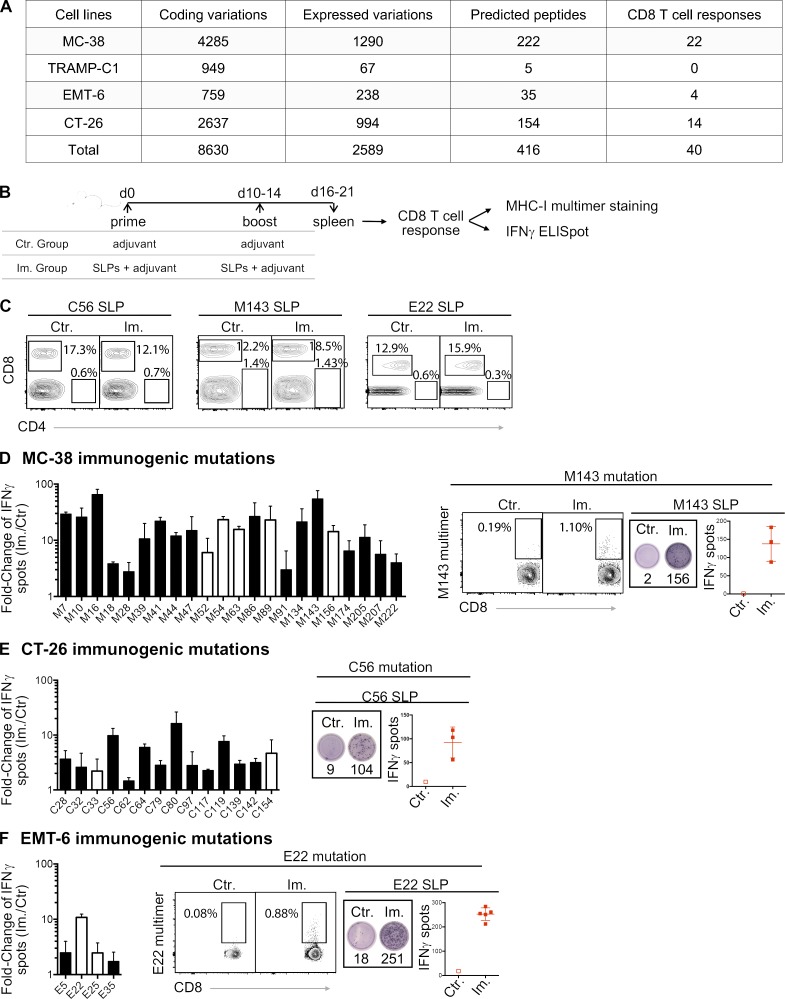
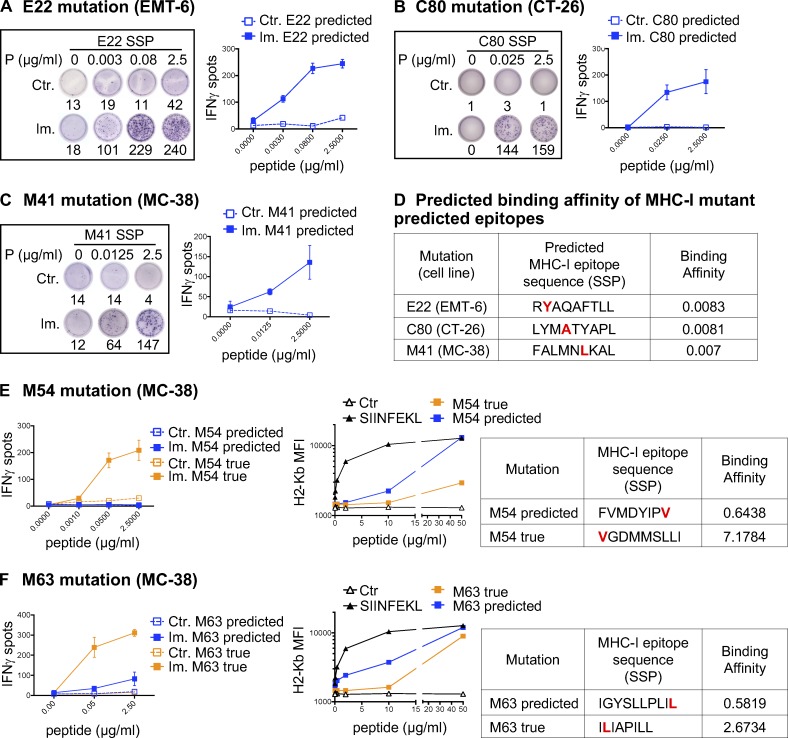
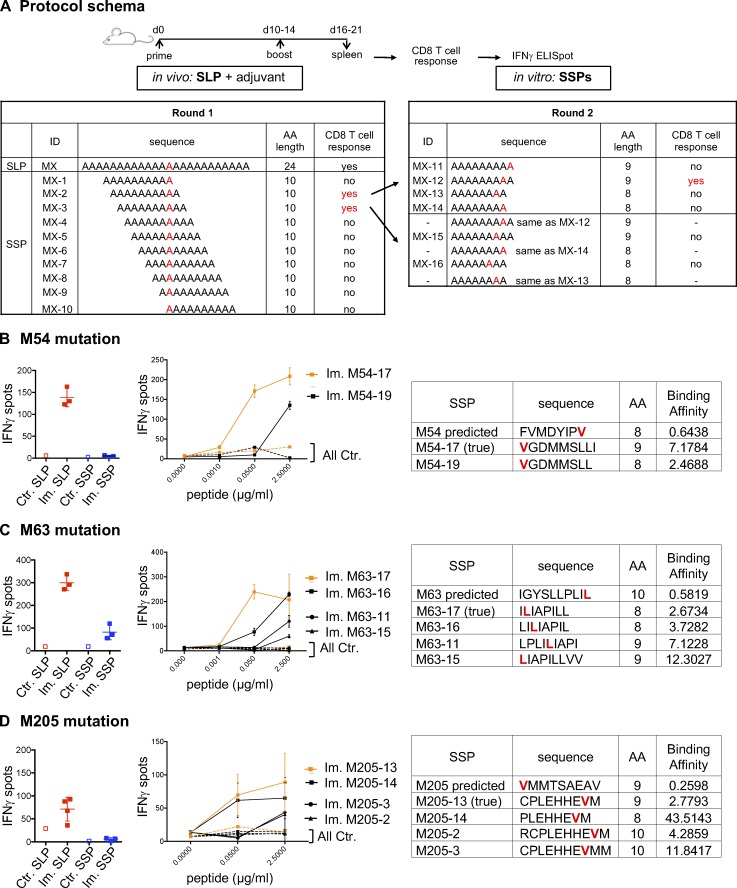
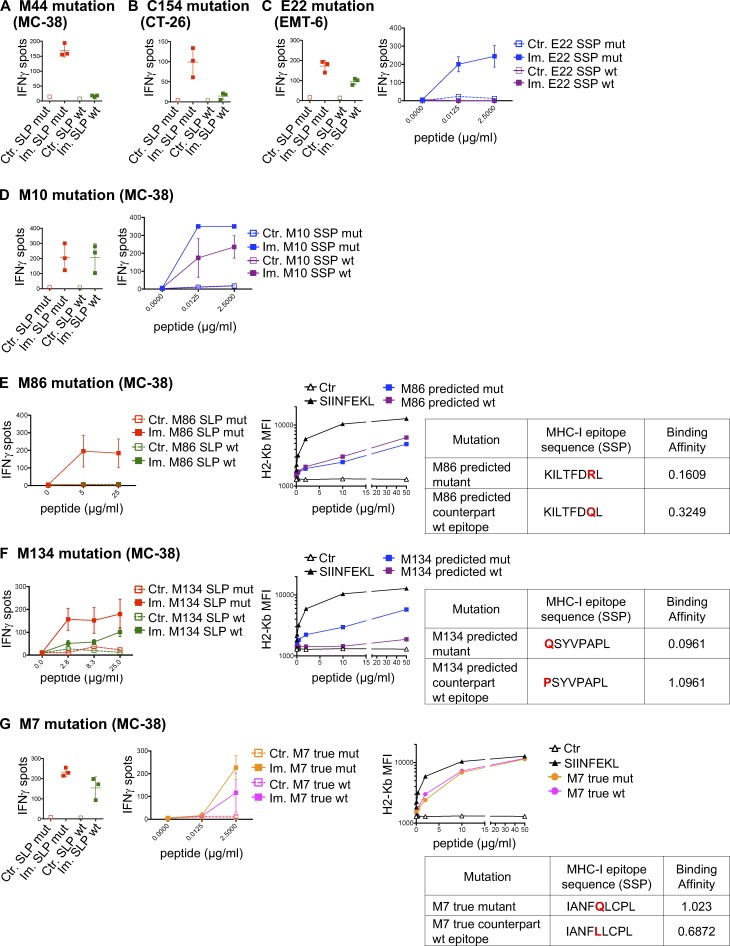
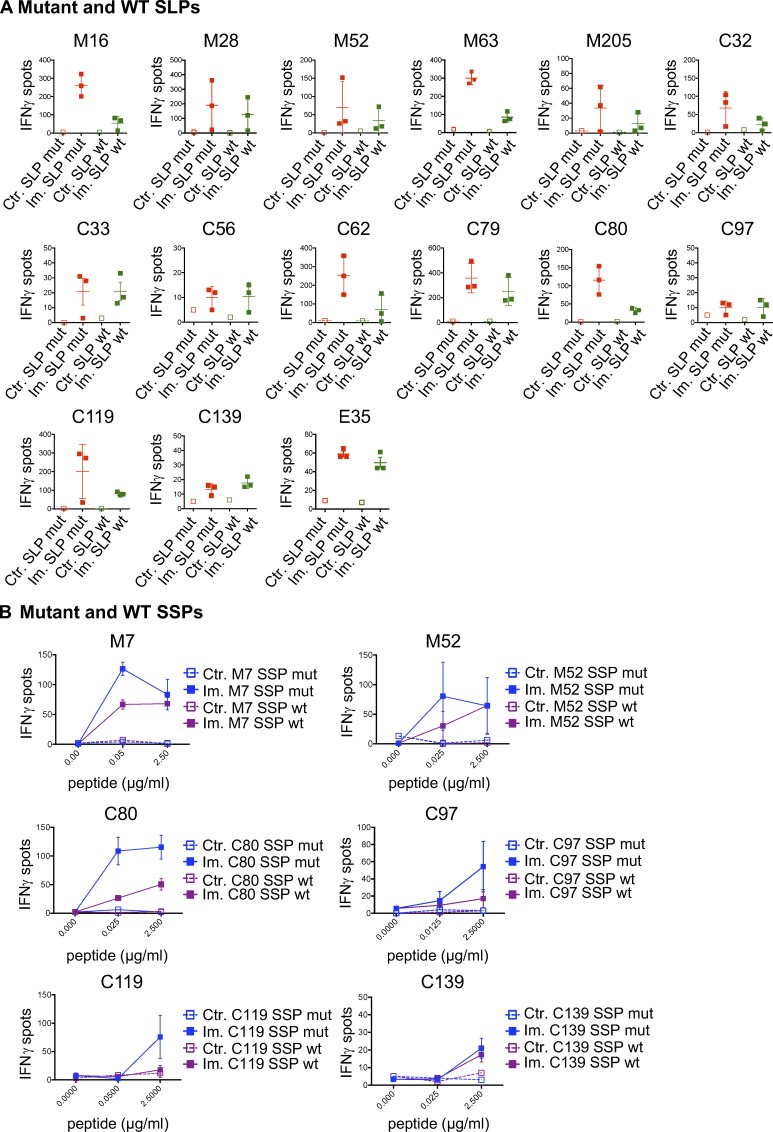
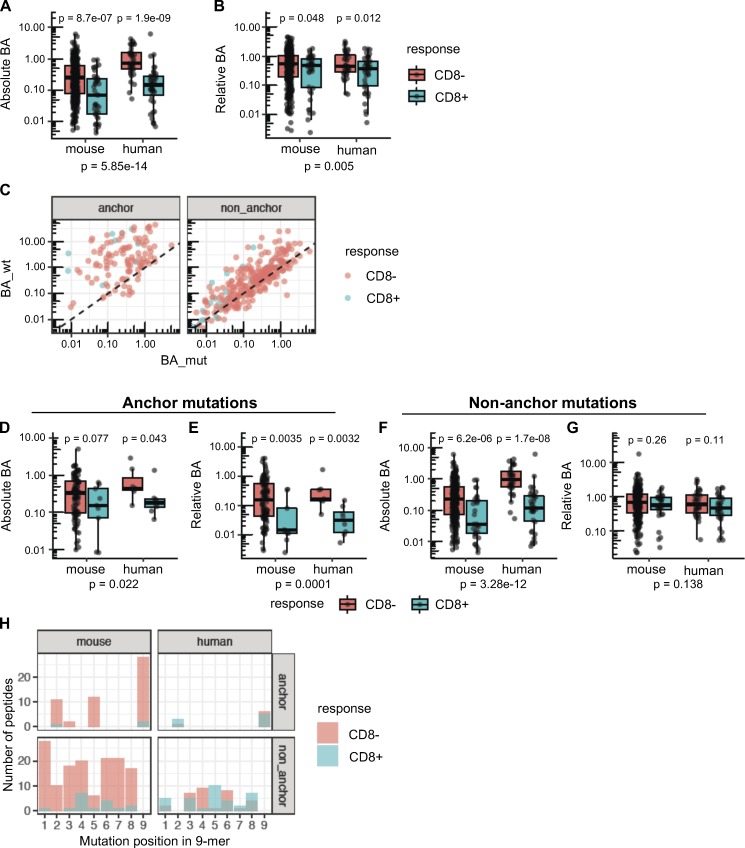
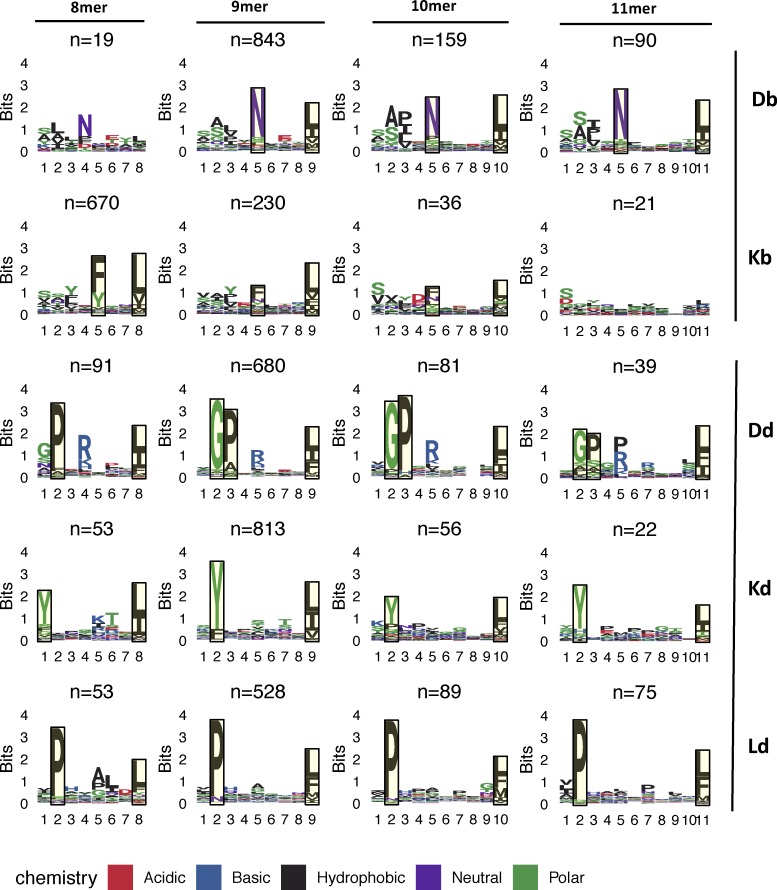
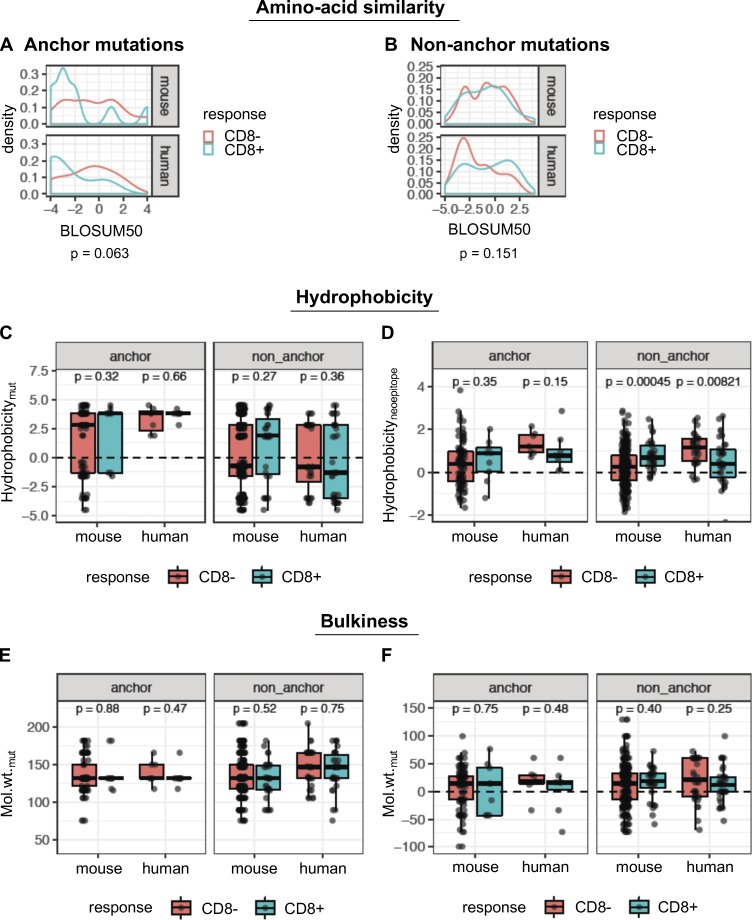
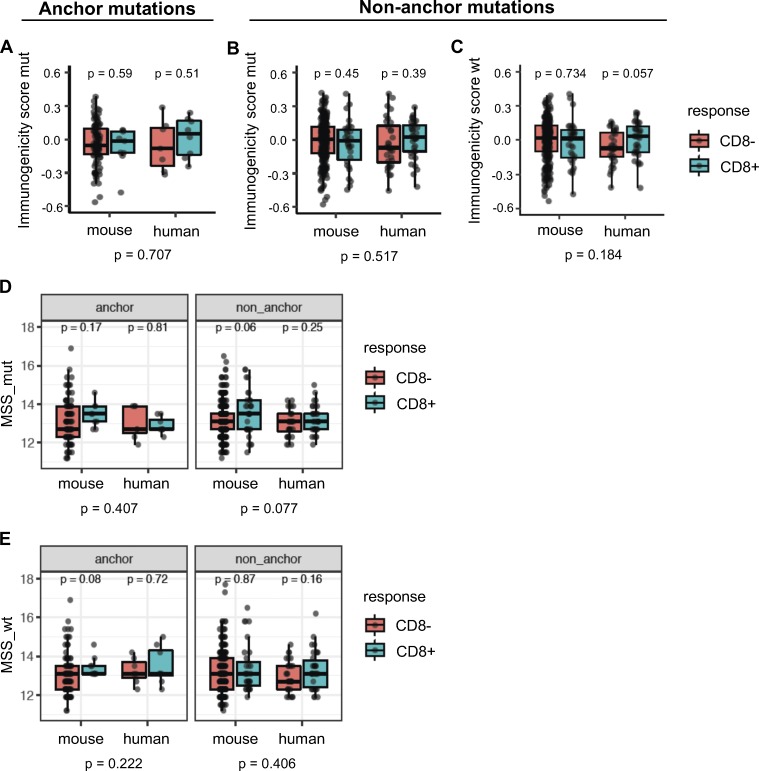
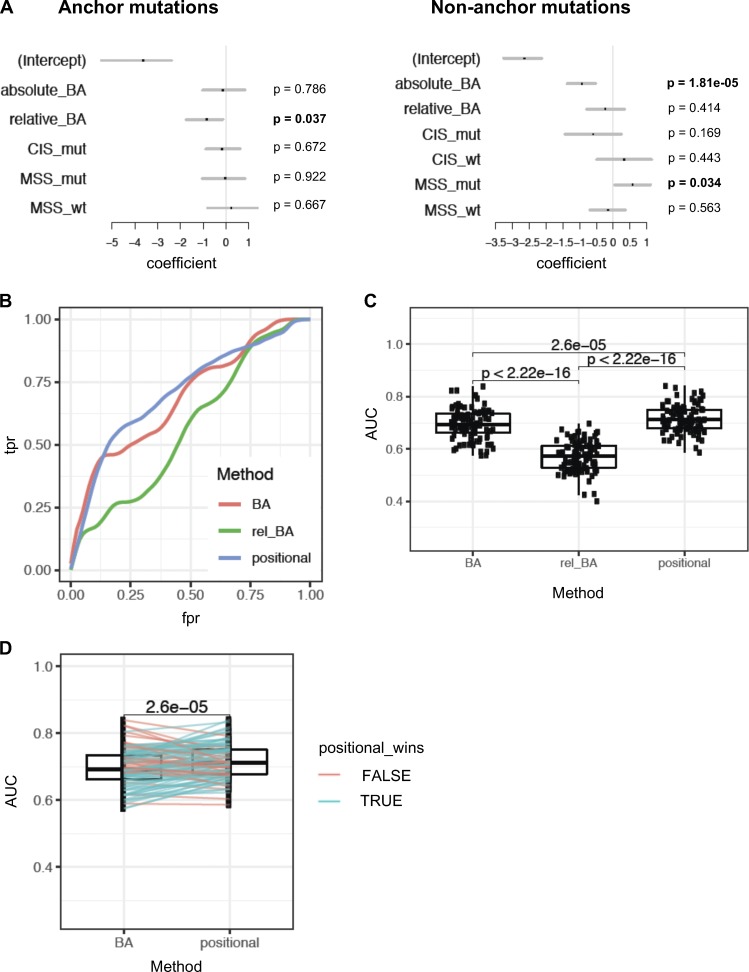
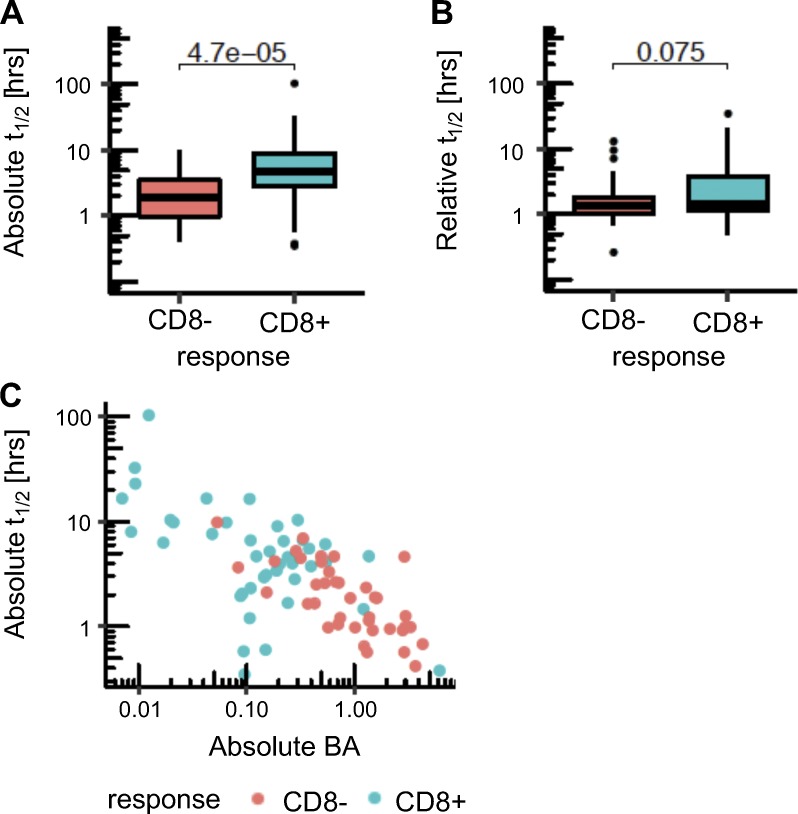
Tumor-specific mutations can generate neoantigens that drive CD8 T cell responses against cancer. Next-generation sequencing and computational methods have been successfully applied to identify mutations and predict neoantigens. However, only a small fraction of predicted neoantigens are immunogenic. Currently, predicted peptide binding affinity for MHC-I is often the major criterion for prioritizing neoantigens, although little progress has been made toward understanding the precise functional relationship between affinity and immunogenicity. We therefore systematically assessed the immunogenicity of peptides containing single amino acid mutations in mouse tumor models and divided them into two classes of immunogenic mutations. The first comprises mutations at a nonanchor residue, for which we find that the predicted absolute binding affinity is predictive of immunogenicity. The second involves mutations at an anchor residue; here, predicted relative affinity (compared with the WT counterpart) is a better predictor. Incorporating these features into an immunogenicity model significantly improves neoantigen ranking. Importantly, these properties of neoantigens are also predictive in human datasets, suggesting that they can be used to prioritize neoantigens for individualized neoantigen-specific immunotherapies.


Conflict of interest statement

Disclosures: Dr. Jhunjhunwala, Dr. Lupardus, and Dr. Delamarre reported a patent to US 20160069895 A1 pending. Dr. Wong reported personal fees from Oncomed Pharmaceuticals, personal fees from Array BioPharma, and personal fees from Pfizer outside the submitted work. Dr. de la Cruz reported "other" from Genentech outside the submitted work. Dr. Mellman reported personal fees from Genentech and grants from Genentech during the conduct of the study. No other disclosures were reported.

Figures

None
Graphical abstract
Figure 1.
Figure 1.
MHC-I immunogenicity of neoantigen candidates. (A) Number of exome and transcript variations, predicted peptides, and detected CD8 T cell responses for four mouse tumor cell lines (MC-38, TRAMP-C1, EMT-6, and CT-26). (B) Schema depicting the study protocol. Naive mice were immunized with mutant predicted SLPs + adjuvant (Im., immunized; adjuvants: anti-CD40 antibody and poly(I:C)) or adjuvant only (Ctr, control) on day 0 and days 10–14. CD8 T cell responses were assessed in spleen 6–7 d following the last immunization, either by IFN-gamma ELISpot (after CD4 T cell depletion) or MHC-I multimer staining. (C) Representative flow cytometry graphs from purity analysis of CD4 depletion from experiments assessing CD8 T cell responses shown in D–F. Purity of the depletion was ≥98%. (D–F) Representative data (from one experiment, repeated 3–11 independent times) of detected MHC-I immunogenic mutations are shown for each mouse model (D-MC-38, E-CT-26, and F-EMT-6). Anchor (white) and nonanchor (black) mutations are shown for each tumor model. Mean (± SD) fold-change of IFN-gamma spot numbers from CD8 T cells (5 × 10⁵ CD4-depleted splenocytes/well) between control (Ctr., n = 1) and immunized (Im., n = 3–5) mice after overnight stimulation with the mutant predicted SLP (25 µg/ml). Representative data and pictures of mutant-specific MHC-I multimer staining and/or IFN-gamma ELISpot for one mutation are shown for each mouse model. Each image is a representative well from an ELISpot plate.
Figure 2.
Figure 2.
Validation of MHC-I optimal predicted mutant epitopes. (A–C) Representative pictures of ELISpot wells and mean (± SD) IFN-gamma spot numbers from CD8 T cells (5 × 10⁵ CD4-depleted splenocytes/well) from control (Ctr., n = 1) or immunized (Im., n = 3) mice (in vivo protocol as in Fig. 1 B) after stimulation with the predicted optimal mutant SSPs (A-E22 mutation, EMT-6; B-C80 mutation, CT-26; C-M41 mutation, MC-38). Each image is a representative well from an ELISpot plate. (D) Sequence and BA (percentile rank) of the predicted optimal mutant epitopes in A–C (E22, H-2Kd; C80, H-2Kd; M41, H-2Db). (E and F) Mean (± SD) IFN-gamma spot numbers from CD8 T cells (5 × 10⁵ CD4-depleted splenocytes/well) from control (Ctr., n = 1) or immunized (Im., n = 3) mice (in vivo protocol as in Fig. 1 B) after stimulation with predicted and true mutant optimal epitopes (MC-38; E-M54 mutation; F-M63 mutation). Binding assay of the optimal and true SSPs to H-2Kb on Tap-1 KO EL-4 cells is shown for M54 and M63, as well as the sequence and BA (percentile rank) of the predicted optimal mutant epitopes. Each experiment was performed twice independently.
Figure S1.
Figure S1.
Immunogenicity of predicted MHC-I optimal mutant epitopes. (A) CD8 T cells (5 × 10⁵ CD4-depleted splenocytes/well) from control (Ctr., n = 1) or immunized (Im., n = 3) mice with mutant SLPs were isolated following the in vivo protocol as shown in Fig. 1 B and in vitro cultured with SLPs or SSPs to assess IFN-gamma release by ELISpot assay. To determine alternative neoepitopes of the poorly or nonimmunogenic predicted neoepitope candidate, IFN-gamma release was measured by neoantigen-specific CD8 T cells generated on SLP vaccines and restimulated in vitro with overlapping 10-, 9-, or 8-mer peptides containing the mutation. (B–D) Representative data of IFN-gamma spots (mean ± SD) from MC-38 mutations (B, M54; C, M63; D, M205) comparing the predicted mutant SLP (25 µg/ml) and optimal SSP (2.5 µg/ml) are shown, as well as the dose response (mean ± SEM to various concentrations) to 10-, 9-, or 8-mer immunogenic alternate optimal mutant peptides. Sequence, length, and predicted BA (H-2Kb for M54 and M63; H-2Db for M205) of each peptide (mutation in red) are shown. Each experiment was independently repeated twice.
Figure 3.
Figure 3.
Cross-reactivity between MHC-I mutant and WT counterpart neoantigens. (A–G) Representative data of mean ± SD IFN-gamma spot numbers from CD8 T cells (5 × 10⁵ CD4-depleted splenocytes/well) from control mice (Ctr., n = 1) or mice immunized with mutant SLPs (Im., n = 3) as depicted in Fig. 1 B, after in vitro restimulation with the mutant SLP or its WT counterpart (25 µg/ml; A-M44 mutation, MC-38; B-C154 mutation, CT-26; C-E22 mutation, EMT-6; D-M10 mutation, MC-38; E-M86 mutation, MC-38; F-M134 mutation, MC38; and G-M7 mutation, MC-38) or with the predicted mutant optimal epitope SSP or its WT counterpart (C, D, and G). Binding assay of the optimal mutant and its WT counterpart SSPs to H-2Kb on Tap-1 KO EL-4 cells is shown, as well as the sequence and the BA (percentile rank) of the predicted optimal epitopes (E–G). Each experiment was performed twice independently.
Figure S2.
Figure S2.
Cross-reactive mutant MHC-I neoantigen-specific T cells. (A and B) CD8 T cells (5 × 10⁵ CD4-depleted splenocytes/well) from control (Ctr., n = 1) or immunized (Im., n = 3) mice with mutant SLPs were isolated following the in vivo protocol shown in Fig. 1 B and in vitro cultured with mutant or WT counterpart SLPs (A; 25 µg/ml) or SSPs (B; 0–2.5 µg/ml) to assess cross-reactivity through IFN-gamma release by ELISpot assay. Representative data of IFN-gamma spots (mean ± SEM) from MC-38 mutations (M#), CT-26 (C#), and EMT-6 (E#) are shown. Each experiment was independently repeated twice.
Figure 4.
Figure 4.
Position of the mutation determines the importance of absolute or relative affinity for immunogenicity of neoepitopes. (A and B) Absolute BA (A) and relative BA (B) of candidate neoepitopes are shown for the neoantigens that induced CD8 T cell responses (blue) and for the neoantigens that were nonimmunogenic (red). A candidate neoepitope for a given mutation was identified as the peptide that had the best BA value of all 8–11-mer mutant peptides across all MHC-I alleles. P values in the plots are shown based on a t test on log-transformed values. P values in the subtitles are meta-analysis P values calculated using Fisher’s method. No distinction of anchor or nonanchor mutation was made here. Number of data points: 369 (mouse, CD8), 40 (mouse, CD8+), 39 (human, CD8), and 42 (human, CD8+). (C) Predicted BA values of mouse candidate neoepitopes and their WT counterparts are shown as scatter plots (Spearman correlation coefficient 0.81 and 0.32 for nonanchor and anchor mutations, respectively). Both anchor and nonanchor mutated peptides contain cases that show CD8 responses. Both anchor and nonanchor scatter plots show significant correlation in predicted BA between the mutant peptides and their WT counterparts (Spearman correlation test P value of 5.16 × 10⁻⁴ and 6.39 × 10−70 for anchor [n = 113] and nonanchor [n = 296] cases, respectively). (D–G) Predicted absolute BA of the neoepitope (D) and the predicted relative BA of the neoepitope to its WT counterpart (E) are shown, specifically for neoepitopes mutated at anchor residues. Number of data points: 104 (mouse, CD8), 9 (mouse, CD8+), 7 (human, CD8), and 8 (human, CD8+). Similarly, F and G show the predicted absolute BA and predicted relative BA at nonanchor mutations. Number of data points: 265 (mouse, CD8), 31 (mouse, CD8+), 32 (human, CD8) and 34 (human, CD8+). P values in the plots are based on t test, while the P values in the subtitles are meta-analysis P values calculated using Fisher’s method. (H) Number of peptides mutated at each position. Only 9-mer peptides are shown to retain comparability of positions across peptides, as a majority of the predicted neoepitopes were 9-mers. Peptide counts of immunogenic and nonimmunogenic peptides are shown as overlapping bar plots.
Figure 5.
Figure 5.
MHC-I peptide binding motifs. H-2′b′ and H-2′d′ allele motifs facetted by allele and peptide length are shown. Peptides identified from peptide elution experiments were clustered using GibbsCluster v2.0, using the largest cluster (default parameters and trash cluster option) that yielded the maximum total KLD, with the exceptions of the Db 8-mer and Kb 11-mer motifs. The H-2Db 8-mer motif was manually selected from a smaller cluster of a three-cluster solution that did not have maximum KLD but was similar to the other k-mer motifs from that allele. The H-2Kb 11-mer motif was derived from the full set of original peptides due to the small number of peptides. Putative anchor positions were selected for each allele and peptide length based on the information content at the residues and are shown in the highlighted blocks. Anchor positions were not defined for H-2Db 8-mer peptides as well as H-2Kb 11-mer peptides due to the low number of eluted peptides.
Figure 6.
Figure 6.
Physicochemical properties are not consistent predictors of immunogenicity. (A and B) Density plots of distributions of BLOSUM50 scores for the single amino acid substitutions, in immunogenic (blue) or nonimmunogenic (red) neoepitope candidates for anchor (A) and nonanchor (B) mutations. (C) The GRAVY hydrophobicity index of the mutant amino acid of the predicted neoepitope was compared between immunogenic and nonimmunogenic peptides. (D) The mean hydrophobicity index across all amino acids of the predicted neoepitope was also compared. Wilcoxon test was used to compare the hydrophobicity values between immunogenic and nonimmunogenic peptides. (E) Molecular weight of the mutant amino acid is shown for immunogenic and nonimmunogenic predicted neoepitopes. (F) The shift in molecular weight due to mutation is shown for the peptides. Wilcoxon test was used to compare the values between immunogenic and nonimmunogenic peptides. Wilcoxon rank sum test was used to compare the metrics (BLOSUM scores, hydrophobicity, etc.) between immunogenic and nonimmunogenic neoepitope candidates, separately for mouse and human cohorts. Species-specific values from this analysis are shown in the box plots. For the BLOSUM scores, the species-specific P values were combined into a single P value using Fisher’s method. Number of data points for anchor mutations: 104 (mouse, CD8), 9 (mouse, CD8+), 7 (human, CD8), and 8 (human, CD8+). Number of data points for nonanchor mutations: 265 (mouse, CD8), 31 (mouse, CD8+), 32 (human, CD8), and 34 (human, CD8+).
Figure 7.
Figure 7.
Similarity to immunogenic microbial peptides is not a consistent predictor of immunogenicity. The Calis model was used to score candidate neoepitopes or their WT counterparts for similarity of nonanchor amino acids with the nonanchor amino acid content of immunogenic microbial peptides. (A) When the mutation was at an anchor position, immunogenic and nonimmunogenic peptides did not differ in their immunogenicity scores from the Calis model. (B and C) For nonanchor mutations, median scores of immunogenic peptides in the human dataset were higher than nonimmunogenic peptides for both the mutant peptides (B) and their WT counterparts (C), but the trend was not statistically significant. (D and E) Each neoepitope or its WT counterpart was aligned to a set of immunogenic pathogenic peptides using BLAST, and the highest BLAST score was used as an MSS (MSS_mut, for neoepitopes, and MSS_wt, for their WT counterparts). P values shown at the bottom are meta-analysis P values across mouse and human datasets. P values within the plots (species-specific P values) were based on a Wilcoxon test, while the P values across the species were based on Fisher’s test using the species-specific P values. Numbers of data points are the same as in Fig. 6.
Figure 8.
Figure 8.
Positional model ranks neoantigens better than absolute or relative affinity alone. (A) Multivariate models were used to assess the significance of absolute BA of the mutant peptide (absolute_BA), relative affinity (relative_BA), CIS for mutant and WT peptides (CIS_mut and CIS_wt, respectively), and MSS (MSS_mut and MSS_wt). The analysis was done separately for neoepitope candidates with anchor mutations and for those without anchor mutations. Since CIS is identical for the mutant and WT peptides when the mutation is at an anchor, only CIS_mut was considered for the anchor mutation case. The set of these two models is referred to as a positional model. P values are mentioned for each separated model. (B) Performance assessment of the positional model, compared with models that use absolute or relative affinity alone without considering position of mutations with respect to anchor. Receiver-operator characteristic curves (true positive rate vs. false positive rate, or equivalently, sensitivity vs. [1 − specificity]) are shown based on 100 bootstrap iterations. A representative curve is shown for each method, using a Loess fit of 100 bootstrap iterations. (C) AUC of these curves across 100 bootstrap iterations were compared between the three methods (using paired t test). (D) Performance assessment of the positional model relative to predicted absolute BA was assessed by 100 bootstrap iterations. At each iteration, performance of ranking by the positional model and by predicted absolute BA alone was assessed on the held-out data to obtain AUC values. Pairwise comparison of the AUC values from the two methods is shown, and a paired t test was done to assess the difference. Blue lines indicate the iterations where the AUC of the positional model was higher than absolute BA on the held-out data; red lines indicate the cases where it was lower.
Figure S3.
Figure S3.
Comparison of peptide/MHC stability between immunogenic and nonimmunogenic neoepitope candidates. (A and B) Absolute (A) and relative (B) stability values as predicted by NetMHCstabpan are shown for the neoepitopes that induced CD8 T cell responses (blue) and for the neoepitope candidates that were nonimmunogenic (red) in the human data. P values in the plots are shown based on a t test. (C) Correlation between BA and stability for the human cohort is shown. Spearman’s ρ value is −0.64 (P value = 2.11 × 10⁻¹⁰ for correlation test).

References

    1. Abelin J.G., Keskin D.B., Sarkizova S., Hartigan C.R., Zhang W., Sidney J., Stevens J., Lane W., Zhang G.L., Eisenhaure T.M., et al. . 2017. Mass Spectrometry Profiling of HLA-Associated Peptidomes in Mono-allelic Cells Enables More Accurate Epitope Prediction. Immunity. 46:315–326. 10.1016/j.immuni.2017.02.007 - DOI - PMC - PubMed
    1. Balachandran V.P., Luksza M., Zhao J.N., Makarov V., Moral J.A., Remark R., Herbst B., Askan G., Bhanot U., Senbabaoglu Y., et al. . 2017. Identification of unique neoantigen qualities in long-term survivors of pancreatic cancer. Nature. 551:512–516. - PMC - PubMed
    1. Bates D., Mächler M., Bolker B., and Walker S.. 2015. Fitting linear mixed-effects models using lme4. J. Stat. Softw. 67:1–48. 10.18637/jss.v067.i01 - DOI
    1. Birnbaum M.E., Mendoza J.L., Sethi D.K., Dong S., Glanville J., Dobbins J., Ozkan E., Davis M.M., Wucherpfennig K.W., and Garcia K.C.. 2014. Deconstructing the peptide-MHC specificity of T cell recognition. Cell. 157:1073–1087. 10.1016/j.cell.2014.03.047 - DOI - PMC - PubMed
    1. Calis J.J., Maybeno M., Greenbaum J.A., Weiskopf D., De Silva A.D., Sette A., Keşmir C., and Peters B.. 2013. Properties of MHC class I presented peptides that enhance immunogenicity. PLOS Comput. Biol. 9:e1003266 10.1371/journal.pcbi.1003266 - DOI - PMC - PubMed

MeSH terms