. 2020 Mar 1;5(3):19-26.
doi: 10.1001/jamacardio.2019.5306.

Sex Differences in Blood Pressure Trajectories Over the Life Course

Affiliations

Sex Differences in Blood Pressure Trajectories Over the Life Course

Hongwei Ji et al. JAMA Cardiol. .

Erratum in

  • Error in Author Affiliation.
    [No authors listed] [No authors listed] JAMA Cardiol. 2020 Mar 1;5(3):364. doi: 10.1001/jamacardio.2020.0173. JAMA Cardiol. 2020. PMID: 32186678 Free PMC article. No abstract available.

Abstract

Importance: If we assume that women and men exhibit variations of the same fundamental vascular physiology, then conventional analyses of subclinical measures would suggest that women catch up to men by midlife in the extent of potentially important vascular disease. Alternatively, under the assumption that vascular physiology may fundamentally differ between women and men, a sex-specific analysis of existing data could offer new insights and augment our understanding of sex differences in cardiovascular diseases.

Objective: To evaluate whether longitudinal patterns of blood pressure (BP) elevation differ between women and men during the life course when considering baseline BP levels as the reference.

Design, setting, and participants: We conducted sex-specific analyses of longitudinal BP measures (144 599 observations) collected for a period of 43 years (1971 to 2014) in 4 community-based US cohort studies. The combined total included 32 833 participants (54% female) spanning ages 5 to 98 years. Data were analyzed between May 4, 2019, and August 5, 2019.

Exposures: Age and serially assessed longitudinal BP measures: systolic BP, diastolic BP, mean arterial pressure (MAP), and pulse pressure (PP).

Main outcomes and measures: Sex-specific change in each primary BP measure compared with baseline BP levels, derived from multilevel longitudinal models fitted over the age span, and new-onset cardiovascular disease events.

Results: Of the 32 833 participants, 17 733 were women (54%). Women compared with men exhibited a steeper increase in BP that began as early as in the third decade and continued through the life course (likelihood ratio test χ2 = 531 for systolic BP; χ2 = 123 for diastolic BP; χ2 = 325 for MAP; and χ2 = 572 for PP; P for all <.001). After adjustment for multiple cardiovascular disease risk factors, these between-sex differences in all BP trajectories persisted (likelihood ratio test χ2 = 314 for systolic BP; χ2 = 31 for diastolic BP; χ2 = 129 for MAP; and χ2 = 485 for PP; P for all <.001).

Conclusions and relevance: In contrast with the notion that important vascular disease processes in women lag behind men by 10 to 20 years, sex-specific analyses indicate that BP measures actually progress more rapidly in women than in men, beginning early in life. This early-onset sexual dimorphism may set the stage for later-life cardiovascular diseases that tend to present differently, not simply later, in women compared with men.


Conflict of interest statement

Conflict of Interest Disclosures: Dr Niiranen reported grants from Academy of Finland, the Finnish Medical Foundation, the Emil Aaltonen Foundation, and the Paavo Nurmi Foundation outside the submitted work. Dr Bairey Merz reported personal fees from iRhythm, Abbott Diagnostics, and from Sanofi during the conduct of the study. Dr Cheng reported grants from the National Institutes of Health during the conduct of the study and personal fees from Zogenix outside the submitted work. No other disclosures were reported.

Figures

Figure 1.
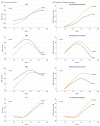
Figure 1.. Sex-Specific Trajectories of Blood Pressure (BP)
Life course trajectories of BP elevation are displayed on the same vertical axis in panel A, suggesting that BP levels in women catch up to men after midlife. Under the premise of sex-specific physiology, elevation in BP levels from baseline for both sexes is shown in panel B, indicating that BP elevation in women begins earlier and progresses more rapidly in women than in men over the life course. For BP trajectory plots, restricted cubic splines were fitted from mixed-effects linear regression models. P values for sex differences in BP trajectories were derived from the likelihood ratio test for models with and without parameters representing the interaction between sex and the cubic spline variables representing age. Shaded regions denote 95% CI. DBP indicates diastolic blood pressure; MAP, mean arterial pressure; PP, pulse pressure; SBP, systolic blood pressure.
Figure 2.
Figure 2.. Differences Between Women and Men in Incremental Blood Pressure (BP) Elevation From Baseline Levels
Under the premise of sex-specific physiology, we calculated between-sex differences (women minus men) in the change of BP values from baseline, and these data demonstrate faster rates of increase in women than men for all BP measures, particularly for systolic BP and pulse pressure (PP). Fitted lines denote mean sex differences in incremental BP (women vs men) from baseline, calculated from restricted cubic spline of mixed-effects linear regression models (Figure 1B). Shaded regions denote 95% CI. DBP indicates diastolic blood pressure; MAP, mean arterial pressure; SBP, systolic blood pressure.
Figure 3.
Figure 3.. Multivariable-Adjusted Sex-Specific Trajectories of Blood Pressure (BP) With Aging
The BP trajectories adjusted for multiple risk factors (body mass index, total cholesterol, diabetes, and smoking status) are displayed as bolder curves (with shading for error limits). Although BP trajectories in both sexes were attenuated with multivariable adjustment, consistent with the known contributions of risk factors to age-related BP elevation, between-sex differences in all BP trajectories persisted. P values are for sex differences in the BP trajectories. DBP indicates diastolic blood pressure; MAP, mean arterial pressure; PP, pulse pressure; SBP, systolic blood pressure.
Figure 4.
Figure 4.. Sex Differences in Cardiovascular Disease (CVD) Incidence
Cumulative incidence of hard CVD events is higher in men than in women over the life course; log-rank P value is shown.

Comment in

Similar articles

Cited by

References

    1. Dean J, Cruz SD, Mehta PK, Merz CN. Coronary microvascular dysfunction: sex-specific risk, diagnosis, and therapy. Nat Rev Cardiol. 2015;12(7):406-414. doi:10.1038/nrcardio.2015.72 - DOI - PubMed
    1. Eaton CB, Pettinger M, Rossouw J, et al. . Risk factors for incident hospitalized heart failure with preserved versus reduced ejection fraction in a multiracial cohort of postmenopausal women. Circ Heart Fail. 2016;9(10):e002883. doi:10.1161/CIRCHEARTFAILURE.115.002883 - DOI - PMC - PubMed
    1. Beale AL, Meyer P, Marwick TH, Lam CSP, Kaye DM. Sex differences in cardiovascular pathophysiology: why women are overrepresented in heart failure with preserved ejection fraction. Circulation. 2018;138(2):198-205. doi:10.1161/CIRCULATIONAHA.118.034271 - DOI - PubMed
    1. Cheng S, Xanthakis V, Sullivan LM, Vasan RS. Blood pressure tracking over the adult life course: patterns and correlates in the Framingham heart study. Hypertension. 2012;60(6):1393-1399. doi:10.1161/HYPERTENSIONAHA.112.201780 - DOI - PMC - PubMed
    1. Forouzanfar MH, Liu P, Roth GA, et al. . Global burden of hypertension and systolic blood pressure of at least 110 to 115 mm Hg, 1990-2015. JAMA. 2017;317(2):165-182. doi:10.1001/jama.2016.19043 - DOI - PubMed

Publication types