

Comparison of the Quality of Hospitals That Admit Medicare Advantage Patients vs Traditional Medicare Patients
- PMID: 31940041
- PMCID: PMC6991262
- DOI: 10.1001/jamanetworkopen.2019.19310
Comparison of the Quality of Hospitals That Admit Medicare Advantage Patients vs Traditional Medicare Patients
Abstract
Importance: In the Medicare Advantage (MA) program, Medicare enrollees may be steered by their health plan to specific hospitals. Little is known about the quality of hospitals that serve MA enrollees.
Objective: To compare the quality of hospitals that admit MA enrollees with the quality of those that admit traditional Medicare enrollees.
Design, setting, and participants: This cross-sectional study used data from the 2012 to 2016 Medicare Provider Analysis and Review to compare quality of care, as measured by the star rating given by the Centers for Medicare and Medicaid Services and readmission rates, in hospitals that serve MA enrollees and traditional Medicare enrollees using multinomial logit models. Participants were 7 130 610 Medicare beneficiaries admitted to 2994 acute care hospitals across the United States in 2016. Data were analyzed between August 2018 and August 2019.
Exposures: The exposure was MA enrollment. Adjusters included demographic and clinical characteristics and zip code fixed effects.
Main outcomes and measures: Hospital Compare star ratings and quintiles of performance in 30-day readmission rates.
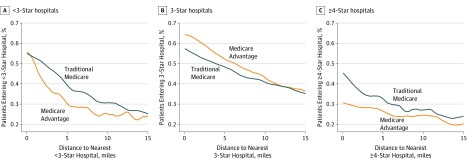
Results: The sample included 7 130 610 Medicare beneficiaries in 2016 (54.3% female; mean [SD] age, 72.7 [13.2] years). Of 12 190 270 total hospitalizations, 1 211 293 traditional Medicare and 494 352 MA patients were admitted to 718 low-readmission hospitals and 1 205 586 traditional Medicare and 526 955 MA patients were admitted to 597 high-readmission hospitals. Accounting for observed patient characteristics, MA enrollees less often entered either low- or high-quality hospitals and were more often admitted to average-quality hospitals. For nonemergent hospitalizations, MA enrollees were 1.9 percentage points (95% CI, 1.5-2.2 percentage points) less likely to enter a low-readmissions hospital, 5.1 percentage points (95% CI, 4.6-5.6 percentage points) more likely to enter an average-readmissions hospital, and 3.2 percentage points (95% CI, 2.9-3.5 percentage points) less likely to enter a high-readmissions hospital compared with traditional Medicare enrollees. Patients with MA were also 2.6 percentage points (95% CI, 2.2-2.9 percentage points) less likely to enter a 1- to 2-star hospital, 5.5 percentage points (95% CI, 4.9-5.9 percentage points) more likely to enter a 3-star hospital, and 2.8 percentage points (95% CI, 2.5-3.2 percentage points) less likely to enter a 4- to 5-star hospital compared with traditional Medicare enrollees. The differences were less pronounced for emergency admissions.
Conclusions and relevance: This study found that enrollees in MA plans were more likely to be admitted to average-quality hospitals instead of either high- or low-quality hospitals, suggesting that MA plans may be steering their enrollees to specific hospitals.
Conflict of interest statement
Figures
References
-
- Jacobson G, Damico A, Neuman T, Gold M; Kaiser Family Foundation. Medicare Advantage 2017 spotlight: enrollment market update. https://www.kff.org/medicare/issue-brief/medicare-advantage-2017-spotlig.... Published June 6, 2017. Accessed August 7, 2019.
-
- Kliff S. I read 1,182 emergency room bills this year. here’s what I learned. Vox https://www.vox.com/health-care/2018/12/18/18134825/emergency-room-bills.... Published December 18, 2018. Accessed August 7, 2019.
Publication types
MeSH terms
Grants and funding
LinkOut - more resources
Full Text Sources
Medical
