

Ultrastructure of light-activated axons following optogenetic stimulation to produce late-phase long-term potentiation
- PMID: 31940316
- PMCID: PMC6961864
- DOI: 10.1371/journal.pone.0226797
Ultrastructure of light-activated axons following optogenetic stimulation to produce late-phase long-term potentiation
Abstract
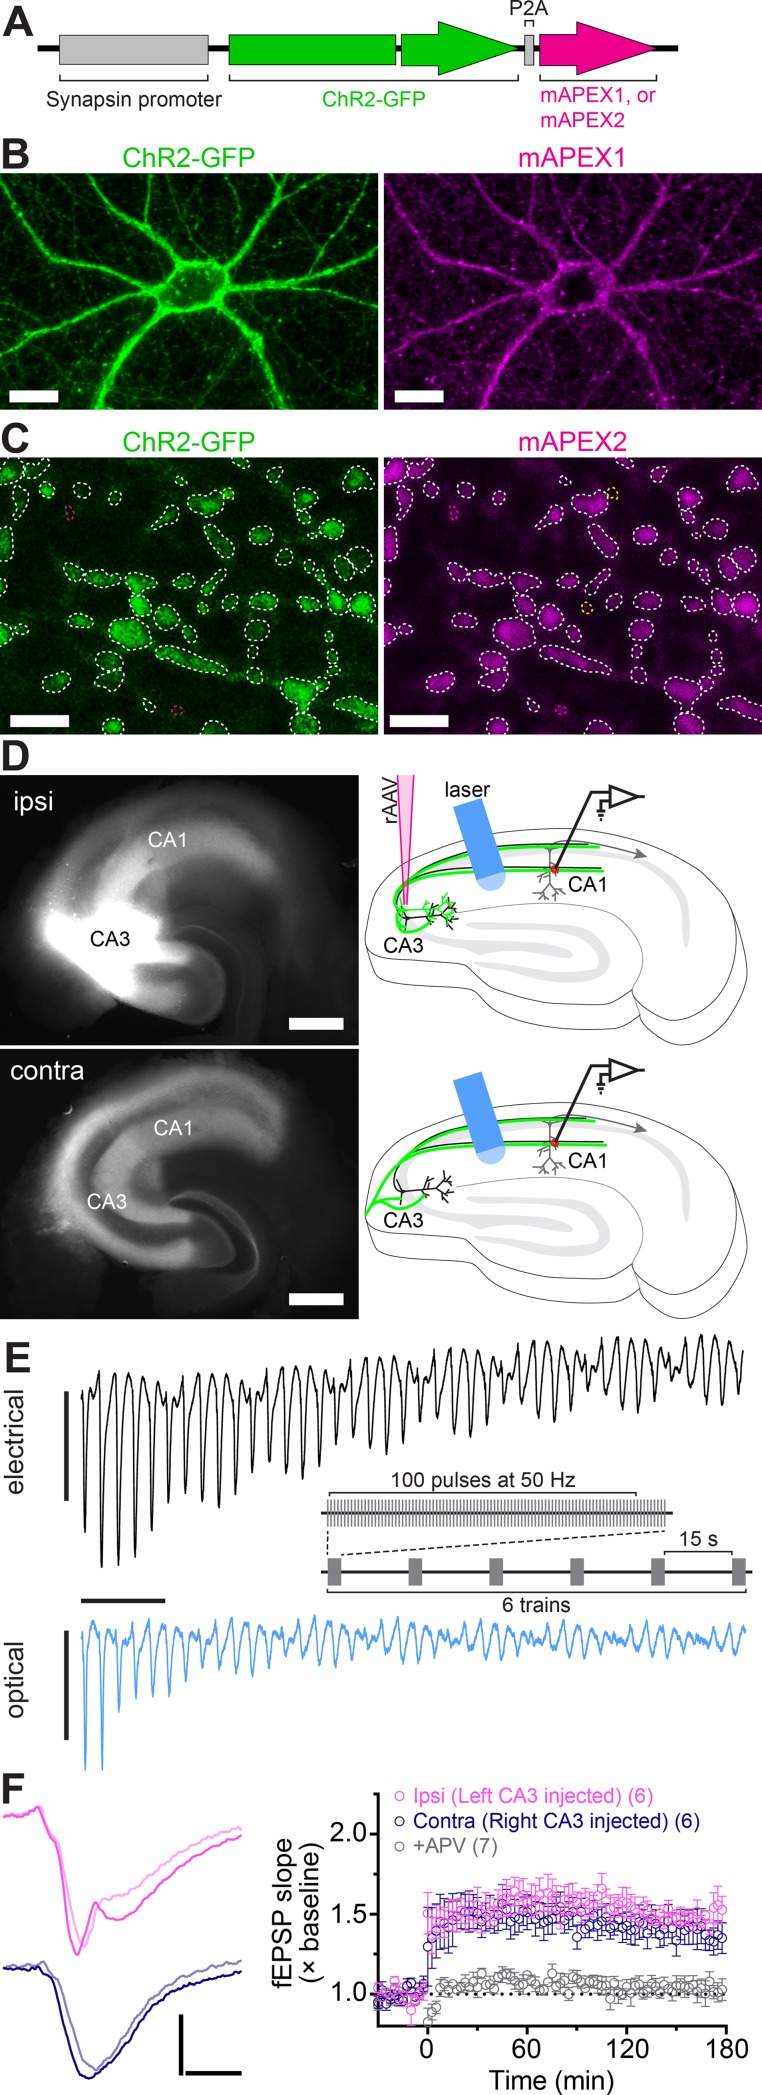
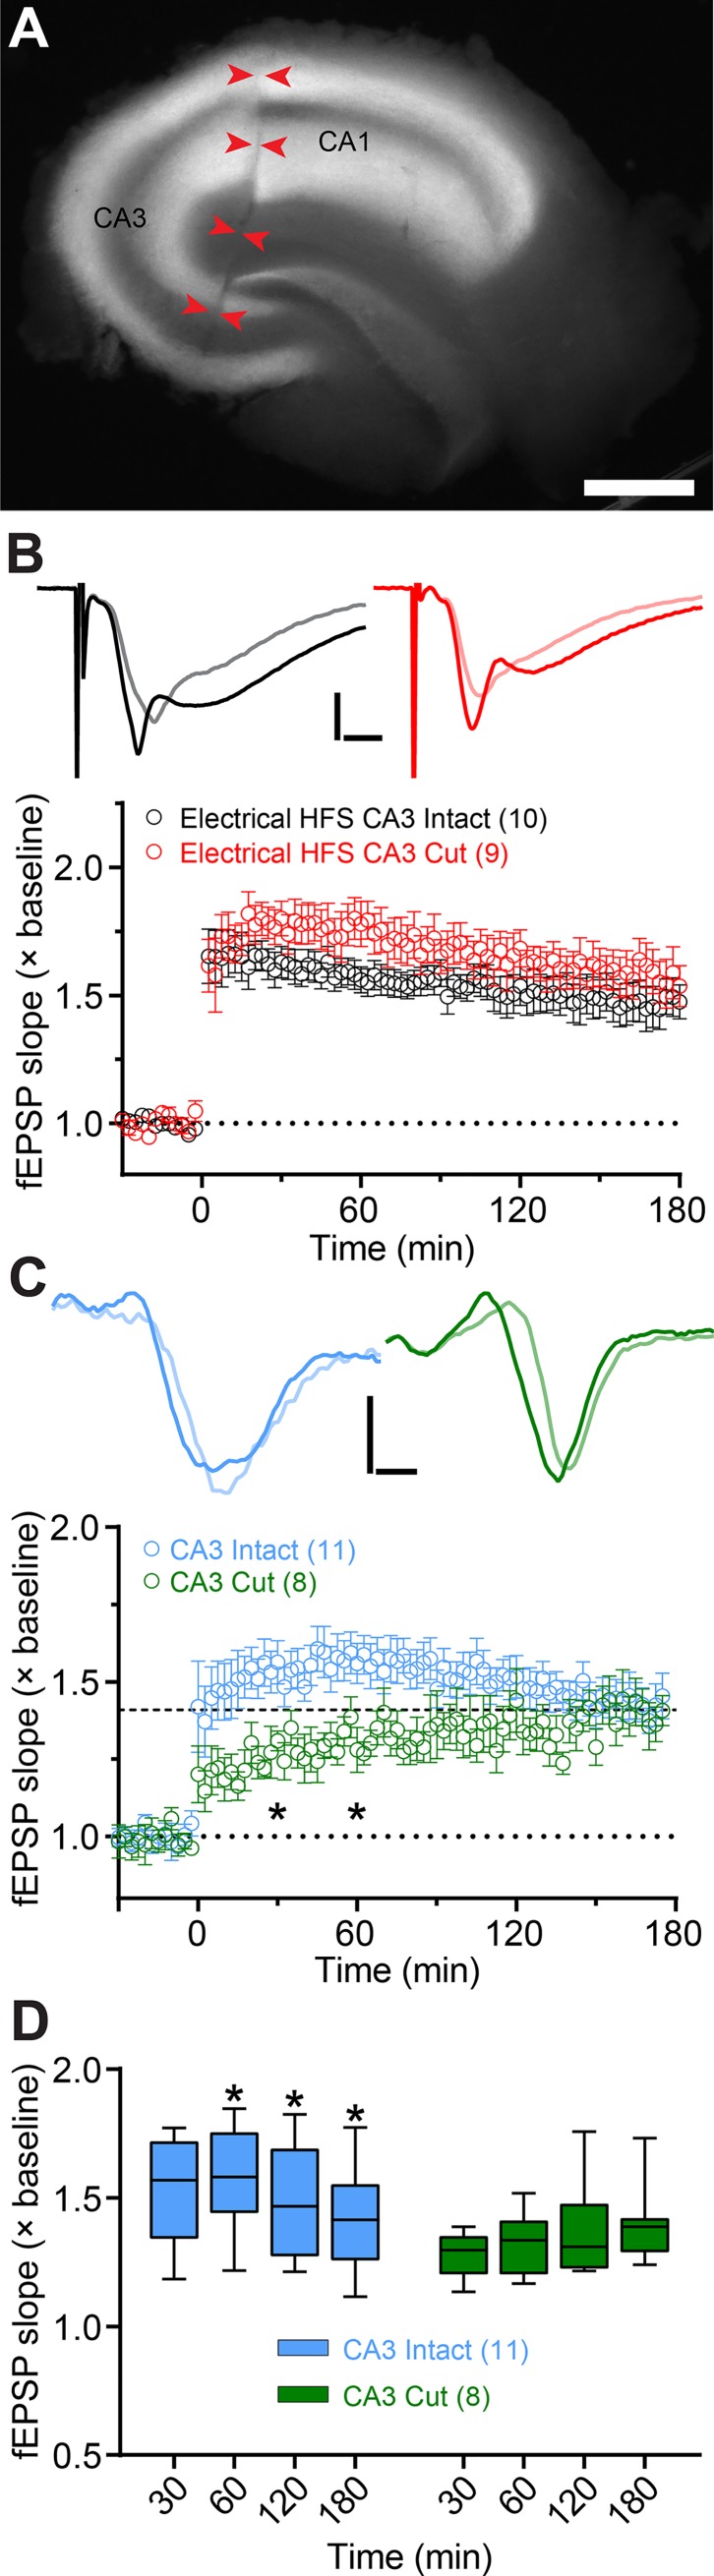
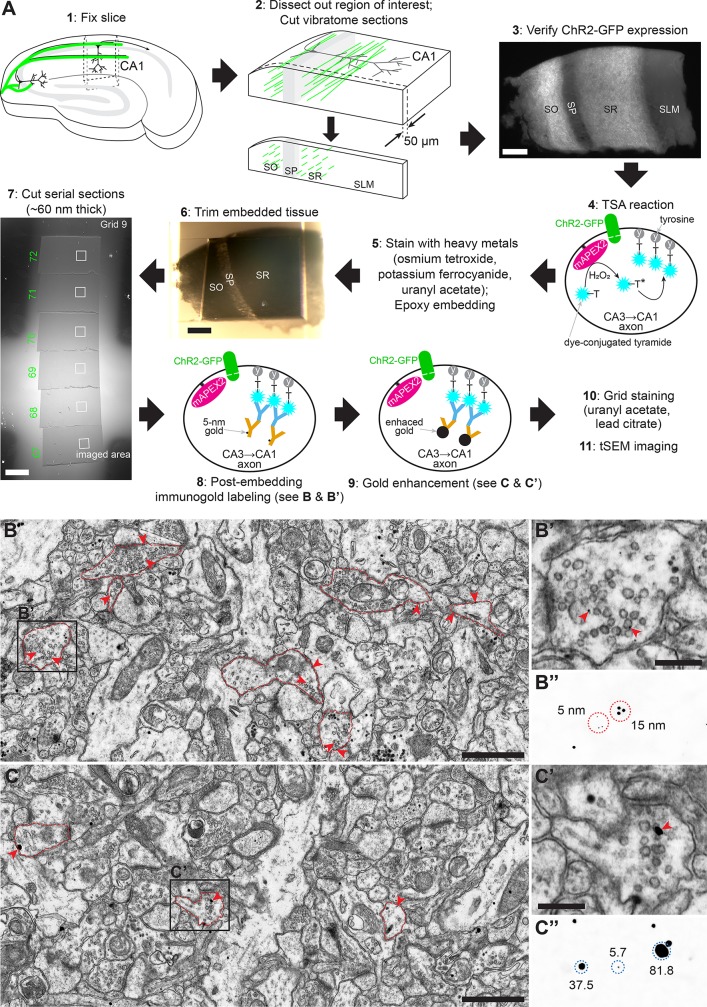
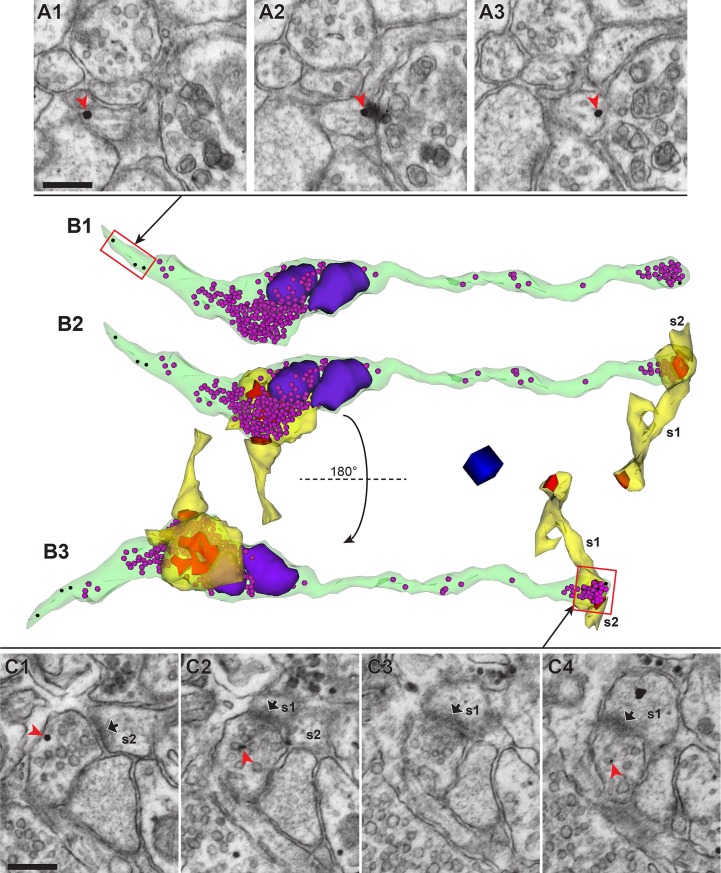
Analysis of neuronal compartments has revealed many state-dependent changes in geometry but establishing synapse-specific mechanisms at the nanoscale has proven elusive. We co-expressed channelrhodopsin2-GFP and mAPEX2 in a subset of hippocampal CA3 neurons and used trains of light to induce late-phase long-term potentiation (L-LTP) in area CA1. L-LTP was shown to be specific to the labeled axons by severing CA3 inputs, which prevented back-propagating recruitment of unlabeled axons. Membrane-associated mAPEX2 tolerated microwave-enhanced chemical fixation and drove tyramide signal amplification to deposit Alexa Fluor dyes in the light-activated axons. Subsequent post-embedding immunogold labeling resulted in outstanding ultrastructure and clear distinctions between labeled (activated), and unlabeled axons without obscuring subcellular organelles. The gold-labeled axons in potentiated slices were reconstructed through serial section electron microscopy; presynaptic vesicles and other constituents could be quantified unambiguously. The genetic specification, reliable physiology, and compatibility with established methods for ultrastructural preservation make this an ideal approach to link synapse ultrastructure and function in intact circuits.
Conflict of interest statement
The authors have declared that no competing interests exist.
Figures
Similar articles
-
Occurrence and three-dimensional structure of multiple synapses between individual radiatum axons and their target pyramidal cells in hippocampal area CA1.J Neurosci. 1993 Sep;13(9):3736-48. doi: 10.1523/JNEUROSCI.13-09-03736.1993. J Neurosci. 1993. PMID: 8366344 Free PMC article.
-
Chemically induced long-term potentiation increases the number of perforated and complex postsynaptic densities but does not alter dendritic spine volume in CA1 of adult mouse hippocampal slices.Eur J Neurosci. 2005 Jun;21(12):3368-78. doi: 10.1111/j.1460-9568.2005.04174.x. Eur J Neurosci. 2005. PMID: 16026474
-
Long-term potentiation of evoked presynaptic response at CA3-CA1 synapses by transient oxygen-glucose deprivation in rat brain slices.Exp Brain Res. 2006 Feb;169(1):126-9. doi: 10.1007/s00221-005-0314-5. Epub 2005 Dec 21. Exp Brain Res. 2006. PMID: 16369784
-
Long-term change in synaptic transmission in CA3 circuits followed by spontaneous rhythmic activity in rat hippocampal slices.Neurosci Res. 2001 Aug;40(4):325-36. doi: 10.1016/s0168-0102(01)00244-9. Neurosci Res. 2001. PMID: 11463478
-
5-Hz stimulation of CA3 pyramidal cell axons induces a beta-adrenergic modulated potentiation at synapses on CA1, but not CA3, pyramidal cells.Brain Res. 1998 May 25;794(1):75-9. doi: 10.1016/s0006-8993(98)00217-0. Brain Res. 1998. PMID: 9630529
Cited by
-
Ultrastructural Imaging of Activity-Dependent Synaptic Membrane-Trafficking Events in Cultured Brain Slices.Neuron. 2020 Dec 9;108(5):843-860.e8. doi: 10.1016/j.neuron.2020.09.004. Epub 2020 Sep 28. Neuron. 2020. PMID: 32991831 Free PMC article.
-
Targeting the insular cortex for neuropathic pain modulation: Insights into synaptic and neuronal mechanisms.FASEB J. 2025 Jan 31;39(2):e70285. doi: 10.1096/fj.202402381R. FASEB J. 2025. PMID: 39831885 Free PMC article.
-
Structural LTP: from synaptogenesis to regulated synapse enlargement and clustering.Curr Opin Neurobiol. 2020 Aug;63:189-197. doi: 10.1016/j.conb.2020.04.009. Epub 2020 Jul 10. Curr Opin Neurobiol. 2020. PMID: 32659458 Free PMC article. Review.
-
Review of Post-embedding Immunogold Methods for the Study of Neuronal Structures.Front Neuroanat. 2021 Oct 14;15:763427. doi: 10.3389/fnana.2021.763427. eCollection 2021. Front Neuroanat. 2021. PMID: 34720893 Free PMC article. Review.
-
Synaptic Odyssey.J Neurosci. 2020 Jan 2;40(1):61-80. doi: 10.1523/JNEUROSCI.0735-19.2019. J Neurosci. 2020. PMID: 31896563 Free PMC article. No abstract available.
References
-
- Popov VI, Davies HA, Rogachevsky VV, Patrushev IV, Errington ML, Gabbott PLA, et al. Remodelling of synaptic morphology but unchanged synaptic density during late phase long-term potentiation(ltp): A serial section electron micrograph study in the dentate gyrus in the anaesthetised rat. Neuroscience. 2004;128: 251–262. 10.1016/j.neuroscience.2004.06.029 - DOI - PubMed
Publication types
MeSH terms
Grants and funding
LinkOut - more resources
Full Text Sources
Miscellaneous
