

Age and altitude of residence determine anemia prevalence in Peruvian 6 to 35 months old children
- PMID: 31940318
- PMCID: PMC6961872
- DOI: 10.1371/journal.pone.0226846
Age and altitude of residence determine anemia prevalence in Peruvian 6 to 35 months old children
Abstract
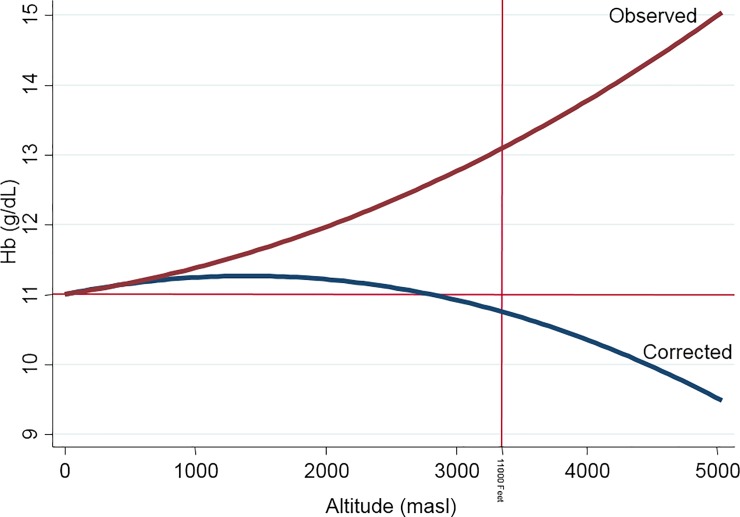
Background: A Demographic and Family Health Survey (ENDES, for Encuesta Demográfica y de Salud Familiar in Spanish) is carried out annually in Peru. Based on it, the anemia prevalence was 43.6% in 2016 and 43.8% in 2017 using the WHO cutoff value of 11 g/dL and the altitude-correction equation.
Objective: To assess factors contributing to anemia and to determine its prevalence in Peruvian children 6 to 35 months old.
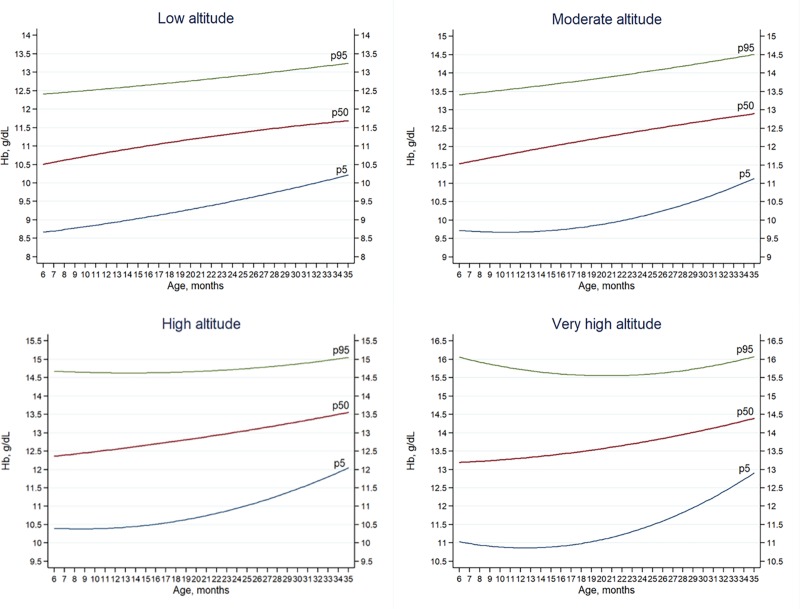
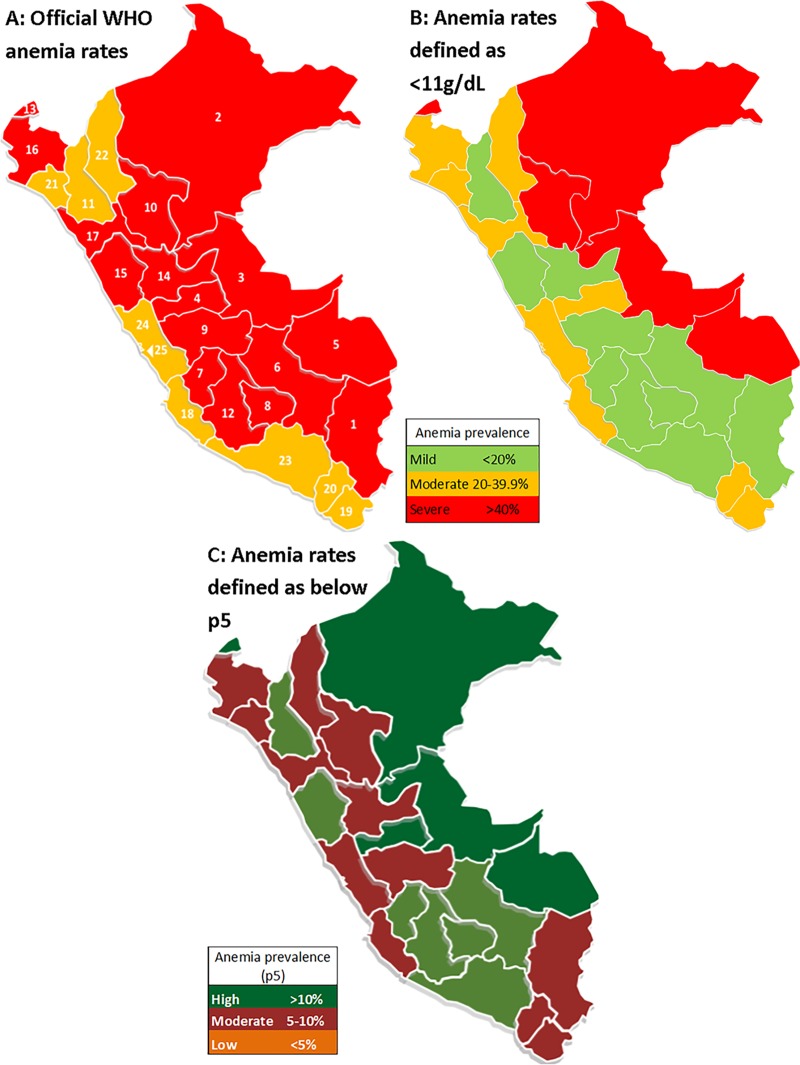
Methods: We used the MEASURE DHS-based ENDES survey to obtain representative data for11364 children from 6 to 35 months old on hemoglobin and health determinants. To evaluate normal hemoglobin levels, we used the original WHO criterion of the 5th percentile in children without chronic malnutrition and then applied it to the overall population. Relationships between hemoglobin and altitude levels, usage of cleaning methods to sanitize water safe to drink, usage of solid fuels and poverty status were tested using methodology for complex survey data. Percentile curves were made for altitude intervals by plotting hemoglobin compared to age. The new anemia rates are presented in graphs by Peruvian political regions according to the degree of public health significance.
Results: Hemoglobin increased as age and altitude of residence increased. Using the 5th percentile, anemia prevalence was 7.3% in 2016 and 2017. Children from low altitudes had higher anemia prevalence (8.5%) than those from high altitudes (1.2%, p<0.0001). In the rainforest area of Peru, anemia prevalence was highest (13.5%), while in the highlands it was lowest (3.3%, p<0.0001). With access to safe drinking water and without chronic malnutrition, anemia rates could be reduced in the rainforest by 45% and 33%, respectively.
Conclusion: Anemia prevalence in Peruvian children from 6 to 35 months old was 7.3% in 2016 and 2017.
Conflict of interest statement
The authors have declared that no competing interests exist.
Figures
Similar articles
-
Hemoglobin Concentration in Children at Different Altitudes in Peru: Proposal for [Hb] Correction for Altitude to Diagnose Anemia and Polycythemia.High Alt Med Biol. 2018 Dec;19(4):398-403. doi: 10.1089/ham.2018.0032. Epub 2018 Sep 22. High Alt Med Biol. 2018. PMID: 30251888 Free PMC article.
-
Factors associated with anemia in children under three years of age in Perú: analysis of the Encuesta Demográfica y de Salud Familiar, ENDES, 2007-2013.Biomedica. 2016 Jun 3;36(2):220-9. doi: 10.7705/biomedica.v36i2.2896. Biomedica. 2016. PMID: 27622483
-
Changes in hemoglobin levels with age and altitude in preschool-aged children in Peru: the assessment of two individual-based national databases.Ann N Y Acad Sci. 2021 Mar;1488(1):67-82. doi: 10.1111/nyas.14520. Epub 2020 Nov 4. Ann N Y Acad Sci. 2021. PMID: 33147649 Free PMC article.
-
[Child malnutrition in children under 5 years of age in Peru: trends and determinants].Rev Panam Salud Publica. 2014 Feb;35(2):104-12. Rev Panam Salud Publica. 2014. PMID: 24781091 Spanish.
-
Inequalities in anemia among Peruvian children aged 6-59 months: A decomposition analysis.Front Public Health. 2023 Mar 31;11:1068083. doi: 10.3389/fpubh.2023.1068083. eCollection 2023. Front Public Health. 2023. PMID: 37064707 Free PMC article.
Cited by
-
Iron status and hemoglobin adjustment by altitude to define anemia in children aged 6 to 8 months living in Lima, Arequipa, Cusco and Puno.Rev Peru Med Exp Salud Publica. 2023 Out-Dec;40(4):395-405. doi: 10.17843/rpmesp.2023.404.12573. Rev Peru Med Exp Salud Publica. 2023. PMID: 38597467 Free PMC article.
-
Prevalence Rate and Associated Risk Factors of Anaemia among under Five Years Children in Ethiopia.Nutrients. 2022 Jun 28;14(13):2693. doi: 10.3390/nu14132693. Nutrients. 2022. PMID: 35807875 Free PMC article.
-
Anaemia among under-five children: Is maternal marriage at 18th birthday and above protective? Evidence from 15 countries in Sub-Saharan Africa.Matern Child Nutr. 2021 Oct;17(4):e13226. doi: 10.1111/mcn.13226. Epub 2021 Jun 3. Matern Child Nutr. 2021. PMID: 34081411 Free PMC article.
-
Evaluation of the hemoglobin cutoff point for anemia in adult women residents of different altitudinal levels in Peru.PLoS One. 2024 Jul 30;19(7):e0307502. doi: 10.1371/journal.pone.0307502. eCollection 2024. PLoS One. 2024. PMID: 39078861 Free PMC article.
-
Evaluation of dietary composition between hemoglobin categories, total body iron content and adherence to multi-micronutrients in preschooler residents of the highlands of Puno, Peru.BMC Nutr. 2024 Feb 12;10(1):28. doi: 10.1186/s40795-024-00837-x. BMC Nutr. 2024. PMID: 38347656 Free PMC article.
References
-
- World Health Organization. Iron deficiency anemia: Report of a study group. Wld Hlth Org techn Rep Ser. 1959;(182):4. - PubMed
-
- WHO Scientific Group on Nutritional Anaemias, World Health Organization. Nutritional anaemias: report of a WHO scientific group [meeting held in Geneva from 13 to 17 March 1967]. World Health Organ Tech Rep Ser. 1968;405 - PubMed
-
- Monge MC. La enfermedad de los Andes (Síndromes eritrémicos). Anales de la Facultad de Medicina. 1928; 14:1–314.
Publication types
MeSH terms
LinkOut - more resources
Full Text Sources
Medical
