. 2020 Jan 15;15(1):e0227285.
doi: 10.1371/journal.pone.0227285. eCollection 2020.

Quantitative PCR provides a simple and accessible method for quantitative microbiota profiling

Affiliations

Quantitative PCR provides a simple and accessible method for quantitative microbiota profiling

Ching Jian et al. PLoS One. .

Abstract

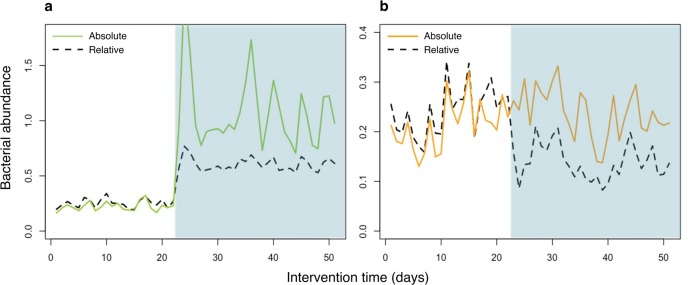
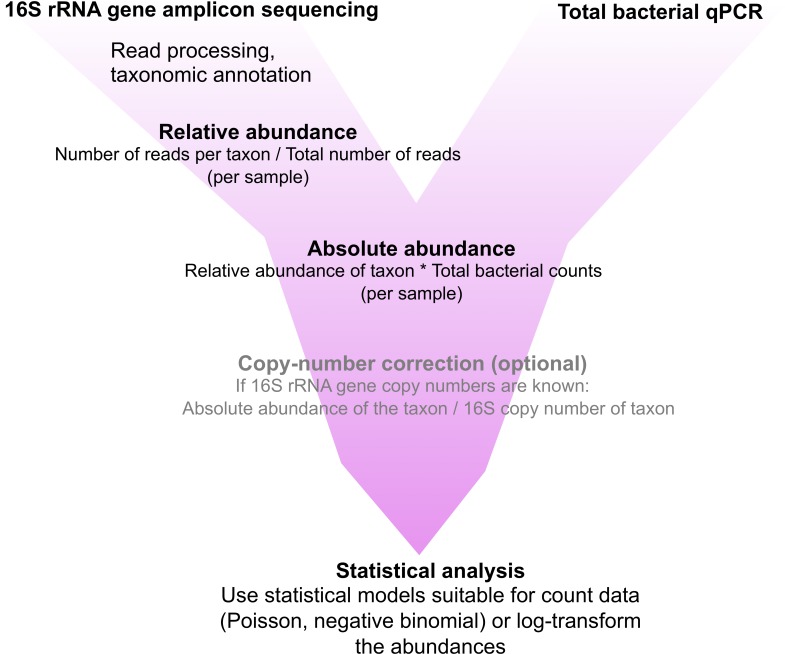
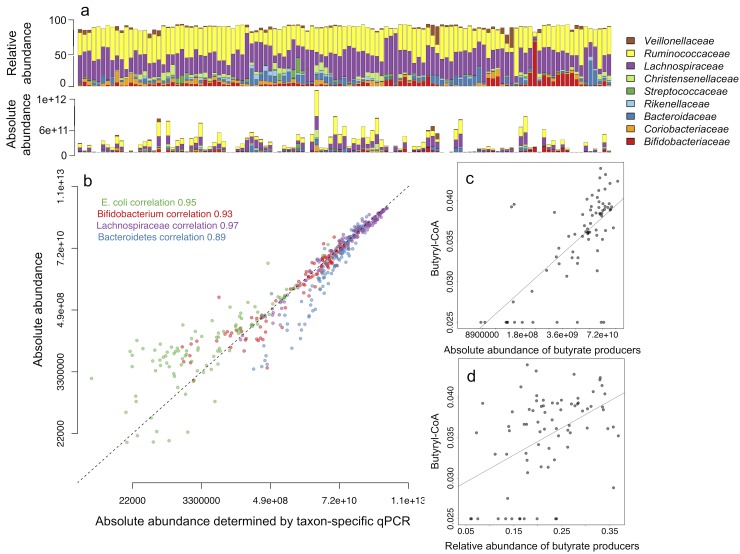
The use of relative abundance data from next generation sequencing (NGS) can lead to misinterpretations of microbial community structures, as the increase of one taxon leads to the concurrent decrease of the other(s) in compositional data. Although different DNA- and cell-based methods as well as statistical approaches have been developed to overcome the compositionality problem, and the biological relevance of absolute bacterial abundances has been demonstrated, the human microbiome research has not yet adopted these methods, likely due to feasibility issues. Here, we describe how quantitative PCR (qPCR) done in parallel to NGS library preparation provides an accurate estimation of absolute taxon abundances from NGS data and hence provides an attainable solution to compositionality in high-throughput microbiome analyses. The advantages and potential challenges of the method are also discussed.


Conflict of interest statement

The authors have declared that no competing interests exist.

Figures

Fig 1
Fig 1. Compositionality leading to false positive discoveries.
To demonstrate the effect of compositionality on interpretation of microbiome NGS data, an intervention was simulated where a single taxon increased in abundance. The simulation was conducted in absolute abundance, which was converted to relative abundance for data analysis. (a) The intervention (shaded area) increased a single taxon (green solid line), which remained true when converted to relative abundance (black dashed line). (b) Other taxa (a single taxon represented here by the orange solid line) were not affected by the intervention. However, the relative abundance (black dashed line) shows a negative impact of the intervention, due to the increase in relative abundance of the affected taxon in (a).
Fig 2
Fig 2. Workflow for implementation of qPCR-based quantitative microbiome profiling.
All of these steps are included in R package mare [18].
Fig 3
Fig 3. Relative microbiome profiles translated into quantitative microbiome profiles using qPCR.
(a) Comparison of relative abundances and estimated absolute abundances of dominant bacterial families in 114 fecal samples. The top panel shows relative abundances based on 16S amplicon sequencing and the lower panels shows the estimated absolute abundances calculated by multiplying the relative abundances with total bacterial load, i.e. qPCR-based estimate of copies of 16S gene per 1 g of feces. (b) Correlation between the qPCR abundances (16S rRNA gene copies per g feces) and the estimated absolute abundances of four taxa representing species, genus, family and phylum levels. The dashed line shows the expected 1:1 correspondence. The correspondence decreases at the very low end of the abundance range, likely due to the relatively lower PCR amplification efficiency and increased stochasticity of the results for low abundance taxa in NGS [30]. The applied library preparation method (dual index TruSeq-tailed 1-step amplification [17]) causes a slight underestimation of Bacteroidetes abundance (unpublished data), explaining the underestimation observed for this phylum compared to qPCR. (c) and (d) show the associations between the qPCR-determined abundance of the butyryl-CoA:acetate CoA-transferase gene and the (c) estimated absolute abundance and (d) relative abundance of butyrate producers detected in the NGS data.

References

    1. Knight R, Vrbanac A, Taylor BC, Aksenov A, Callewaert C, Debelius J, et al. Best practices for analysing microbiomes. Nature reviews Microbiology. 2018;16(7):410–22. Epub 2018/05/26. 10.1038/s41579-018-0029-9 . - DOI - PubMed
    1. Gloor GB, Macklaim JM, Pawlowsky-Glahn V, Egozcue JJ. Microbiome Datasets Are Compositional: And This Is Not Optional. Frontiers in microbiology. 2017;8:2224 Epub 2017/12/01. 10.3389/fmicb.2017.02224 - DOI - PMC - PubMed
    1. Tsilimigras MC, Fodor AA. Compositional data analysis of the microbiome: fundamentals, tools, and challenges. Annals of epidemiology. 2016;26(5):330–5. Epub 2016/06/04. 10.1016/j.annepidem.2016.03.002 . - DOI - PubMed
    1. Morton JT, Marotz C, Washburne A, Silverman J, Zaramela LS, Edlund A, et al. Establishing microbial composition measurement standards with reference frames. Nat Commun. 2019;10(1):2719 Epub 2019/06/22. 10.1038/s41467-019-10656-5 - DOI - PMC - PubMed
    1. Contijoch EJ, Britton GJ, Yang C, Mogno I, Li Z, Ng R, et al. Gut microbiota density influences host physiology and is shaped by host and microbial factors. eLife. 2019;8 Epub 2019/01/23. 10.7554/eLife.40553 - DOI - PMC - PubMed

Publication types

MeSH terms

LinkOut - more resources