Niemann-Pick C1 Heterogeneity of Bat Cells Controls Filovirus Tropism
- PMID: 31940478
- PMCID: PMC11075117
- DOI: 10.1016/j.celrep.2019.12.042
Niemann-Pick C1 Heterogeneity of Bat Cells Controls Filovirus Tropism
Abstract
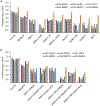
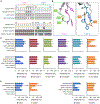
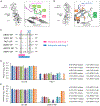
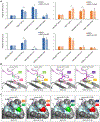
Fruit bats are suspected to be natural hosts of filoviruses, including Ebola virus (EBOV) and Marburg virus (MARV). Interestingly, however, previous studies suggest that these viruses have different tropisms depending on the bat species. Here, we show a molecular basis underlying the host-range restriction of filoviruses. We find that bat-derived cell lines FBKT1 and ZFBK13-76E show preferential susceptibility to EBOV and MARV, respectively, whereas the other bat cell lines tested are similarly infected with both viruses. In FBKT1 and ZFBK13-76E, unique amino acid (aa) sequences are found in the Niemann-Pick C1 (NPC1) protein, one of the cellular receptors interacting with the filovirus glycoprotein (GP). These aa residues, as well as a few aa differences between EBOV and MARV GPs, are crucial for the differential susceptibility to filoviruses. Taken together, our findings indicate that the heterogeneity of bat NPC1 orthologs is an important factor controlling filovirus species-specific host tropism.
Keywords: Ebola virus; Marburg virus; Niemann-Pick C1; bat; filovirus; glycoprotein; host range; natural host; receptor; virus-host interaction.
Copyright © 2019 The Authors. Published by Elsevier Inc. All rights reserved.
Conflict of interest statement
DECLARATION OF INTERESTS
The authors declare no competing interests.
Figures


Similar articles
-
Decoding the blueprint of receptor binding by filoviruses through large-scale binding assays and machine learning.Cell Host Microbe. 2025 Feb 12;33(2):294-313.e11. doi: 10.1016/j.chom.2024.12.016. Epub 2025 Jan 15. Cell Host Microbe. 2025. PMID: 39818205
-
Structural and Energetic Basis for Differential Binding of Ebola and Marburg Virus Glycoproteins to a Bat-Derived Niemann-Pick C1 Protein.J Infect Dis. 2023 Nov 15;228(Suppl 7):S479-S487. doi: 10.1093/infdis/jiad120. J Infect Dis. 2023. PMID: 37119290
-
Receptor-Mediated Host Cell Preference of a Bat-Derived Filovirus, Lloviu Virus.Microorganisms. 2020 Oct 5;8(10):1530. doi: 10.3390/microorganisms8101530. Microorganisms. 2020. PMID: 33027954 Free PMC article.
-
Potential pharmacological strategies targeting the Niemann-Pick C1 receptor and Ebola virus glycoprotein interaction.Eur J Med Chem. 2021 Nov 5;223:113654. doi: 10.1016/j.ejmech.2021.113654. Epub 2021 Jun 19. Eur J Med Chem. 2021. PMID: 34175537 Review.
-
Filovirus entry: a novelty in the viral fusion world.Viruses. 2012 Feb;4(2):258-75. doi: 10.3390/v4020258. Epub 2012 Feb 7. Viruses. 2012. PMID: 22470835 Free PMC article. Review.
Cited by
-
Emerging viruses: Cross-species transmission of coronaviruses, filoviruses, henipaviruses, and rotaviruses from bats.Cell Rep. 2022 Jun 14;39(11):110969. doi: 10.1016/j.celrep.2022.110969. Epub 2022 May 30. Cell Rep. 2022. PMID: 35679864 Free PMC article. Review.
-
Accelerated viral dynamics in bat cell lines, with implications for zoonotic emergence.Elife. 2020 Feb 3;9:e48401. doi: 10.7554/eLife.48401. Elife. 2020. PMID: 32011232 Free PMC article.
-
Decoding the blueprint of receptor binding by filoviruses through large-scale binding assays and machine learning.Cell Host Microbe. 2025 Feb 12;33(2):294-313.e11. doi: 10.1016/j.chom.2024.12.016. Epub 2025 Jan 15. Cell Host Microbe. 2025. PMID: 39818205
-
Isolation of infectious Lloviu virus from Schreiber's bats in Hungary.Nat Commun. 2022 Mar 31;13(1):1706. doi: 10.1038/s41467-022-29298-1. Nat Commun. 2022. PMID: 35361761 Free PMC article.
-
Traits, phylogeny and host cell receptors predict Ebolavirus host status among African mammals.PLoS Negl Trop Dis. 2022 Dec 21;16(12):e0010993. doi: 10.1371/journal.pntd.0010993. eCollection 2022 Dec. PLoS Negl Trop Dis. 2022. PMID: 36542657 Free PMC article.
References
-
- Amman BR, Carroll SA, Reed ZD, Sealy TK, Balinandi S, Swanepoel R, Kemp A, Erickson BR, Comer JA, Campbell S, et al. (2012). Seasonal pulses of Marburg virus circulation in juvenile Rousettus aegyptiacus bats coincide with periods of increased risk of human infection. PLoS Pathog. 8,e1002877. - PMC - PubMed
-
- Barrette RW, Metwally SA, Rowland JM, Xu L, Zaki SR, Nichol ST, Rollin PE, Towner JS, Shieh WJ, Batten B, et al. (2009). Discovery of swine as a host for the Reston ebolavirus. Science 325, 204–206. - PubMed
-
- Bastian ST Jr., Tanaka K, Anunciado RV, Natural NG, Sumalde AC, and Namikawa T (2002). Evolutionary relationships of flying foxes (genus Pteropus) in the Philippines inferred from DNA sequences of cytochrome b gene. Biochem. Genet 40, 101–116. - PubMed
-
- Bates P, Francis C, Gumal M, Bumrungsri S, Walston J, Heaney L, and Mildenstein T (2008). Pteropus vampyrus. In The IUCN Red List of Threatened Species 2008. 10.2305/IUCN.UK.2008.RLTS.T18766A8593657.en. - DOI
Publication types
MeSH terms
Substances
Grants and funding
LinkOut - more resources
Full Text Sources
Research Materials

