. 2020 Jan 14;30(2):320-334.e6.
doi: 10.1016/j.celrep.2019.12.019.

Neuroinflammation-Associated Aspecific Manipulation of Mouse Predator Fear by Toxoplasma gondii

Affiliations

Neuroinflammation-Associated Aspecific Manipulation of Mouse Predator Fear by Toxoplasma gondii

Madlaina Boillat et al. Cell Rep. .

Abstract

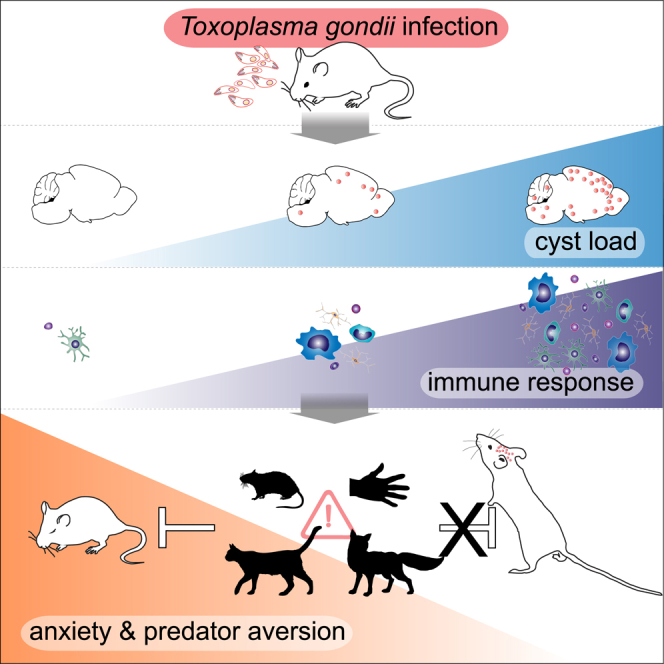
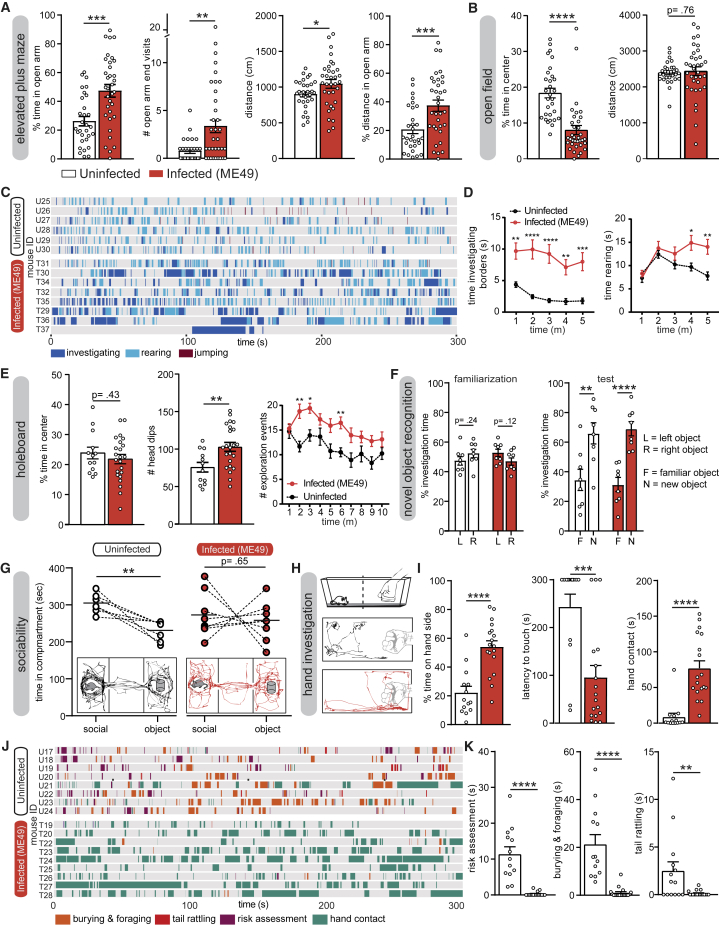
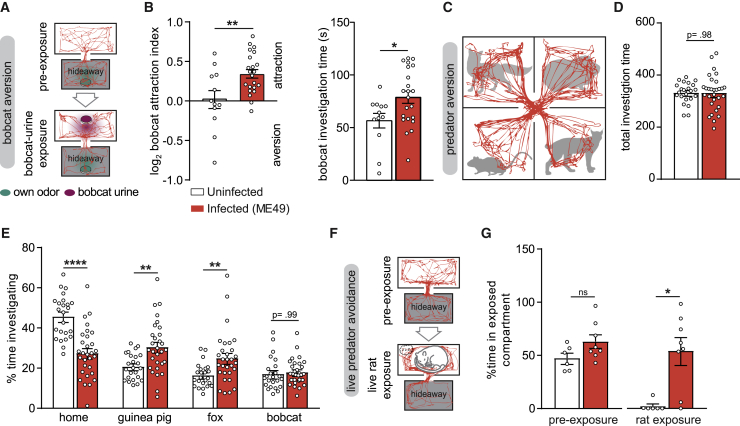
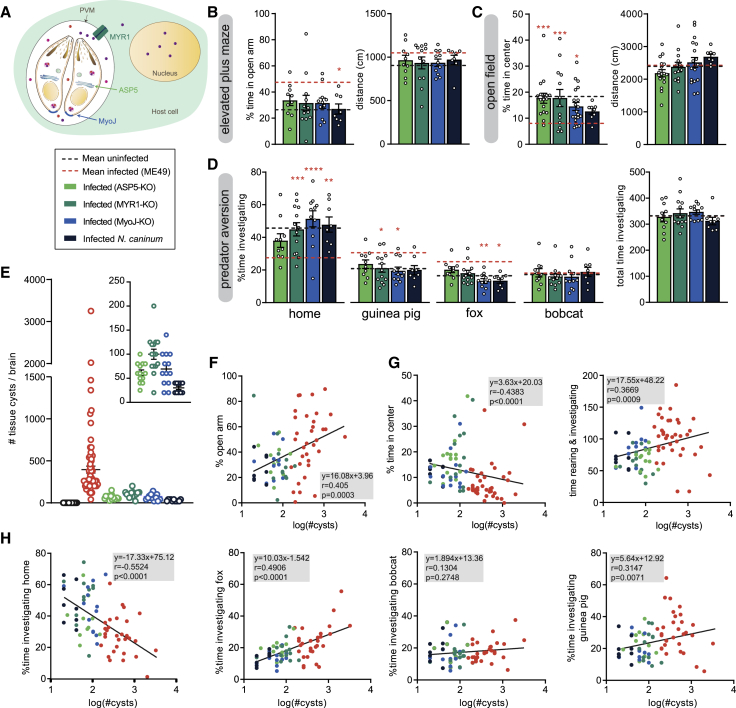
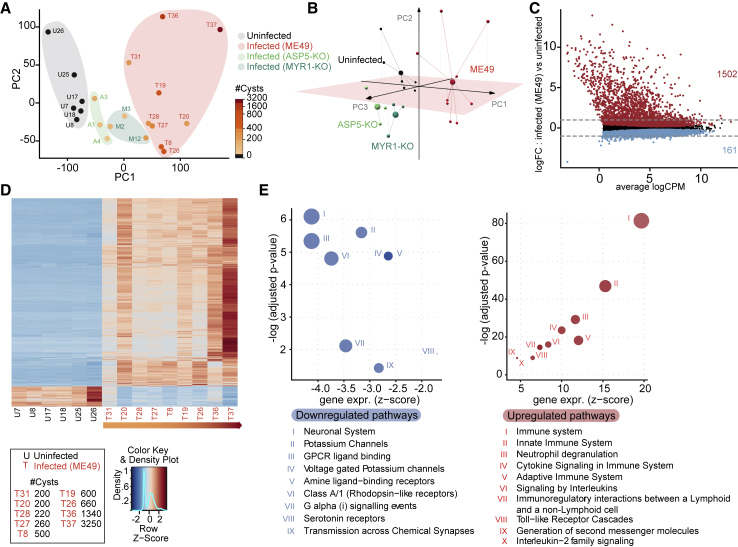
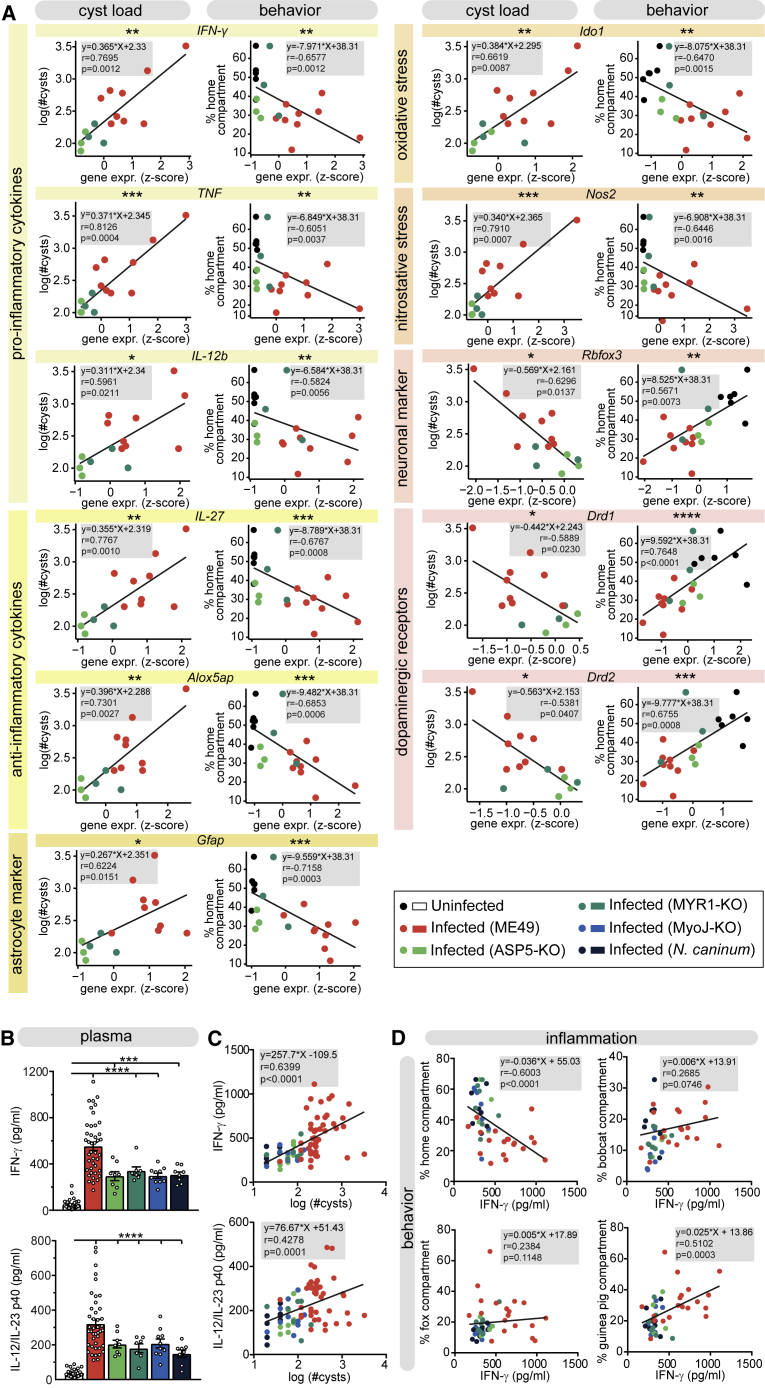
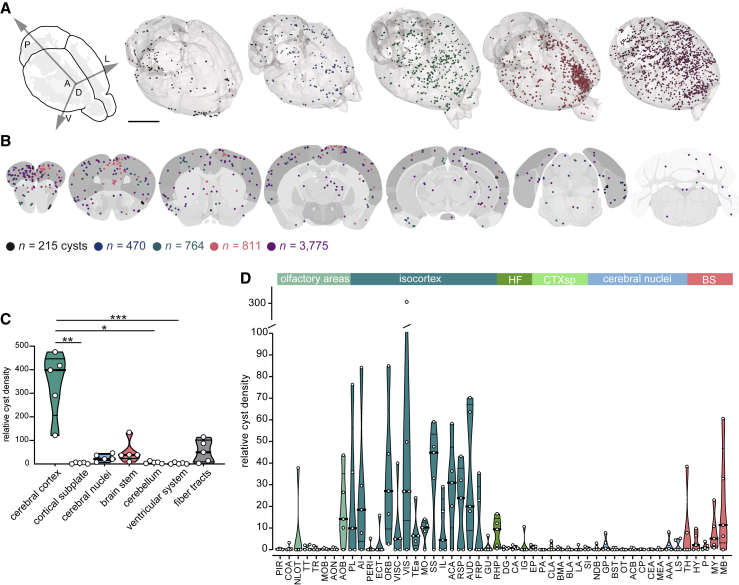
In rodents, the decrease of felid aversion induced by Toxoplasma gondii, a phenomenon termed fatal attraction, is interpreted as an adaptive manipulation by the neurotropic protozoan parasite. With the aim of understanding how the parasite induces such specific behavioral modifications, we performed a multiparametric analysis of T. gondii-induced changes on host behavior, physiology, and brain transcriptome as well as parasite cyst load and distribution. Using a set of complementary behavioral tests, we provide strong evidence that T. gondii lowers general anxiety in infected mice, increases explorative behaviors, and surprisingly alters predator aversion without selectivity toward felids. Furthermore, we show a positive correlation between the severity of the behavioral alterations and the cyst load, which indirectly reflects the level of inflammation during brain colonization. Taken together, these findings refute the myth of a selective loss of cat fear in T. gondii-infected mice and point toward widespread immune-related alterations of behaviors.

Keywords: Apicomplexa; Toxoplasma gondii; cat; chronic infection; effector molecules; host-pathogen interaction; innate behavior; light-sheet microscopy; parasites; predator avoidance.


Conflict of interest statement

The authors declare no conflict of interest.

Figures

None
Graphical abstract
Figure 1
Figure 1
T. gondii Infection Leads to Decreased Anxiety and Increased Exploration Behaviors (A and B) Quantification of behaviors of uninfected and T. gondii ME49-infected mice in the EPM (A) and in the OF (B). (C) Ethogram showing explorative behaviors (investigation of borders, rearing) and escape behavior (jumping) of a representative sample of analyzed mice in the OF. (D) Each line represents one individual. Explorative behaviors from all mice were quantified and plotted as a function of time. (E) Quantification of explorative behaviors in the holeboard test. Each dot represents one individual except for the time course graphs where mean ± SEM are represented. Exploration events comprise head dips and rearing. (F) Evaluation of short-term memory in an object recognition test. Investigation preferences are quantified during a familiarization session (two identical objects) and a test session (one familiar and one new object). (G) Time spent in each side compartment of the three-chamber arena containing a social stimulus or an object. Each individual is represented by two connected points; horizontal lines represent means. Illustrations on the bottom show example traces from an uninfected and a T. gondii-infected mouse. (H) Schematic of hand investigation test and example traces from an uninfected (black) and a T. gondii-infected mouse (red). (I) Quantification of behaviors in the hand investigation test. (J) Ethogram showing defensive and anxiety-related behaviors (burying of the hand and foraging, tail rattling, and risk assessment) and explorative behaviors (hand contact). Each line represents one individual. (K) Quantification of defensive behaviors during the hand investigation test. Uninfected, n = 7–30; infected (ME49), n = 8–37. Bars indicate mean ± SEM, and each dot represents an individual. p < 0.05, ∗∗p < 0.01, ∗∗∗p < 0.001, ∗∗∗∗p < 0.0001. For details of the statistical analyses, see Table S1. For detailed results of behavioral assays, see Table S2.
Figure 2
Figure 2
Non-specific Loss of Predator Aversion in T. gondii-Infected Mice (A) Schematic of bobcat aversion test with example traces from a mouse infected with T. gondii. (B) Quantification of behaviors during bobcat aversion test. Bobcat aversion index is the (time spent in the open compartment with bobcat odor)/(time spent in open compartment without bobcat odor). Positive values signify increased presence in open compartment when the odor is present. (C) Schematic of predator avoidance test in a 4-chamber arena containing two predator odors (fox and bobcat), a non-predator odor (guinea pig), and the odor of the mouse (home). Representative trace from a T. gondii ME49-infected mouse. (D and E) Quantification of total investigation times (D) and investigation times of each odor source (E). (F) Schematic of live predator avoidance test in a two-chamber arena with a hideaway and an exposed compartment containing an anesthetized rat. Representative traces from a T. gondii ME49-infected mouse. (G) Quantification of percentage of time spent in the exposed compartment before and after introduction of the rat. Bars indicate mean ± SEM, and each dot represents an individual. p < 0.05, ∗∗p < 0.01, ∗∗∗p < 0.001, ∗∗∗∗p < 0.0001. For details of the statistical analyses, see Table S1.
Figure 3
Figure 3
Severity of Behavioral Changes Induced by T. gondii Infection Correlates with Cyst Load (A) Schematic of a T. gondii-infected cell illustrating different components involved in protein export from parasite to host cell and in parasite virulence. Colored dots represent dense granule proteins. PVM, parasitophorous vacuole membrane. (B) Quantification of behaviors of mice infected with T. gondii parasites deficient for protein export (ASP5-KO and MYR1-KO), with lower cyst number (MyoJ-KO) or with a different apicomplexan parasite (N. caninum) in the EPM. Behavioral phenotype is compared to means of uninfected (black) and ME49-infected mice (red), which are represented by dotted lines. (C) Quantification of behaviors in the OF. (D) Quantification of investigation times in the predator avoidance assay. (E) Cyst counts from all tested individuals. Insert on top right corner shows cyst counts only from low-cyst variants. (F) Correlation of anxiety (% time spent in open arm in EPM) and cyst load. (G) Correlation of explorative behaviors (rearing + investigation) in the OF and cyst load. (H) Correlation between investigation times of different odors in the predator aversion test and cyst load. (A–D) Bars indicate mean ± SEM, and each dot represents an individual. p < 0.05, ∗∗p < 0.01, ∗∗∗p < 0.001, ∗∗∗∗p < 0.0001; pink asterisks represent significant differences compared to ME49-infected mice. Each dot represents one individual; parasite genotype is represented by the color. For details of the statistical analyses, see Table S1.
Figure 4
Figure 4
Host Brain Transcriptome Shows Sustained Immune Response in the CNS (A) 2D PCA representing the differences between individual mice analyzed by RNA-seq. The cyst load in infected mice is indicated with a color scale. Background colors show to which infection condition individuals pertain. (B) 3D PCA highlighting the differences between uninfected and infected individuals. (C) Differential expression (DE) analysis showing expression of all detectable genes. Red dots indicate upregulated genes; blue dots indicate downregulated genes (FDR < 0.05). Dashed lines indicate the threshold of a 2× fold change (FC). (D) Heatmap displaying the expression of all up- and downregulated genes (FC 2) across the 6 uninfected and the 9 T. gondii ME49-infected mice. Individuals are ordered according to cyst load. (E) Pathway enrichment analysis for up- and downregulated genes in mice infected with T. gondii ME49.
Figure 5
Figure 5
Association of Gene Expression Levels with Infection and Behavior (A) Correlations between cyst load (left panels), a behavioral score (the time spent in the home compartment during the 4-chamber predator aversion test; right panels), and relative gene expression levels representative of the up- and downregulated pathways (see also Figure S5A). Each dot represents one individual. (B) Concentration of IFN-γ and IL-12/IL-23 p40 in the plasma at 7–10 weeks p.i. of mice infected by the indicated parasite strain. Bars indicate mean ± SEM, and each dot represents an individual. ∗∗∗p < 0.001, ∗∗∗∗p < 0.0001. (C) Correlations between the concentration of IFN-γ and IL-12/IL-23 p40 in the plasma and cyst load. (D) Correlations between investigation times of different odors in the predator aversion test and the concentration of IFN-γ and IL-12/IL-23 p40 in the plasma. Each dot represents one individual; parasite strain and variant is represented by the color. For correlations, p < 0.5, ∗∗p < 0.01, ∗∗∗p < 0.001, ∗∗∗∗p < 0.0001, Spearman’s correlation. For details of the statistical analyses, see Table S1.
Figure 6
Figure 6
Cartography of T. gondii Cysts in the Mouse Brain (A) 3D rendering of CLARITY-processed brains showing colorized T. gondii ME49-GFP cysts. The size of the cysts was purposely made uniform. Scale bar, 5 mm. (B) Schematic coronal sections depicting detected T. gondii ME49-GFP cysts. One dot represents one cyst. Each depicted section holds cysts from 10 brain slices (spanning 50 μm). Numbers represent total number of detected and localized ME49-GFP cysts in the respective animals. Each individual is represented by a different color. (C) Relative cyst density (percentage of cysts in a region/volume of the region (mm3)) in different regions of the brains of mice infected with T. gondii ME49-GFP. (D) Distribution of the relative cyst density within subregions of the CNS of mice infected with T. gondii ME49-GFP. For abbreviations, see Table S5. For details on cyst counts, see Table S6. Bold bars indicate the median and thinner bars the quartiles. Each dot represents an individual.

References

    1. Afonso C., Paixão V.B., Costa R.M. Chronic Toxoplasma infection modifies the structure and the risk of host behavior. PLoS One. 2012;7:e32489. - PMC - PubMed
    1. Aliberti J., Serhan C., Sher A. Parasite-induced lipoxin A4 is an endogenous regulator of IL-12 production and immunopathology in Toxoplasma gondii infection. J. Exp. Med. 2002;196:1253–1262. - PMC - PubMed
    1. Alsaady I., Tedford E., Alsaad M., Bristow G., Kohli S., Murray M., Reeves M., Vijayabaskar M.S., Clapcote S.J., Wastling J., McConkey G.A. Downregulation of the Central Noradrenergic System by Toxoplasma gondii Infection. Infect. Immun. 2019;87:e00789-18. - PMC - PubMed
    1. Anders T., Pyl P., Huber W. HTSeq—a Python framework to work with high-throughput sequencing data. bioRxiv. 2014 - PMC - PubMed
    1. Arranz-Solís D., Aguado-Martínez A., Müller J., Regidor-Cerrillo J., Ortega-Mora L.M., Hemphill A. Dose-dependent effects of experimental infection with the virulent Neospora caninum Nc-Spain7 isolate in a pregnant mouse model. Vet. Parasitol. 2015;211:133–140. - PubMed

Publication types