. 2020 Jan 14;30(2):367-380.e7.
doi: 10.1016/j.celrep.2019.12.078.

Probiotic Bacillus subtilis Protects against α-Synuclein Aggregation in C. elegans

Affiliations

Probiotic Bacillus subtilis Protects against α-Synuclein Aggregation in C. elegans

María Eugenia Goya et al. Cell Rep. .

Abstract

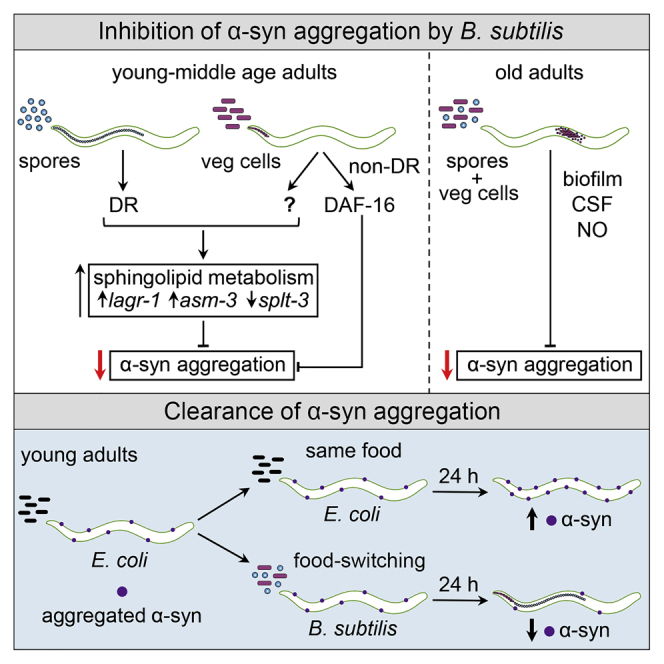
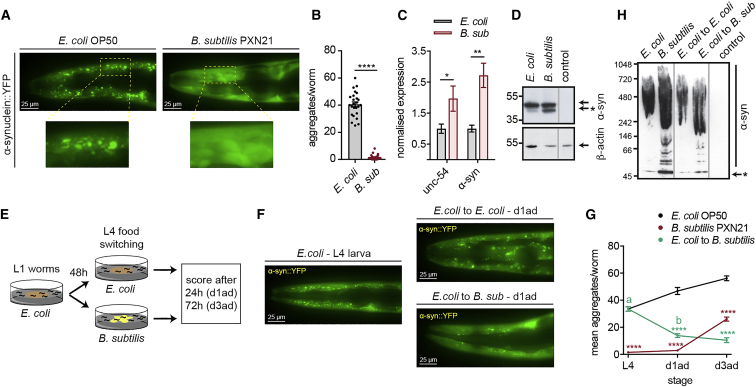
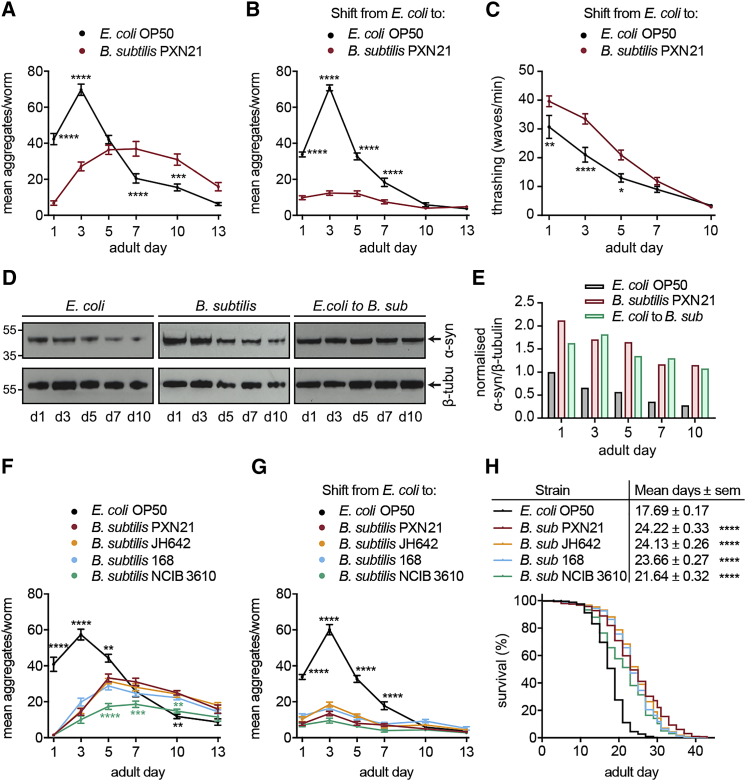
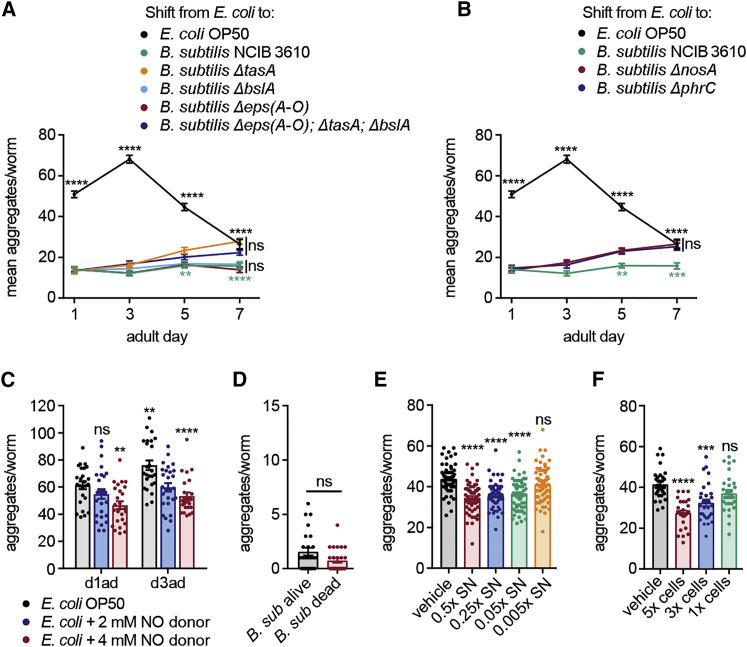
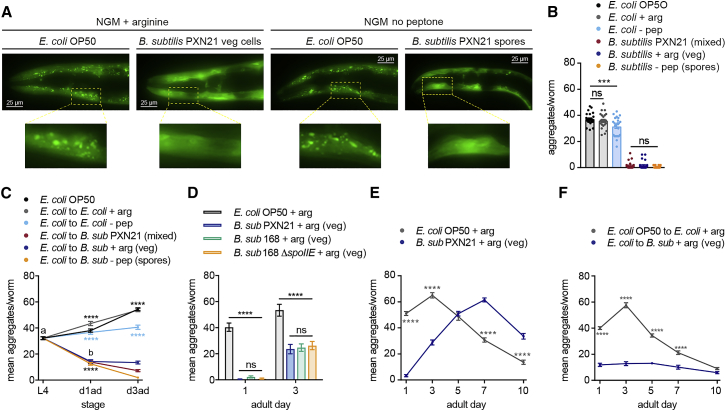
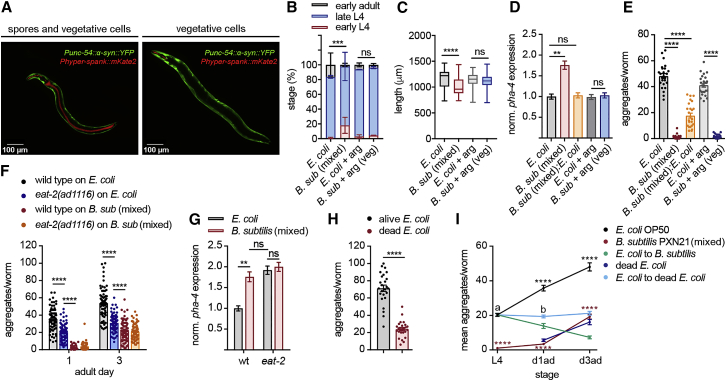
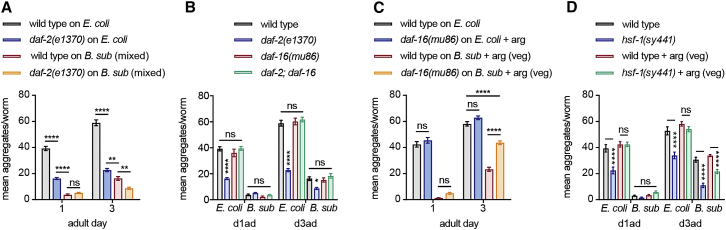
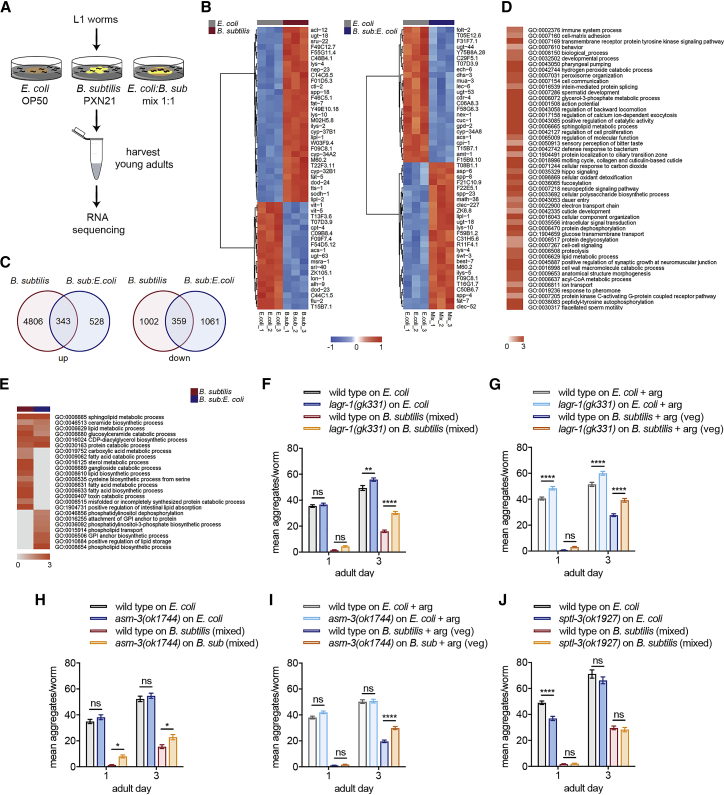
Recent discoveries have implicated the gut microbiome in the progression and severity of Parkinson's disease; however, how gut bacteria affect such neurodegenerative disorders remains unclear. Here, we report that the Bacillus subtilis probiotic strain PXN21 inhibits α-synuclein aggregation and clears preformed aggregates in an established Caenorhabditis elegans model of synucleinopathy. This protection is seen in young and aging animals and is partly mediated by DAF-16. Multiple B. subtilis strains trigger the protective effect via both spores and vegetative cells, partly due to a biofilm formation in the gut of the worms and the release of bacterial metabolites. We identify several host metabolic pathways differentially regulated in response to probiotic exposure, including sphingolipid metabolism. We further demonstrate functional roles of the sphingolipid metabolism genes lagr-1, asm-3, and sptl-3 in the anti-aggregation effect. Our findings provide a basis for exploring the disease-modifying potential of B. subtilis as a dietary supplement.

Keywords: B. subtilis; C. elegans; DAF-16/FOXO; Parkinson’s disease; biofilm; dietary restriction; microbiota; probiotics; sphingolipid metabolism; α-synuclein.


Conflict of interest statement

The authors declare no competing interests.

Figures

None
Graphical abstract
Figure 1
Figure 1
B. subtilis PXN21 Inhibits and Reverses α-Syn Aggregation in the C. elegans Model NL5901 (Punc-54::α-syn::YFP) (A) Representative fluorescent images of α-syn aggregates (foci) in the head of day 1 adult worms fed on E. coli OP50 or B. subtilis PXN21. Higher magnifications of the highlighted regions are shown. (B) Quantification of α-syn aggregates larger than 1 μm2 per animal in the head region of day 1 adult worms fed on the indicated diet. ∗∗∗∗p < 0.0001; n = 25 worms per condition. (C) Expression levels by qRT-PCR of unc-54 and α-syn transcripts in day 1 adult worms normalized to the E. coli diet. Expression level of each gene in worms fed with E. coli was taken as 1. p = 0.0245, ∗∗p = 0.0029, n = 3 per condition, with three technical replicates each (N represents a population of ∼4,000 worms). (D) SDS-PAGE of α-syn transgenic and wild-type (control column) day 1 adult worms grown on the two diets. Arrow and arrow with indicate α-syn monomeric and sub-monomeric forms, respectively. (E) Assay strategy for the food-switch experiment. L1, first larval stage; L4, fourth larval stage; d1ad, adult day 1; d3ad, adult day 3. (F) Fluorescent images of α-syn aggregates of representative L4 (left) and day 1 adult (upper right) worms grown on E. coli or 24 h after the switch to B. subtilis diet (lower right). (G) Average number of α-syn aggregates before and after the worm switching. ∗∗∗∗p < 0.0001 versus E. coli; a versus b, ∗∗∗∗p < 0.0001; n = 25 worms per time point per condition. (H) Immunoblotting of native α-syn conformations of transgenic and wild-type young adult worms. Arrow with indicates α-syn sub-monomeric form. Data shown are mean ± SEM from one representative experiment out of three with similar results.
Figure 2
Figure 2
B. subtilis Protection against α-Syn Aggregation Is Effective throughout C. elegans Aging and Is Triggered by Different Strains (A and B) Time course of α-syn aggregation in worms continuously grown on the annotated diet from larval stage L1 (A) or after food switching at the L4 (B). ∗∗∗∗p < 0.0001, ∗∗∗p = 0.0002. Data shown are mean ± SEM, n = 25 worms per time point per condition. (C and D) Immunoblotting analysis (C) and quantification (D) of α-syn versus β-tubulin levels of protein extracts from day 1 to day 10 adult worms grown on the annotated diet from the L1 (left and middle) or L4 stage (right). Data were normalized to α-syn/β-tubulin levels of day 1 adults worms fed with E. coli. (E) Locomotion analysis (thrashing rate) of worms after the food switching at L4 from E. coli to B. subtilis PXN21. p = 0.0152, ∗∗p = 0.0072, ∗∗∗∗p < 0.0001. Mean values ± SEM, n = 50 worms per condition from two independent experiments are shown (F and G). Time course of α-syn aggregation in worms continuously grown (F) or after the food switching at L4 (G) onto B. subtilis strains 168, JH642, NCIB 3610, and PXN21. Black asterisks indicate comparison with E. coli; green asterisks denote comparison of PXN21 with NCIB 3610; ∗∗∗∗p < 0.0001, ∗∗∗p < 0.001, ∗∗p < 0.01. Data shown are mean ± SEM, n = 25 worms per time point per condition. (H) Longevity of α-syn worms fed on mixed lawns of the different B. subtilis strains shown in (F). ∗∗∗∗p < 0.0001, all strains versus E. coli. n ≥ 200 worms per condition from three independent experiments. Data shown are mean ± SEM from one representative experiment out of three with similar results, unless stated otherwise.
Figure 3
Figure 3
Biofilm Formation and Active Metabolites Contribute to the B. subtilis Effect (A) Time course of α-syn aggregation of worms fed with E. coli or switched from E. coli to B. subtilis wild-isolate NCBI3610 and its isogenic-biofilm mutant derivatives: Δeps(A-O), ΔbslA, ΔtasA, and the triple mutant. Black asterisks show comparisons versus E. coli; green asterisks indicate the differences between B. subtilis NCIB 3610 and its isogenic mutants; ∗∗∗∗p < 0.0001; n ≥ 25 worms per time point per condition. (B) Time course of α-syn aggregation of worms fed with E. coli or switched from E. coli to B. subtilis wild isolate NCBI3610 or its nitric oxide (NO) and quorum-sensing peptide (CSF)-deficient mutants ΔnosA and ΔphrC, respectively.; ∗∗∗∗p < 0.0001, ∗∗p = 0.0054/0.0098, ∗∗∗p < 0.001; n ≥ 25 worms per time point per condition. (C) Quantification of α-syn aggregates of worms grown from the L1 on E. coli supplemented with vehicle (water) or NO donor MAHMA NONOate. ∗∗∗∗p < 0.0001, ∗∗p < 0. 01; n = 25 worms per time point per condition. (D) Quantification of α-syn aggregates in the head of day 1 adult worms fed with either alive or UV+antibiotic-killed B. subtilis PXN21 cells. Unpaired t test; n = 25 worms per condition. (E and F) Quantification of α-syn aggregates of day 1 adult worms grown from the L1 on E. coli supplemented with crude extracts from the supernatant (SN) (E) or pelleted cells (cells) (F) of PXN21 cultures (vehicle: ethyl acetate). ∗∗∗∗p < 0.0001, ∗∗∗p = 0.0001; SN, n = 60 worms per condition from three independent experiments; cells, n = 30 worms per condition from two independent experiments. Data shown are mean ± SEM from one representative experiment out of three with similar results, unless stated otherwise. ns, no significant differences.
Figure 4
Figure 4
B. subtilis Spores and Vegetative Cells Both Protect against α-Syn Aggregation (A) Representative fluorescent images of the head region of day 1 adult worms fed on E. coli or B. subtilis PXN21 vegetative cells or pure-spore cultures. Higher magnifications of the highlighted regions are shown. NGM, nematode regular growth media; NGM + arginine (+ arg) to inhibit sporulation; NGM no peptone, (- pep) to prevent spore germination. (B) Quantification of α-syn aggregates of day 1 adults worms fed with the different diets. ∗∗∗p < 0.001; n = 25 worms per condition. (C) Average number of α-syn aggregates of worms before and after the switching, from E. coli to B. subtilis lawn of mixed cells, vegetative cells or spores only. ∗∗∗∗p < 0.0001 indicates comparison of each diet versus its respective E. coli control; a versus b, ∗∗∗∗p < 0.0001; n = 25 worms per time point per condition. (D) Average number of α-syn aggregates of worms fed with E. coli, B. subtilis PXN21, B. subtilis 168 strain, or the sporulation mutant 168 ΔSpoIIE.∗∗∗∗p < 0.0001; n = 25 per time point per condition. (E and F) Time course of α-syn aggregation in worms grown from the L1 (E) or shifted at the L4 stage (F) to E. coli or B. subtilis vegetative cells. ∗∗∗∗p < 0.0001, n = 25 worms per time point per condition. Data shown are mean ± SEM from one representative experiment out of three with similar results, unless stated otherwise. ns, no significant differences.
Figure 5
Figure 5
B. subtilis Reduces α-Syn Aggregation through Dietary-Restriction-Dependent and Independent Mechanisms (A) Fluorescent images of α-syn worms fed on transgenic NCIB 3610 B. subtilis expressing amyE::Phyper-spank-mKate2. Spores resistant to digestion can be seen in the entire gut in red (left); vegetative cells are present only before the pharyngeal grinder (right). (B and C) Developmental stage at 48 h (B) and body size at 72 h (C) of α-syn-expressing worms grown on E. coli or B. subtilis mixed-cell lawns or vegetative cells. ∗∗∗p = 0.0007, ∗∗∗∗p < 0.0001; n ≥ 80 worms for developmental stage and n ≥ 80 worms for body length per condition from three independent experiments. (D) Normalized pha-4 expression levels by qRT-PCR in young adult worms grown on the different diet conditions. pha-4 expression level in worms fed with E. coli was taken as 1. ∗∗p = 0.0059; n = 3 samples per condition, with three technical replicates each (each sample consisting of ∼4,000 worms). (E) Quantification of α-syn aggregates in day 1 adult worms fed on E. coli, B. subtilis, or a 1:1 mixture (B. subtilis: E. coli). ∗∗∗∗p < 0.0001; n = 25 worms per condition. (F) Quantification of α-syn aggregates per animal of wild-type or eat-2(ad456) worms grown on E. coli or B. subtilis mixed-cell lawn. ∗∗∗∗p < 0.0001; n = 75 worms per time point per condition from three independent experiments. (G) Normalized pha-4 expression levels by qRT-PCR of young adult wild-type or eat-2(ad456) worms grown on the diet conditions shown in (F). ∗∗p = 0.0096, n = 3 samples per condition, with three technical replicates each (each sample consisting of ∼4,000 worms). (H) Quantification of α-syn aggregates of day 1 adult worms fed on low concentrations of freshly alive or UV-killed E. coli. ∗∗∗∗p < 0.0001, n = 25 worms per condition. (I) Average α-syn aggregates of worms before and after L4 switching to E. coli, B. subtilis mixed lawns, or UV-killed E. coli 48 h after seeding. L4, larval stage 4; d1ad, day 1 adult; d3ad, day 3 adult. ∗∗∗∗p < 0.0001 comparison versus E. coli; a versus b, ns for E. coli to UV-killed E. coli versus E. coli versus, ∗∗∗∗p < 0.0001 for E. coli to B. subtilis versus E. coli; n = 25 worms per time point per condition. Data shown are mean ± SEM from one representative experiment out of three with similar results, unless stated otherwise. ns, no significant differences.
Figure 6
Figure 6
DAF-16 Contributes to the Protection of B. subtilis in Aging (A) Quantification of α-syn aggregates in the head of wild-type or daf-2(e1370) worms grown on E. coli or B. subtilis PXN21 mixed-cell lawn. ∗∗∗∗p < 0.0001, ∗∗∗p < 0.001, ∗∗p < 0. 01; n ≥ 25 per time point per condition. (B) Average α-syn aggregates in wild-type, daf-2(e1370), daf-16(mu86), and daf-2;daf-16(mu86) double-mutant worms grown on E. coli or B. subtilis PXN21 mixed-cell lawn (spore-rich). ∗∗∗∗p < 0.0001, p = 0.0358; n ≥ 25 per time point per condition. (C) Average α-syn aggregates in wild-type and daf-2;daf-16(mu86) worms grown on E. coli or vegetative B. subtilis PXN21 lawn. ∗∗∗∗p < 0.0001; n = 25 per time point per condition. (D) Average α-syn aggregates in wild-type and hsf-1(sy441) mutant worms grown on E. coli or mixed-cell B. subtilis PXN21 lawns or vegetative-only diet (+ arg). ∗∗∗∗p < 0.0001; n = 25 per time point per condition. Data shown are mean ± SEM from one representative experiment out of three with similar results, unless stated otherwise. ns, no significant differences.
Figure 7
Figure 7
B. subtilis Protects against α-Syn Aggregation by Changing the Sphingolipid Metabolism in the Host (A) Assay strategy for the comparative transcriptomics experiment. (B) Heatmap showing the top 50 most differentially expressed genes by false discovery rate (FDR) between E. coli and B. subtilis PXN21 or E. coli and B. subtilis:E. coli mix. A fold change ≥ 1.5, p < 0.05, and FDR < 0.05 were considered for statistical significance. (C) Venn diagrams showing the overlap between the statistically significant upregulated and downregulated genes in B. subtilis PXN21 versus the mix of B. subtilis and E. coli diet. (D) Summary of the top 50 statistically significant non-redundant BP GO terms of B. subtilis PXN21 versus E. coli by log10 p value. (E) Lipid-metabolism-related BP GO terms upregulated by B. subtilis PXN21 and the mix versus E. coli diets by log10 p value. Commonly upregulated lipid GO terms (top), B. subtilis exclusive (middle), and exclusive for the mix of B. subtilis and E. coli diet (bottom) are shown. Gray indicates processes not differentially regulated. (F–J) Average α-syn aggregates of wild-type or mutant animals for sphingolipid metabolism genes: lagr-1(gk331) fed from the L1 with B. subtilis PXN21 mixed lawn diet (F) or vegetative cells (G); asm-3(ok1744) mutant animals fed from the L1 with B. subtilis PXN21 mixed lawn diet (H) or vegetative cells (I); sptl-3(ok1927) mutant animals fed from the L1 with B. subtilis PXN21 mixed lawn diet (J), compared to E. coli. ∗∗∗∗p < 0.0001, ∗∗p < 0.01, p < 0.01; ns, no significant differences. Mean values ± SEM, n = 50 worms per time point per condition from two independent experiments are shown.

References

    1. Abbott S.K., Li H., Muñoz S.S., Knoch B., Batterham M., Murphy K.E., Halliday G.M., Garner B. Altered ceramide acyl chain length and ceramide synthase gene expression in Parkinson’s disease. Mov. Disord. 2014;29:518–526. - PubMed
    1. Alafuzoff I., Hartikainen P. Alpha-synucleinopathies. Handb. Clin. Neurol. 2017;145:339–353. - PubMed
    1. Alcalay R.N., Mallett V., Vanderperre B., Tavassoly O., Dauvilliers Y., Wu R.Y.J., Ruskey J.A., Leblond C.S., Ambalavanan A., Laurent S.B. SMPD1 mutations, activity, and α-synuclein accumulation in Parkinson’s disease. Mov. Disord. 2019;34:526–535. - PMC - PubMed
    1. Alecu I., Bennett S.A.L. Dysregulated Lipid Metabolism and Its Role in α-Synucleinopathy in Parkinson’s Disease. Front. Neurosci. 2019;13:328. - PMC - PubMed
    1. Ashburner M., Ball C.A., Blake J.A., Botstein D., Butler H., Cherry J.M., Davis A.P., Dolinski K., Dwight S.S., Eppig J.T., The Gene Ontology Consortium Gene ontology: tool for the unification of biology. Nat. Genet. 2000;25:25–29. - PMC - PubMed

Publication types

Substances