. 2020 Jan 14;30(2):510-524.e6.
doi: 10.1016/j.celrep.2019.12.036.

FOXD3 Regulates VISTA Expression in Melanoma

Affiliations

FOXD3 Regulates VISTA Expression in Melanoma

Sheera R Rosenbaum et al. Cell Rep. .

Abstract

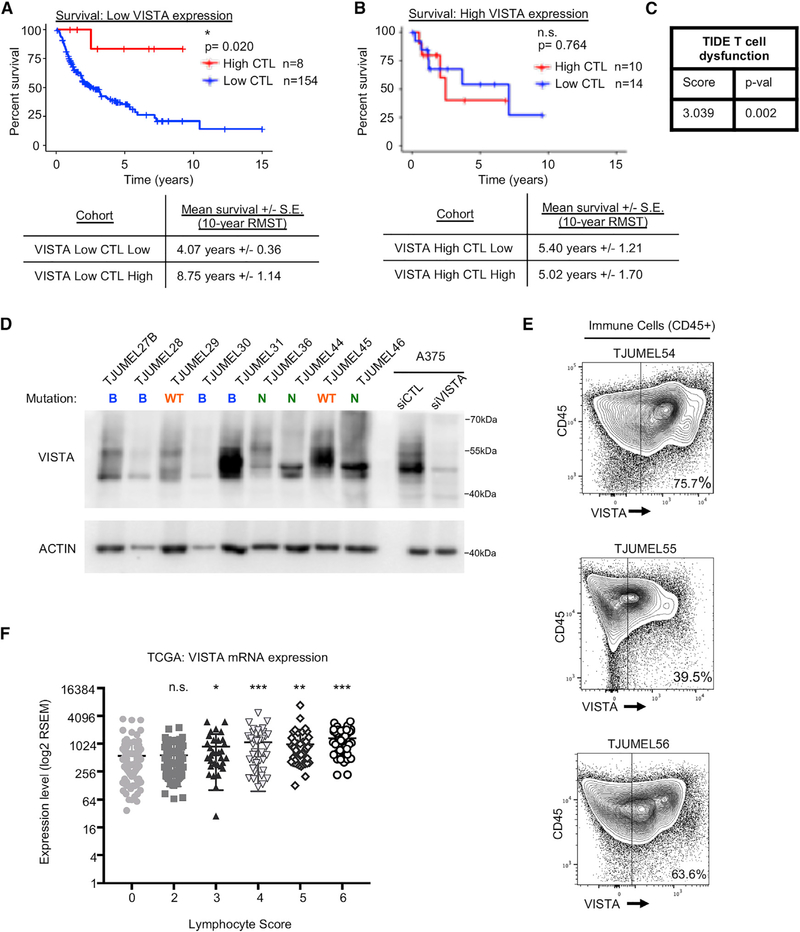
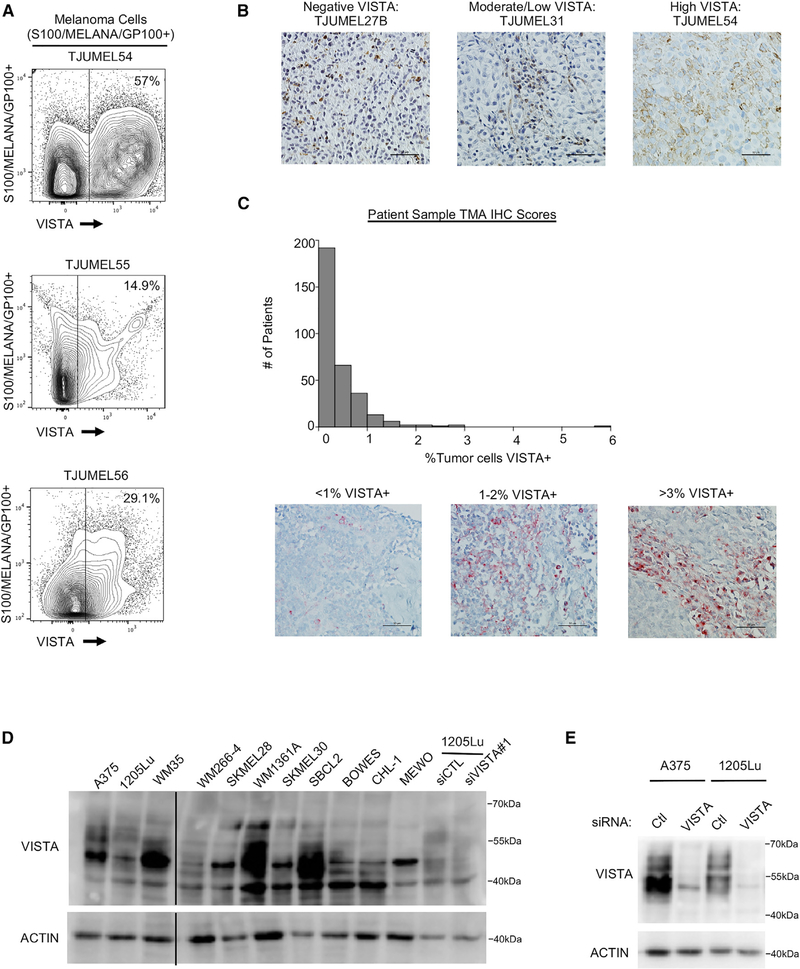
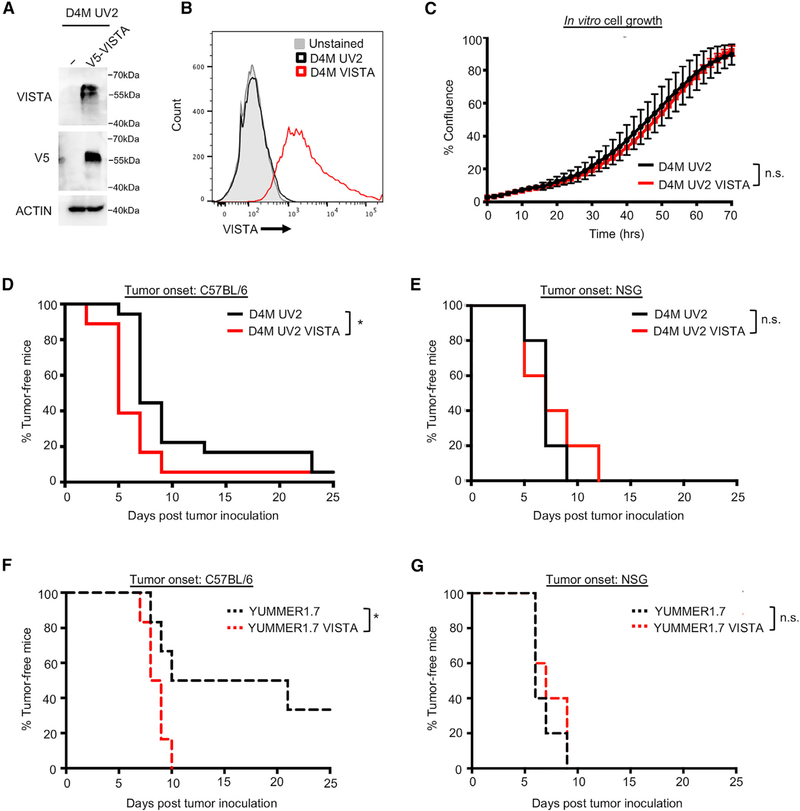
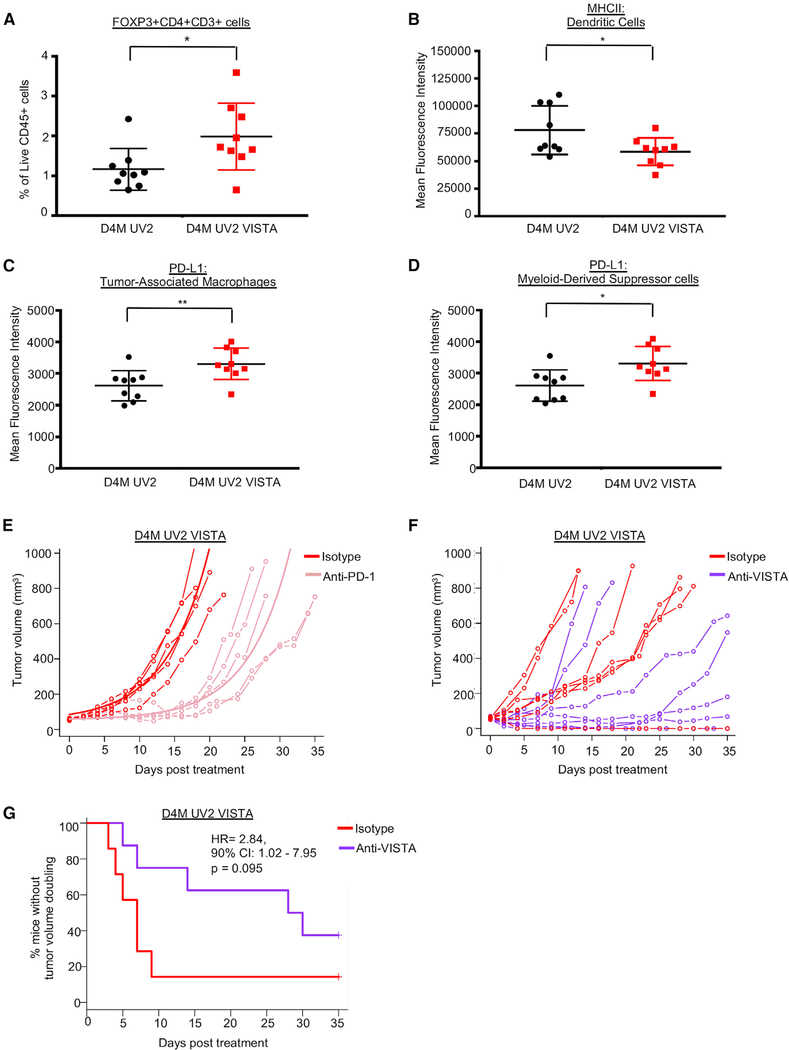
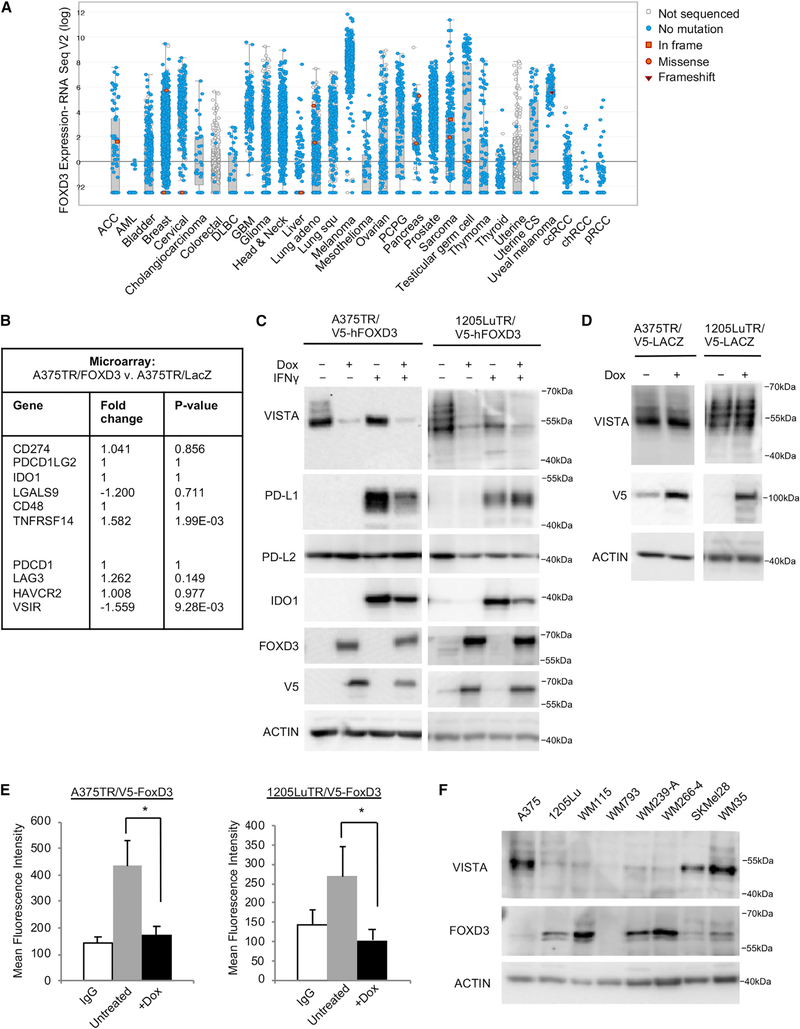
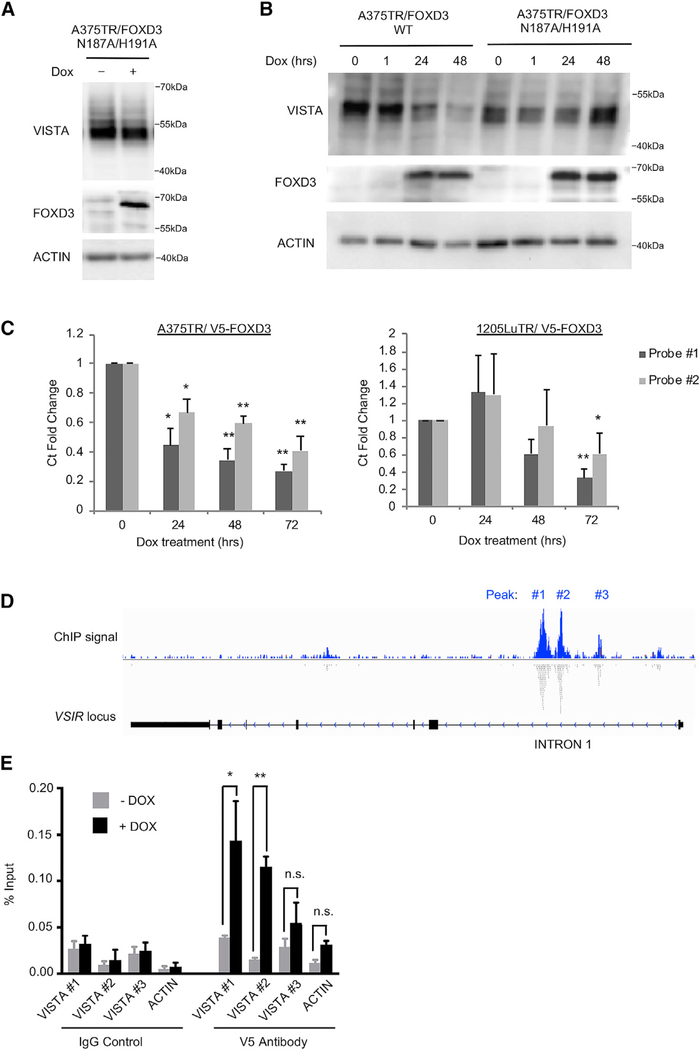
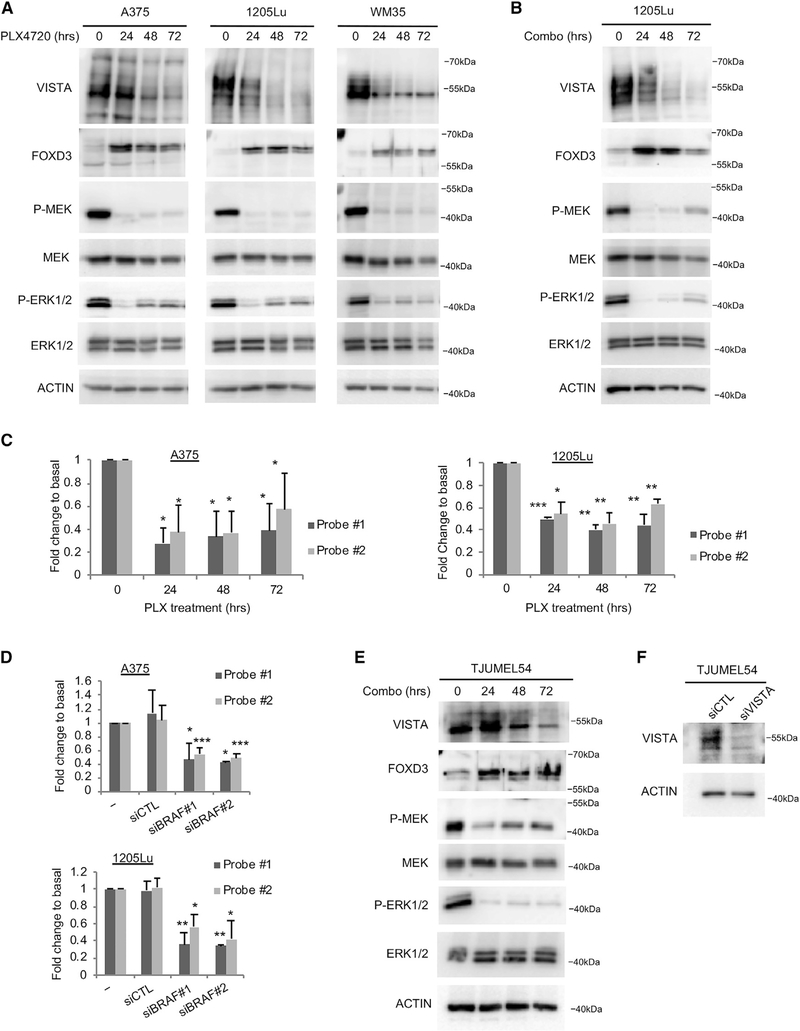
Immune checkpoint inhibitors have improved patient survival in melanoma, but the innate resistance of many patients necessitates the investigation of alternative immune targets. Many immune checkpoint proteins lack proper characterization, including V-domain Ig suppressor of T cell activation (VISTA). VISTA expression on immune cells can suppress T cell activity; however, few studies have investigated its expression and regulation in cancer cells. In this study, we observe that VISTA is expressed in melanoma patient samples and cell lines. Tumor cell-specific expression of VISTA promotes tumor onset in vivo, associated with increased intratumoral T regulatory cells, and enhanced PDL-1 expression on tumor-infiltrating macrophages. VISTA transcript levels are regulated by the stemness factor Forkhead box D3 (FOXD3). BRAF inhibition upregulates FOXD3 and reduces VISTA expression. Overall, this study demonstrates melanoma cell expression of VISTA and its regulation by FOXD3, contributing to the rationale for therapeutic strategies that combine targeted inhibitors with immune checkpoint blockade.

Keywords: DD1α; Dies1; FOXD3; PD-1H; VISTA; VSIR; immune checkpoint.


Figures

Figure 1.
Figure 1.. VISTA Is Expressed in Patient Samples and Correlates with T Cell Dysfunction
(A and B) Survival analysis was performed on TCGA’s cutaneous melanoma dataset using non-recurrent stage III patients with a regional lymph, cutaneous, or subcutaneous tumor sample (n = 186). Patients were stratified by VISTA RNA-seq expression (high = Z score > 1) and by expression-based estimation of cytotoxic lymphocyte (CTL) level (combined expression of CD8A, CD8B, GZMA, GZMB, and PRF1). Shown are Kaplan-Meier curves using overall survival times from date of biospecimen accession for patients with low versus high CTL, concurrent with (A) low or (B) high VISTA levels. The 10-year restricted mean survival times (RMSTs) were calculated for each cohort. (C) The T cell dysfunction score for VISTA was calculated in melanoma using the tumor immune dysfunction and exclusion (TIDE) computational framework. VISTA was found to be significantly synergistic with T cell dysfunction. (D) Whole pieces of human tumor samples were homogenized, lysed, and probed for VISTA expression by western blot. B, BRAF mutant; N, NRAS mutant; WT, BRAF/NRAS wild type. ACTIN was used as a loading control. (E) Patient tumor samples were stained with fluorescent antibodies for flow cytometry analysis. Cells were gated for CD45 positivity to select for immune cells, and the VISTA expression level was determined and analyzed in this subset compared to negative controls and expression in other cell subsets in the same sample. (F) Melanoma IHC samples from TCGA were previously scored for lymphocyte density and lymphocyte distribution. These two scores were summed to give an Lscore (no samples had an Lscore of 1). Samples were categorized by Lscore, and VISTA expression was analyzed in each category. Lscores > 3 demonstrate a statistically significant enhancement of VISTA expression; however, VISTA expression is still easily detectable in samples determined to have no or few immune infiltrates (Lscore = 0, 2). *p < 0.05, **p < 0.01, ***p < 0.001. See also Figure S1 and Table S1.
Figure 2.
Figure 2.. VISTA Is Expressed in Melanoma Patient Samples and Cell Lines
(A) Patient tumor samples were stained with fluorescent antibodies for flow cytometry analysis. Cells were gated for CD45 negativity, then gated for S100/MELANA/GP100 positivity to select for melanoma cells. The VISTA expression level in this subset was determined by comparing fluorescence levels to negative controls and to other cell subsets in the same sample. (B) IHC staining for VISTA was performed on melanoma patient samples. Tumor cell-specific membranous VISTA staining was judged by a pathologist, and the expression level was defined as high, 15%–65% VISTA+ tumor cells; moderate/low, 1%–14%; negative, 0%. Representative samples were imaged at 40× magnification; scale bars, 50 μm. (C) IHC staining for VISTA was performed on a tissue microarray (TMA) of melanoma patient samples. Tumor cell-specific membranous VISTA staining was scored by a pathologist, and the number of large nuclei was counted using Visiopharm software. The number of tumor-positive VISTA cells was divided by total nuclei for each sample, and the number of patients showing a range of tumor-specific VISTA expression was plotted. Representative samples were imaged at 40× magnification; scale bars, 50 μm. (D) A panel of lysates from melanoma cell lines was probed for VISTA expression by western blot. An empty lane was eliminated, denoted by the solid black line. (E) Cells were transfected with a non-targeting control siRNA or siRNA against VISTA for 72 h. Cells were lysed and protein expression was probed by western blot. See also Figures S1 and S2 and Table S1.
Figure 3.
Figure 3.. Tumor-Specific Expression of VISTA Promotes Tumor Onset
(A) The mouse melanoma cell line, D4M UV2, was engineered to express a V5-tagged VISTA, and expression was verified by western blot. (B) As for (A), except that expression was verified by flow cytometry. (C) In vitro cell growth of D4M UV2 cells expressing VISTA was evaluated using the IncuCyte live cell imager. No significant difference in cell growth was found. Data are representative of 3 independent experiments. (D) Cells were injected into C57BL/6 mice, and tumors were measured by caliper every 2–3 days. Tumors were considered fully formed when they reached ~50mm3, at which point it was considered the time of tumor onset. Data were collected from a total of 18 mice per group from 2 independent experiments. *p < 0.05. (E) Cells were injected into NSG mice and time-to-tumor onset was tracked, as in (D). Data were collected from a total of 5 mice per group. (F) YUMM1.7 cells were engineered and injected as in (A). Tumors were considered fully formed when they reached ~50 mm3. Data were collected from a total of 6 mice per group from 2 independent experiments. *p < 0.05. (G) Cells were injected into NSG mice and time-to-tumor onset was tracked, as in (F). Data were collected from a total of 5 mice per group. See also Figures S2 and S3.
Figure 4.
Figure 4.. VISTA Expression Promotes an Immunosuppressive Microenvironment, but Does Not Alter Response to PD-1
(A) Tumors were analyzed for tumor-infiltrating lymphocytes 7 days after injection. The presence of FOXP3+CD4+CD3+ T regulatory cells was determined by flow cytometry as a percentage of cells gated as Live and CD45+. Data were collected from 9 mice per group, combined from 2 independent experiments. *p < 0.05. (B) As in (A), dendritic cells (gated as Live F4/80CD11c+MHCNhiCD3CD45+) were analyzed for MHC II levels by flow cytometry, and mean fluorescence intensity (MFI) was quantified. *p < 0.05. (C) As in (A), tumor-associated macrophages (TAMs) (gated as Live CD11b+F4/80+CD3CD45+) were analyzed for PD-L1 positivity. MFI of PD-L1+ cells was quantified in the TAM immune cell population. **p < 0.01. (D) As in (A), myeloid-derived suppressor cells (MDSCs) (gated as Live CD11b+GR-1+CD3CD45+) were analyzed for PD-L1 positivity. MFI of PD-L1+ cells was quantified in the MDSC immune cell population. *p < 0.05. (E) D4M UV2 VISTA cells were injected into C57BL/6 mice. When tumors reached ~50 mm3, animals were treated with either anti-PD-1 antibody or the corresponding isotype control (rat IgG2a) every 2–3 days. Data were collected from 5 mice treated with isotype and 6 mice treated with anti-PD-1. One animal in the anti-PD-1 treatment group with zero tumor volume was excluded from the statistical analyses of tumor growth curves. For the remaining animals, the fitted group average tumor growth curves are depicted by a bold line. Anti-PD-1 treatment delayed tumor growth on average by 12.2 days (95% CI 6.5–17.8, p = 0.001) as compared to the control group. (F) D4M UV2 VISTA cells were injected into C57BL/6 mice. When tumors reached ~50 mm3, animals were treated with either anti-VISTA antibody or the corresponding isotype control (hamster polyclonal IgG) every 2–3 days. Data were collected from 7 mice treated with isotype and 8 mice treated with anti-VISTA. (G) The time to doubling was defined as the first observation day when the tumor volume exceeded twice the volume at day 0. Animals with tumor volumes that did not double at any time were censored on the last day of observation. The time to doubling was analyzed using the Kaplan-Meier estimator of the survival curves and Cox proportional hazards model. See also Figures S4 and S5.
Figure 5.
Figure 5.. FOXD3 Is Highly Expressed in Melanoma and Represses VISTA Expression
(A) RNA-seq data from TCGA was analyzed for FOXD3 expression across all of the cancer studies. (B) Microarray data were reevaluated for FOXD3 regulation of immune checkpoint proteins. (C) Expression of a V5-tagged FOXD3 was induced by treatment with doxycycline (100 ng/mL). After 48 h, doxycycline was refreshed and IFNγ (100 ng/mL) was added to select wells for an additional 48 h. Cells were lysed and protein expression was probed by western blot. Data are representative of 3 independent experiments. (D) Expression of a V5-tagged LacZ control was induced by treatment with doxycycline for 96 h. Cells were lysed and protein expression was probed by western blot. Data are representative of 3 independent experiments. (E) FOXD3 expression was induced by treatment with doxycycline for 96 h, and the cell surface levels of VISTA were analyzed by flow cytometry. Shown is the MFI. Data are representative of 3 independent experiments. *p < 0.05. (F) A panel of lysates from various melanoma cell lines was probed for the expression of endogenous levels of VISTA and FOXD3 by western blot. See also Figure S6.
Figure 6.
Figure 6.. FOXD3 Regulates Transcription of VISTA mRNA
(A) A375 cells were treated with doxycycline for 96 h to induce the overexpression of a DNA-binding mutant FOXD3. VISTA and FOXD3 levels were detected by western blot. Data are representative of 3 independent experiments. (B) A375 cells were treated with doxycycline for various lengths of time to induce the expression of either WT or DNA-binding mutant FOXD3. (C) Cells were treated with doxycycline for varying lengths of time to induce FOXD3 expression. RNA was isolated and qPCR was performed using 2 different Taqman assay probes for VISTA mRNA. Data are representative of 3 independent experiments. *p < 0.05, **p < 0.01. (D) ChIP-seq data of V5-FOXD3 were mined for FOXD3 binding peaks. Shown is a map of the locus for the VISTA gene VSIR and aligned reads. Data were visualized in the Integrated Genomics Viewer. (E) FOXD3 binding at identified peaks was verified by ChIP. A375TR/V5-FOXD3 cells were treated with doxycycline for 48 h to induce V5-FOXD3 expression. V5 antibody was used to pull down FOXD3 protein, and specific primers (Table S2) were used to probe binding at each peak (labeled in 5D) by qRT-PCR. Data are representative of 3 independent experiments. *p < 0.05, **p < 0.01. See also Figure S7 and Table S2.
Figure 7.
Figure 7.. BRAF Inhibition Suppresses VISTA Expression
(A) Cells were treated with the BRAF inhibitor PLX4720 (1 μM) for the indicated lengths of time. Cell lysates were analyzed by western blot. Shown is a representative set of blots from 3 independent experiments. (B) Cells were treated with a combination of the BRAF inhibitor PLX4720 (1 μM) and the MEK inhibitor PD0325901 (35 nM) for the indicated lengths of time. Cell lysates were analyzed by western blot. Shown is a representative set of blots from 3 independent experiments. (C) Cells were treated as in (A) and RNA was isolated. qPCR was performed using 2 independent Taqman probes for VISTA mRNA. Data are representative of 3 independent experiments. *p < 0.05, **p < 0.01, ***p < 0.001. (D) Cells were transfected with siRNAs for 72 h, and then RNA was isolated. qPCR was performed using 2 independent Taqman probes for VISTA mRNA. Data are representative of 3 independent experiments. *p < 0.05, **p < 0.01, ***p < 0.001. (E) A short-term culture of a human melanoma patient sample was treated with a combination of 1 μM PLX4720 and 35 nM of the MEK inhibitor PD0325901 for varying lengths of time. Lysates were probed by western blot. (F) A short-term culture, as in (D), was transfected with siRNA against VISTA or a non-targeting control for 72 h. Lysates were probed by western blot.

References

    1. Abel EV, and Aplin AE (2010). FOXD3 is a mutant B-RAF-regulated inhibitor of G(1)-S progression in melanoma cells. Cancer Res. 70, 2891–2900. - PMC - PubMed
    1. Abel EV, Basile KJ, Kugel CH 3rd, Witkiewicz AK, Le K, Amaravadi RK, Karakousis GC, Xu X, Xu W, Schuchter LM, et al. (2013). Melanoma adapts to RAF/MEK inhibitors through FOXD3-mediated upregulation of ERBB3. J. Clin. Invest 123, 2155–2168. - PMC - PubMed
    1. Aloia L, Parisi S, Fusco L, Pastore L, and Russo T (2010). Differentiation of embryonic stem cells 1 (Dies1) is a component of bone morphogenetic protein 4 (BMP4) signaling pathway required for proper differentiation of mouse embryonic stem cells. J. Biol. Chem 285, 7776–7783. - PMC - PubMed
    1. Bollag G, Hirth P, Tsai J, Zhang J, Ibrahim PN, Cho H, Spevak W, Zhang C, Zhang Y, Habets G, et al. (2010). Clinical efficacy of a RAF inhibitor needs broad target blockade in BRAF-mutant melanoma. Nature 467, 596–599. - PMC - PubMed
    1. Broad Institute TCGA Genome Data Analysis Center (2016). Broad GDAC Firehose 2016_01_28 run (Broad Institute of MIT and Harvard; ). 10.7908/C11G0KM9. - DOI

Publication types

MeSH terms