Case Reports
. 2020 Jan 14;30(2):525-540.e7.
doi: 10.1016/j.celrep.2019.12.034.

Mouse Ovarian Cancer Models Recapitulate the Human Tumor Microenvironment and Patient Response to Treatment

Affiliations
Case Reports

Mouse Ovarian Cancer Models Recapitulate the Human Tumor Microenvironment and Patient Response to Treatment

Eleni Maniati et al. Cell Rep. .

Abstract

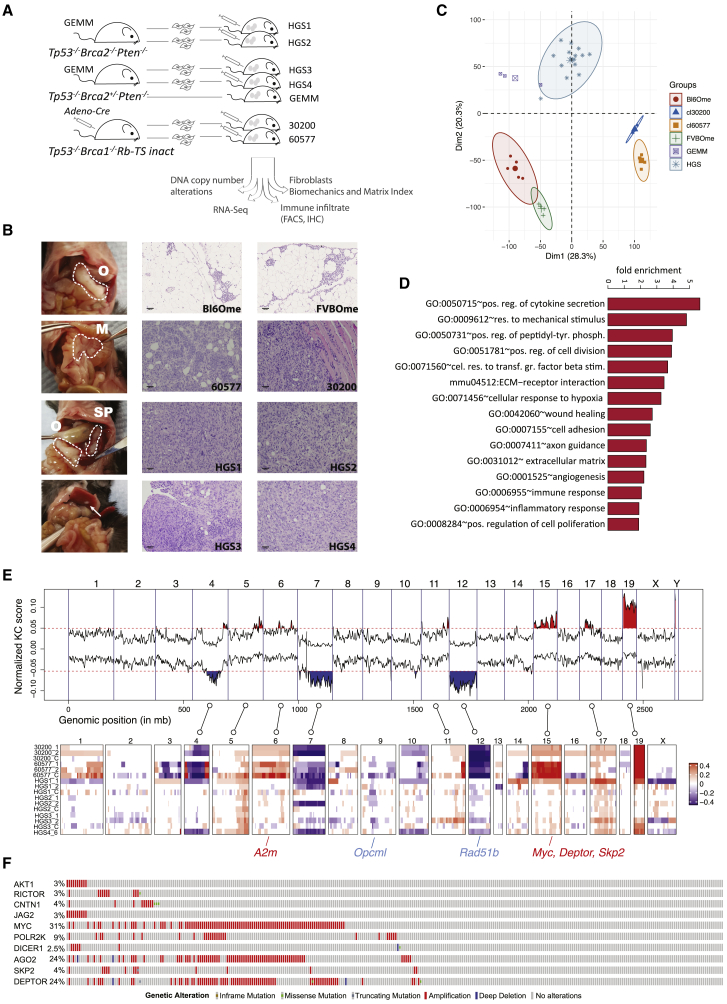
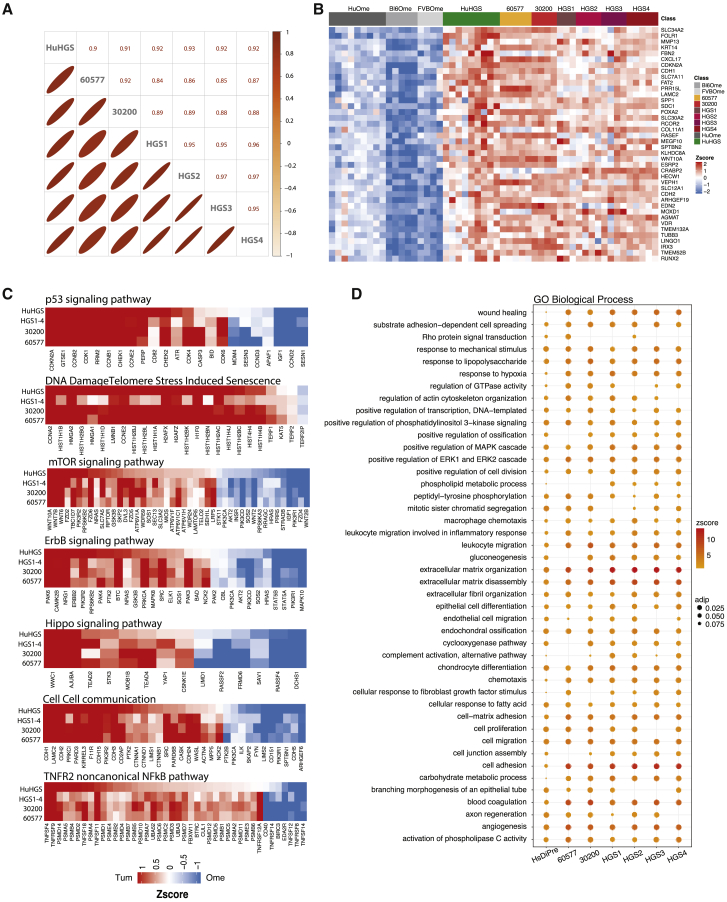
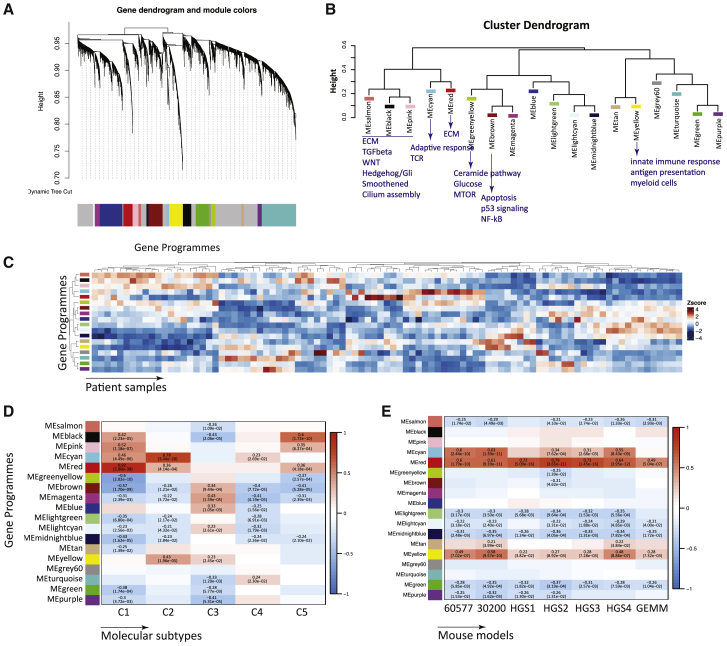
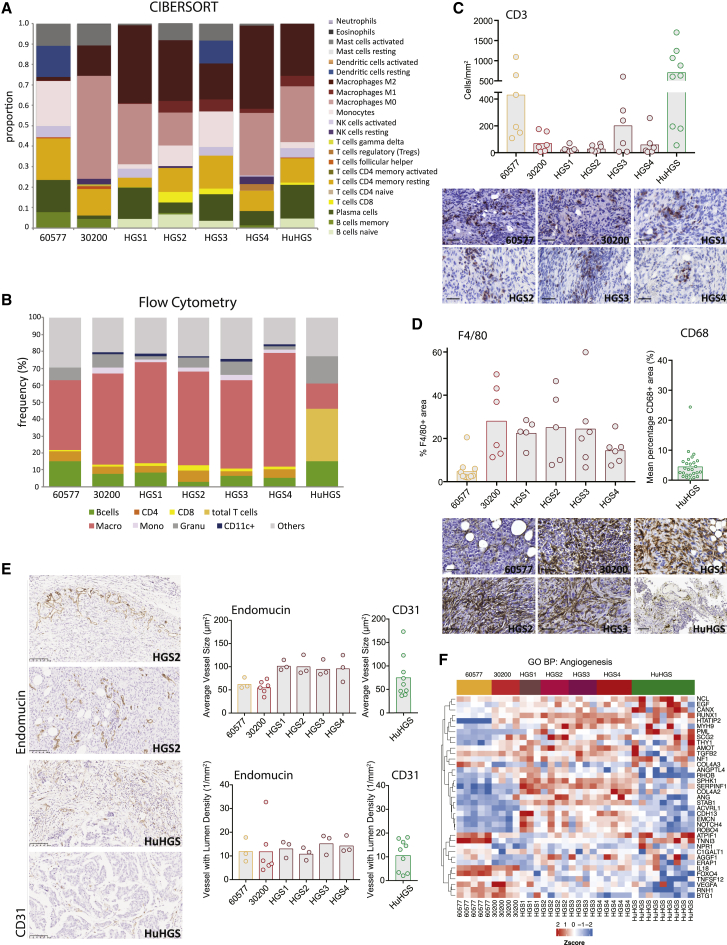
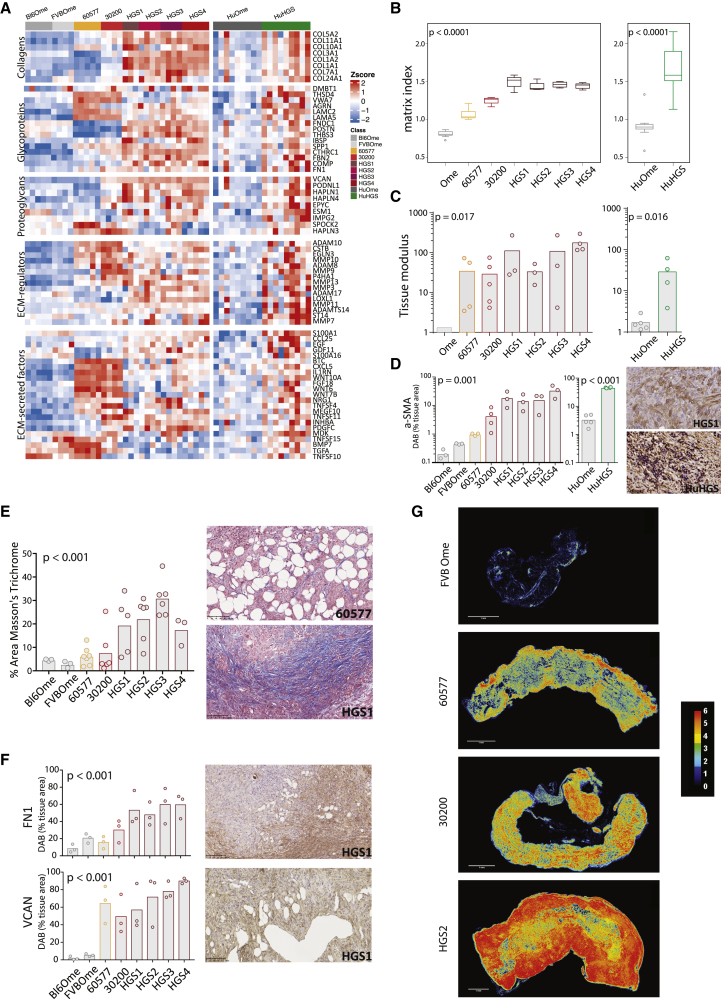
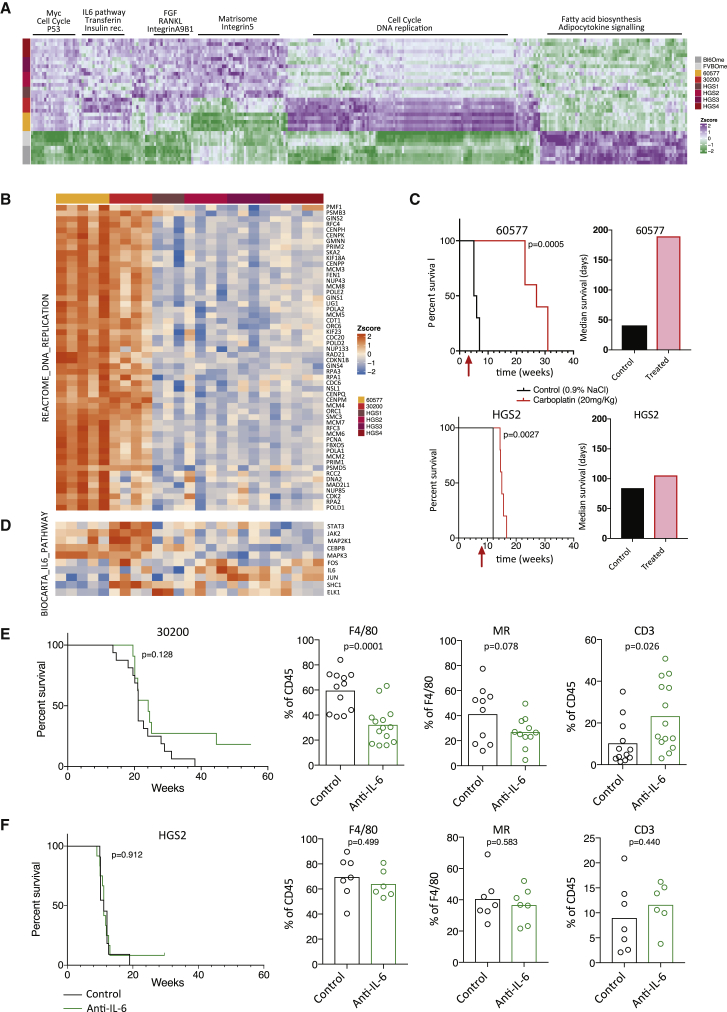
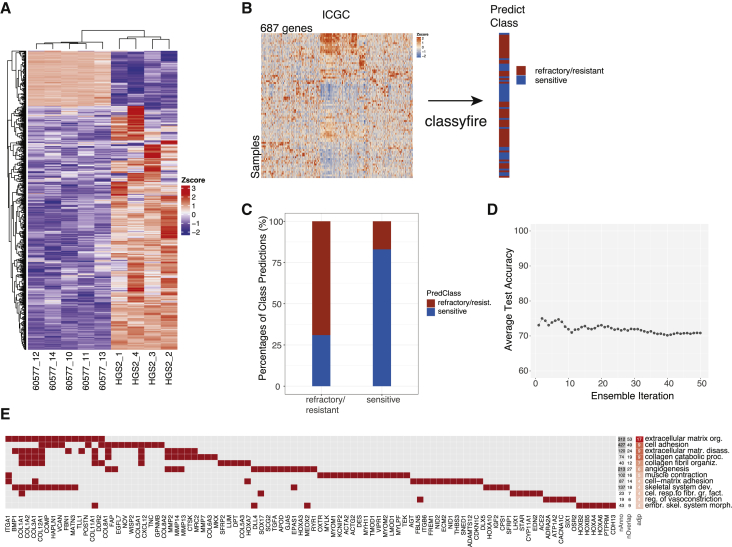
Although there are many prospective targets in the tumor microenvironment (TME) of high-grade serous ovarian cancer (HGSOC), pre-clinical testing is challenging, especially as there is limited information on the murine TME. Here, we characterize the TME of six orthotopic, transplantable syngeneic murine HGSOC lines established from genetic models and compare these to patient biopsies. We identify significant correlations between the transcriptome, host cell infiltrates, matrisome, vasculature, and tissue modulus of mouse and human TMEs, with several stromal and malignant targets in common. However, each model shows distinct differences and potential vulnerabilities that enabled us to test predictions about response to chemotherapy and an anti-IL-6 antibody. Using machine learning, the transcriptional profiles of the mouse tumors that differed in chemotherapy response are able to classify chemotherapy-sensitive and -refractory patient tumors. These models provide useful pre-clinical tools and may help identify subgroups of HGSOC patients who are most likely to respond to specific therapies.

Keywords: matrisome; mouse model; ovarian cancer; serous; tumor microenvironment.


Conflict of interest statement

O.J.S. is supported by AstraZeneca, Novartis, and Cancer Research Technology. R.D. serves on the scientific advisory board of Repare Therapeutics and Siamab Therapeutics. F.R.B. serves on the scientific advisory board of Verseau Therapeutics. The authors declare no other competing interests.

Figures

None
Graphical abstract
Figure 1
Figure 1
Characterization of Murine HGSOC Models (A) Overview of murine models and the analyses conducted. (B) Left panel: gross anatomy of the tumor distribution in the peritoneal cavity of a mouse injected with the HGS2 cell line and culled at a humane endpoint. Omental (O), mesenteric (M), and splenoportal (SP) tumor deposits are highlighted with a dashed line. A metastasis to the liver surface is indicated by an arrow. Center and right panels: tissue sections were derived from normal omenta (Bl6Ome and FVBOme) and mouse model tumors (60577, 30200, HGS1, HGS2, HGS3, and GEMM) and stained with hematoxylin and eosin (scale bars, 100 μm). (C) Unsupervised clustering of RNA-seq sample groups by principal-component analysis. (D) Significantly enriched Gene Ontology (GO) terms and pathways (p < 0.001) in the common 1,292 differentially expressed genes. (E) Genomic alterations found in murine HGSOC. Copy number losses and gains are shown in blue and red, respectively. Key orthologous genes, frequently altered in human HGSOC, are indicated with blue for losses and red for gains. (F) OncoPrint showing genes with high mutation frequency in TCGA and present in CNA regions in mouse models.
Figure 2
Figure 2
Comparison of Murine HGSOC and Human Omental Metastasis Transcriptomes (A) Upper triangle: Pearson correlation coefficients based on the average expression (reads per kilobase million [RPKM]) of 12,127 orthologous genes in pairwise alignments of human omental tumors and mouse model tumors. Lower triangle: the diameter of the ellipses is proportional to the correlation coefficient; thinner ellipses correspond to higher correlation coefficients. (B) Top concordantly upregulated genes in murine HGSOC and human omental tumors (FDR < 0.05). (C and D) Key signaling pathways (C) identified by pathway analysis through Gaussian graphical models (clipper, pathway threshold p < 0.05), concordant in human and all mouse model tumors and biological processes (D) and significantly altered in both murine and human HGSOC (hypergeometric test p < 0.05). Cycle diameter proportional to adjusted p value; color corresponds to pathway Z score. (A–D) 30200, HGS2, and HGS3, n = 4; 60577 and HGS4, n = 5; HGS1, n = 3; FVBOme, n = 4; Bl6Ome, n = 5. For human samples, n = 9 normal/adjacent omenta and n = 9 omental tumors.
Figure 3
Figure 3
Comparison of Murine HGSOC and ICGC Ovarian Transcriptomes (A) Weighted correlation network analysis (WCNA) of human ICGC transcriptional HGSOC dataset showing clusters of co-regulated genes as a dendrogram. Colors show different modules (gene programs). (B) Cluster dendrogram of module eigenvalues (MEs) illustrates clustering of programs associated with ECM, immune response, or tumor-related signaling pathways. (C) Heatmap of MEs across ICGC samples (n = 93). (D) Heatmap of association of C1–C5 classification. Positive associations are shown in red and negative associations are shown in blue. Pearson’s r and p values are indicated in the fields where a significant association was observed (p < 0.05). (E) Heatmap of association of differentially expressed gene scores in mouse models. Positive associations are shown in red and negative associations are shown in blue. Pearson’s r and p values are indicated in the fields where a significant association was observed (p < 0.05).
Figure 4
Figure 4
Immune Cells and Vasculature of the Murine and Human HGSOC (A) Proportions of immune cell populations estimated from murine tumors and human omental metastases using CIBERSORT. 30200, HGS2, and HGS3, n = 4; 60577 and HGS4, n = 5; HGS1, n = 3; human omental tumors, n = 9. Median values are depicted. (B) Flow cytometric analysis of the immune infiltrate of peritoneal tumors, close to endpoint, from mice injected with 60577, 30200, or HGS cell lines. B cells: CD45+ CD19+, CD4 cells: CD45+ CD3+ CD4+, CD8 cells: CD45+ CD3+ CD8+, monocytes: CD45+ CD11b+ Ly6C+, macrophages: CD45+, CD11b+ F4/80+ (Ly6C/G), granulocytes: CD45+ CD11b+ Ly6G+, CD11c+ cells: CD45+ CD11b+ CD11c+ (F4/80 Ly6C/G). A similar analysis of the immune infiltrate in the diseased omentum from patients who underwent upfront surgery is shown for comparison (HuHGS). (C) Quantification of the number of CD3+ cells/mm2 by IHC on peritoneal tumors from mice injected with 60577, 30200, or HGS cell lines. Quantification of CD3+ cells in biopsies from patients (HuHGS) is shown for comparison. Representative images are shown; scale bars set to 100 μm. (D) Quantification of the percentage of an area positive for F4/80 by IHC on peritoneal tumors from mice injected with 60577, 30200, or HGS cell lines. Quantification of CD68+ area in patient biopsies is included for comparison. Representative images are shown; scale bars set to 100 μm. (E) IHC for endomucin (mouse) and CD31 (human) staining, quantified using the Definiens Tissue Studio platform with the blood vessel detection feature. Each dot represents a tumor from an individual mouse or human. Representative images for HGS2 and HuHGS are depicted at left. Scale bars, 100 μm. (F) Heatmap illustrating Gene Ontology biological process angiogenesis gene expression across mouse models and human omental tumors.
Figure 5
Figure 5
Matrisome, Matrix Index, and Stiffness of Murine and Human HGSOC (A) Heatmap of orthologous matrisome genes, grouped by matrisome class, in the mouse and human peritoneal datasets compared to normal omenta (Student’s t test, p < 0.05). (B) Matrix Index of murine and human peritoneal HGSOC and normal omenta. 30200, HGS2 and HGS3, n = 4; 60577 and HGS4, n = 5; HGS1 n = 3; FVBOme n = 4; Bl6Ome n = 5. For human samples, n = 9 normal/adjacent omenta and n = 9 omental tumors. (C) Tissue modulus of murine and human peritoneal HGSOC and normal omenta. Each dot represents a tumor from an individual mouse or patient. p values correspond to the Kruskal-Wallis test for mouse data and the Mann-Whitney U test for human data. (D) Fibroblast content of murine and human peritoneal HGSOC and normal omenta was assessed by IHC for αSMA staining and quantified using the Definiens Tissue Studio platform. p values correspond to one-way ANOVA. Each dot represents a tumor from an individual mouse. A representative image for HGS1 is depicted at right. Scale bar, 50 μm. (E) Masson’s trichrome staining was performed on all HGSOC model tumors and on normal omenta. Bar plot illustrates the result of digital analysis and the quantification of the percentage of positive area by the Definiens Tissue Studio. Representative images for 60577 and HGS1 are depicted at right. Scale bars, 100 μm. p values correspond to one-way ANOVA. Each dot represents a tumor from an individual mouse. (F) IHC for FN1 and VCAN staining quantified using the Definiens Tissue Studio platform. p values correspond to one-way ANOVA. Each dot represents a tumor from an individual mouse. Representative images for HGS1 are depicted at right. Scale bars, 100 μm. (G) Construction of tissue matrisome heatmaps for models of HGSOC. Serial IHC images were color deconvoluted, overlaid, and pseudo-colored using ImageJ to highlight areas that were rich (red) or poor (black) in ECM. Expression hotspots for all six ECM molecules are shown in red, whereas areas expressing one to five ECM molecules are presented with the different colors on the key map shown at right. Scale bars, 1 mm.
Figure 6
Figure 6
Therapeutic Vulnerabilities of HGSOC Models (A) Single-sample gene set enrichment analysis (GSEA) was performed for the murine HGSOC transcriptomes. Heatmap illustrates pathway scores with distinct expression patterns in 30200, 60577, HGS tumors, and normal omenta (FDR < 0.05). 30200, HGS2, and HGS3, n = 4; 60577 and HGS4, n = 5; HGS1, n = 3; FVBOme, n = 4; Bl6Ome, n = 5. (B) Heatmap of REACTOME DNA replication pathway genes across the murine tumors. (C) Response of mice injected with 60577 or HGS2 to three cycles of chemotherapy (carboplatin 20 mg/kg, once per week). Survival curve and median survival are shown (n = 5 mice per group). The log rank p value is depicted on the survival curves. The start of the treatment is indicated by the red arrow. (D) Heatmap of BIOCARTA IL-6 pathway genes across the murine tumors. (E and F) Mice injected with 30200 (E) or HGS2 (F) were treated with isotype control or anti-IL-6 i.p. 2 mg/kg twice weekly starting 10 (30200) or 7 (HGS2) weeks after cell injection until endpoint. The log rank p value is depicted on the survival curves (for 30200, ncontrol = 16 and ntreated = 11; for HGS2, ncontrol = 11 and ntreated = 12). Analysis of the immune infiltrate was performed by flow cytometry on a different set of mice and Student’s t test value is depicted on the bar plots. Each dot represents a tumor from an individual mouse. For 30200, two experiments pooled together are shown.
Figure 7
Figure 7
Multivariate Classification of Patient Response Based on Mouse Model Data (A) Heatmap of 687 differentially expressed genes in 60577 (n = 5) versus HGS2 (n = 4) tumors (FDR < 0.0001, log fold change (FC) > |3|). (B) Schematic of multivariate classification implemented with R package classyfire on ICGC data, using the 687 genes for the prediction of chemotherapy response. The 80 primary tumor samples of the ICGC dataset were used in this analysis. (C) Bar plot illustrating the result of the classification ensemble accuracy on predicting class membership of previously unseen samples. (D) Average test accuracy in relation to the number of support vector machine (SVM) ensembles used. (E) Heatmap of the top GO biological processes enriched in the 687 genes (adjusted p < 0.05). adjp (adjusted p value), −log10; nAnno, number of genes in the gene set; nOverlap, number of overlapping genes between gene set and 687 gene list. Red squares denote genes in the top enriched GO processes. A maximum of 15 overlapping genes are shown for GO processes with nOverlap >15.

References

    1. Ahmed A.A., Etemadmoghadam D., Temple J., Lynch A.G., Riad M., Sharma R., Stewart C., Fereday S., Caldas C., Defazio A. Driver mutations in TP53 are ubiquitous in high grade serous carcinoma of the ovary. J. Pathol. 2010;221:49–56. - PMC - PubMed
    1. Anders S., Pyl P.T., Huber W. HTSeq--a Python framework to work with high-throughput sequencing data. Bioinformatics. 2015;31:166–169. - PMC - PubMed
    1. Bailey P., Chang D.K., Nones K., Johns A.L., Patch A.M., Gingras M.C., Miller D.K., Christ A.N., Bruxner T.J., Quinn M.C., Australian Pancreatic Cancer Genome Initiative Genomic analyses identify molecular subtypes of pancreatic cancer. Nature. 2016;531:47–52. - PubMed
    1. Bergamini A., Ferrero S., Leone Roberti Maggiore U., Scala C., Pella F., Vellone V.G., Petrone M., Rabaiotti E., Cioffi R., Candiani M., Mangili G. Folate receptor alpha antagonists in preclinical and early stage clinical development for the treatment of epithelial ovarian cancer. Expert Opin. Investig. Drugs. 2016;25:1405–1412. - PubMed
    1. Binnewies M., Roberts E.W., Kersten K., Chan V., Fearon D.F., Merad M., Coussens L.M., Gabrilovich D.I., Ostrand-Rosenberg S., Hedrick C.C. Understanding the tumor immune microenvironment (TIME) for effective therapy. Nat. Med. 2018;24:541–550. - PMC - PubMed

Publication types