

Tivantinib, A c-Met Inhibitor in Clinical Trials, Is Susceptible to ABCG2-Mediated Drug Resistance
- PMID: 31940916
- PMCID: PMC7017082
- DOI: 10.3390/cancers12010186
Tivantinib, A c-Met Inhibitor in Clinical Trials, Is Susceptible to ABCG2-Mediated Drug Resistance
Abstract
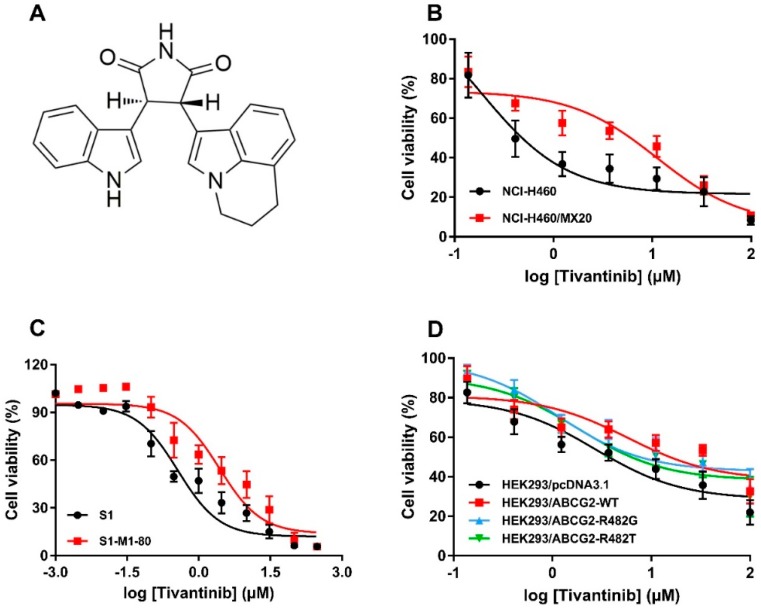
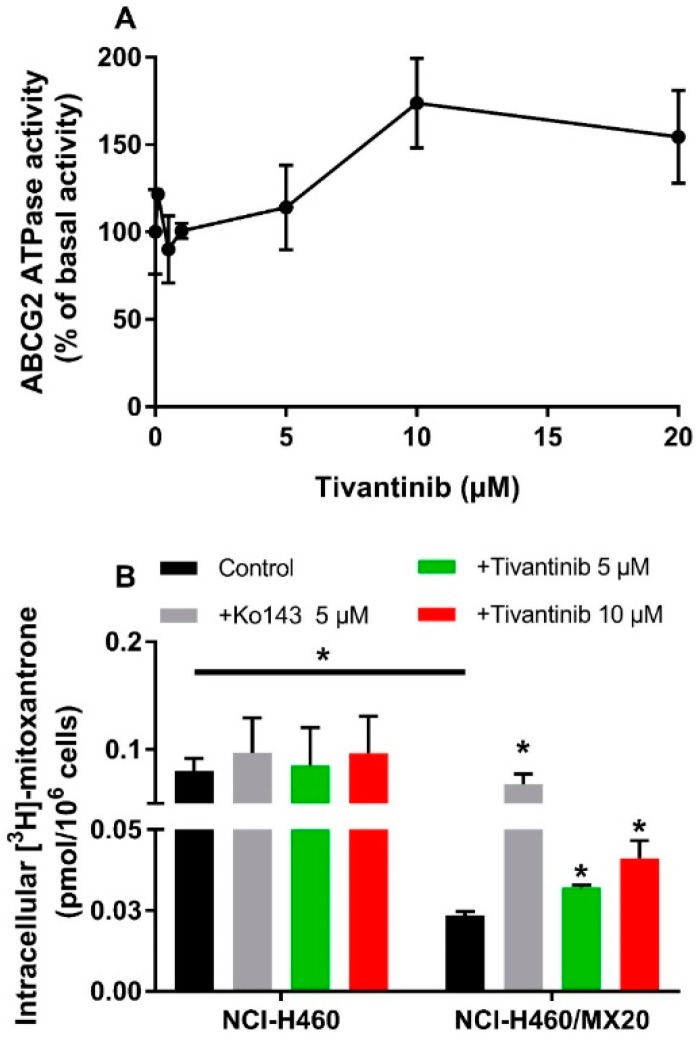
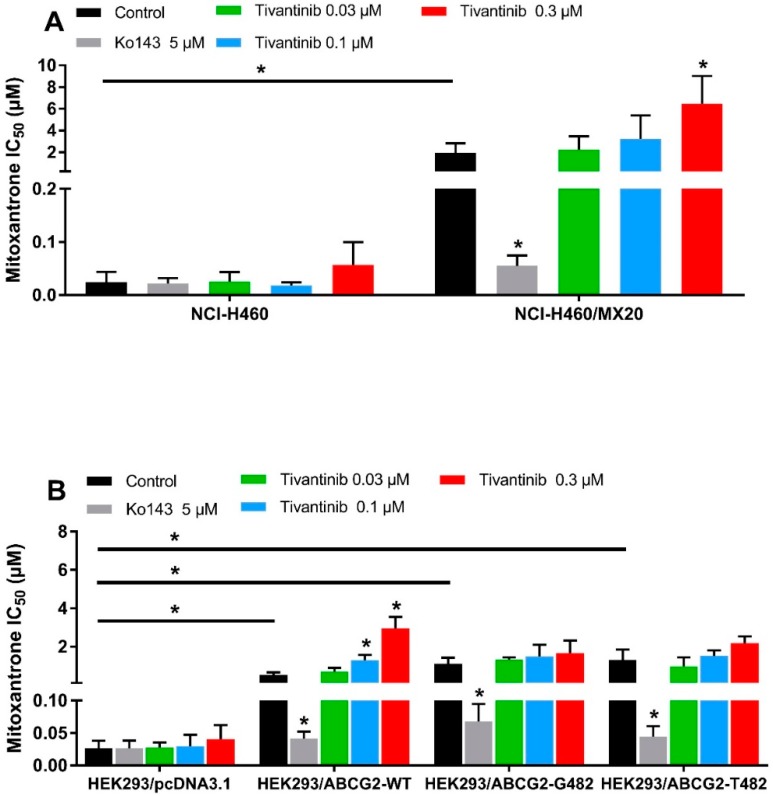
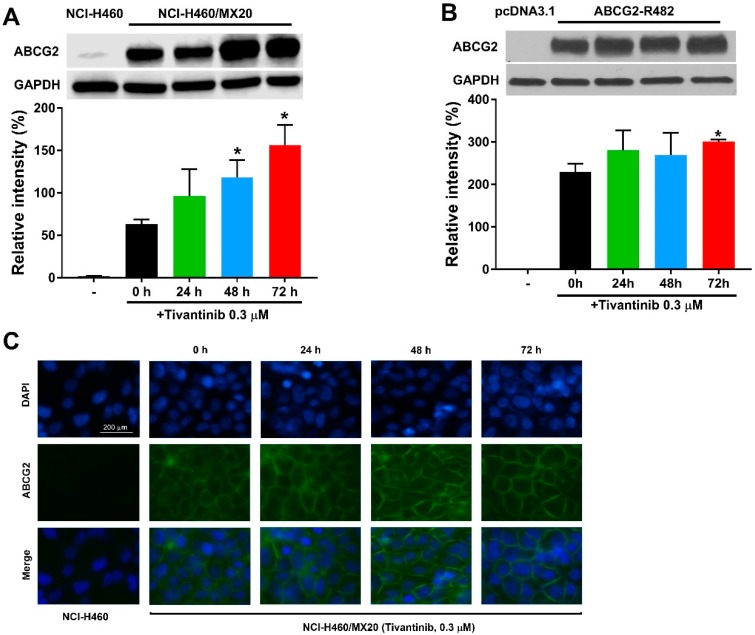
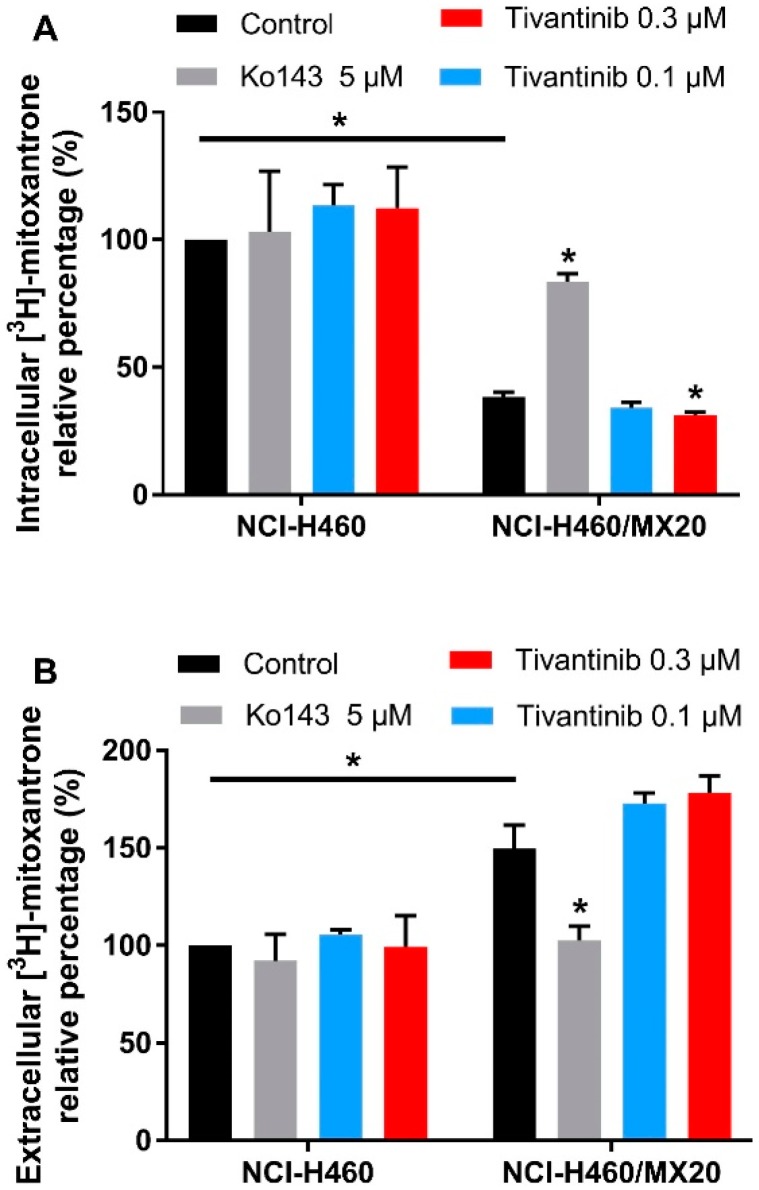
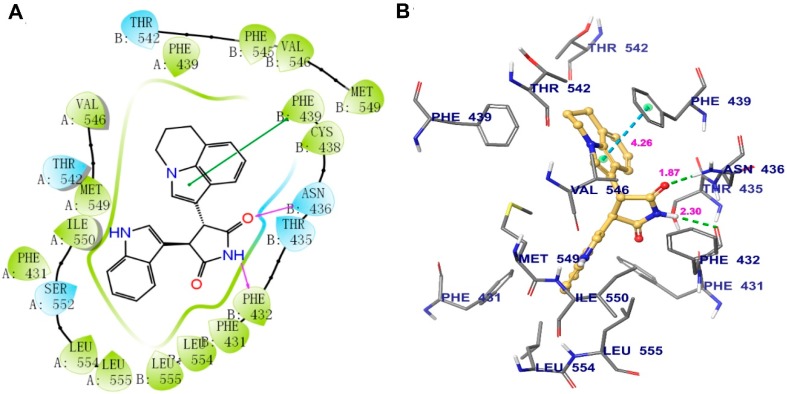
Tivantinib, also known as ARQ-197, is a potent non-ATP competitive selective c-Met inhibitor currently under phase 3 clinical trial evaluation for liver and lung cancers. In this study, we explored factors that may lead to tivantinib resistance, especially in regards to its interaction with ATP-binding cassette super-family G member 2 (ABCG2). ABCG2 is one of the most important members of the ATP-binding cassette (ABC) transporter family, a group of membrane proteins that play a critical role in mediating multidrug resistance (MDR) in a variety of cancers, including those of the liver and lung. Tivantinib received a high score in docking analysis, indicating a strong interaction between tivantinib and ABCG2, and an ATPase assay indicated that tivantinib stimulated ABCG2 ATPase activity in a concentration-dependent manner. An MTT assay showed that ABCG2 overexpression significantly desensitized both the cancer cells and ABCG2 transfected-HEK293 cells to tivantinib and that this drug resistance can be reversed by ABCG2 inhibitors. Furthermore, tivantinib upregulated the protein expression of ABCG2 without altering the cell surface localization of ABCG2, leading to increased resistance to substrate drugs, such as mitoxantrone. Altogether, these data demonstrate that tivantinib is a substrate of ABCG2, and, therefore, ABCG2 overexpression may decrease its therapeutic effect. Our study provides evidence that the overexpression of ABCG2 should be monitored in clinical settings as an important risk factor for tivantinib drug resistance.
Keywords: ABCG2; ARQ-197; ATP-binding cassette (ABC) transporter; drug transport; multidrug resistance (MDR); tivantinib.
Conflict of interest statement
The authors declare no conflict of interest.
Figures
Similar articles
-
Dacomitinib antagonizes multidrug resistance (MDR) in cancer cells by inhibiting the efflux activity of ABCB1 and ABCG2 transporters.Cancer Lett. 2018 May 1;421:186-198. doi: 10.1016/j.canlet.2018.01.021. Epub 2018 Jan 11. Cancer Lett. 2018. PMID: 29331420
-
Voruciclib, a Potent CDK4/6 Inhibitor, Antagonizes ABCB1 and ABCG2-Mediated Multi-Drug Resistance in Cancer Cells.Cell Physiol Biochem. 2018;45(4):1515-1528. doi: 10.1159/000487578. Epub 2018 Feb 19. Cell Physiol Biochem. 2018. PMID: 29486476
-
Sitravatinib, a Tyrosine Kinase Inhibitor, Inhibits the Transport Function of ABCG2 and Restores Sensitivity to Chemotherapy-Resistant Cancer Cells in vitro.Front Oncol. 2020 May 12;10:700. doi: 10.3389/fonc.2020.00700. eCollection 2020. Front Oncol. 2020. PMID: 32477943 Free PMC article.
-
Multidrug resistance in cancer chemotherapy and xenobiotic protection mediated by the half ATP-binding cassette transporter ABCG2.Curr Med Chem Anticancer Agents. 2004 Jan;4(1):31-42. doi: 10.2174/1568011043482205. Curr Med Chem Anticancer Agents. 2004. PMID: 14754410 Review.
-
ABCG2/BCRP: Specific and Nonspecific Modulators.Med Res Rev. 2017 Sep;37(5):987-1050. doi: 10.1002/med.21428. Epub 2016 Dec 22. Med Res Rev. 2017. PMID: 28005280 Review.
Cited by
-
OTS964, a TOPK Inhibitor, Is Susceptible to ABCG2-Mediated Drug Resistance.Front Pharmacol. 2021 Feb 15;12:620874. doi: 10.3389/fphar.2021.620874. eCollection 2021. Front Pharmacol. 2021. PMID: 33658942 Free PMC article.
-
Repurposing of c-MET Inhibitor Tivantinib Inhibits Pediatric Neuroblastoma Cellular Growth.Pharmaceuticals (Basel). 2024 Oct 9;17(10):1350. doi: 10.3390/ph17101350. Pharmaceuticals (Basel). 2024. PMID: 39458991 Free PMC article.
-
Anticancer effect of Indanone-based thiazolyl hydrazone derivative on p53 mutant colorectal cancer cell lines: An in vitro and in vivo study.Front Oncol. 2022 Aug 4;12:949868. doi: 10.3389/fonc.2022.949868. eCollection 2022. Front Oncol. 2022. PMID: 35992866 Free PMC article.
-
Insights on the structure-function relationship of human multidrug resistance protein 7 (MRP7/ABCC10) from molecular dynamics simulations and docking studies.MedComm (2020). 2021 Mar 25;2(2):221-235. doi: 10.1002/mco2.65. eCollection 2021 Jun. MedComm (2020). 2021. PMID: 34766143 Free PMC article.
-
Dual TTK/CLK2 inhibitor, CC-671, selectively antagonizes ABCG2-mediated multidrug resistance in lung cancer cells.Cancer Sci. 2020 Aug;111(8):2872-2882. doi: 10.1111/cas.14505. Epub 2020 Jun 29. Cancer Sci. 2020. PMID: 32478948 Free PMC article.
References
LinkOut - more resources
Full Text Sources
Molecular Biology Databases
Miscellaneous
