. 2020 Mar 31;141(13):1080-1094.
doi: 10.1161/CIRCULATIONAHA.119.043833. Epub 2020 Jan 16.

Neutrophil-Derived S100A8/A9 Amplify Granulopoiesis After Myocardial Infarction

Affiliations

Neutrophil-Derived S100A8/A9 Amplify Granulopoiesis After Myocardial Infarction

Gopalkrishna Sreejit et al. Circulation. .

Abstract

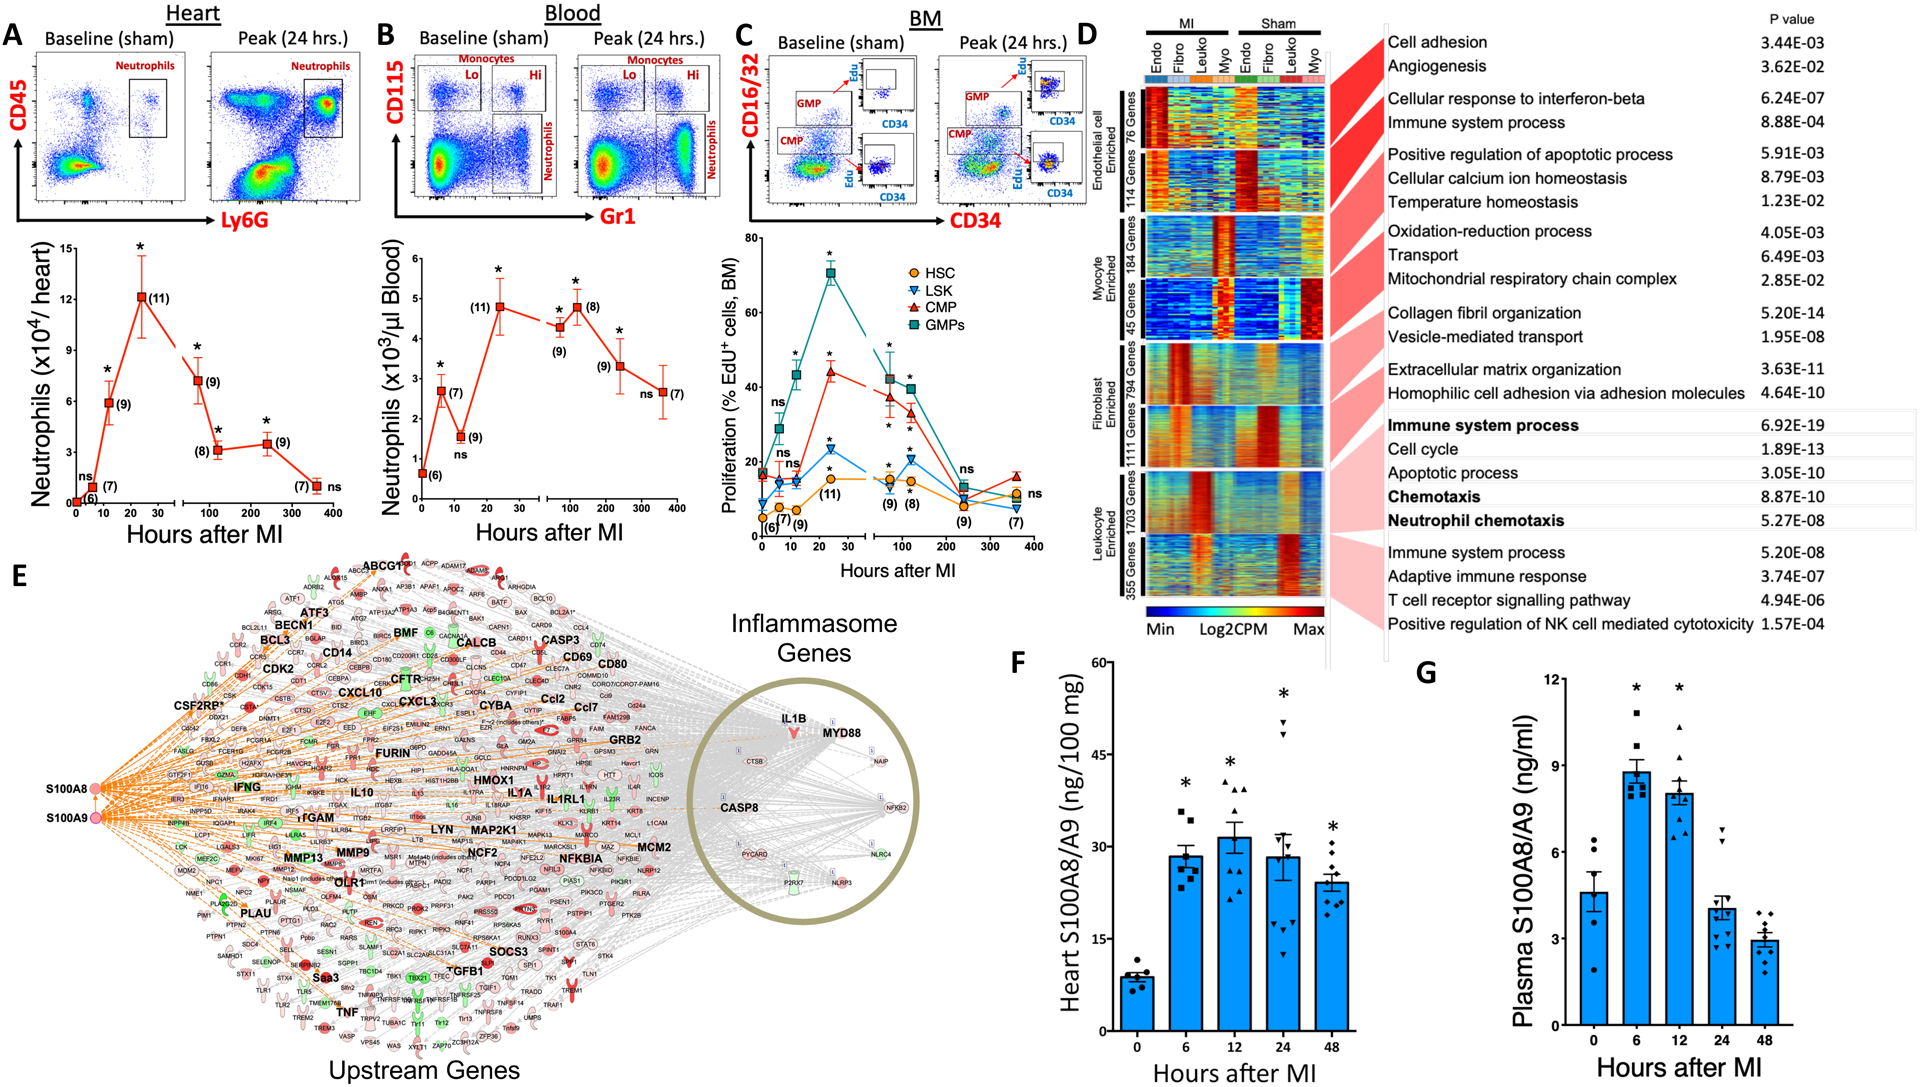
Background: Myocardial infarction (MI) triggers myelopoiesis, resulting in heightened production of neutrophils. However, the mechanisms that sustain their production and recruitment to the injured heart are unclear.

Methods: Using a mouse model of the permanent ligation of the left anterior descending artery and flow cytometry, we first characterized the temporal and spatial effects of MI on different myeloid cell types. We next performed global transcriptome analysis of different cardiac cell types within the infarct to identify the drivers of the acute inflammatory response and the underlying signaling pathways. Using a combination of genetic and pharmacological strategies, we identified the sequelae of events that led to MI-induced myelopoiesis. Cardiac function was assessed by echocardiography. The association of early indexes of neutrophilia with major adverse cardiovascular events was studied in a cohort of patients with acute MI.

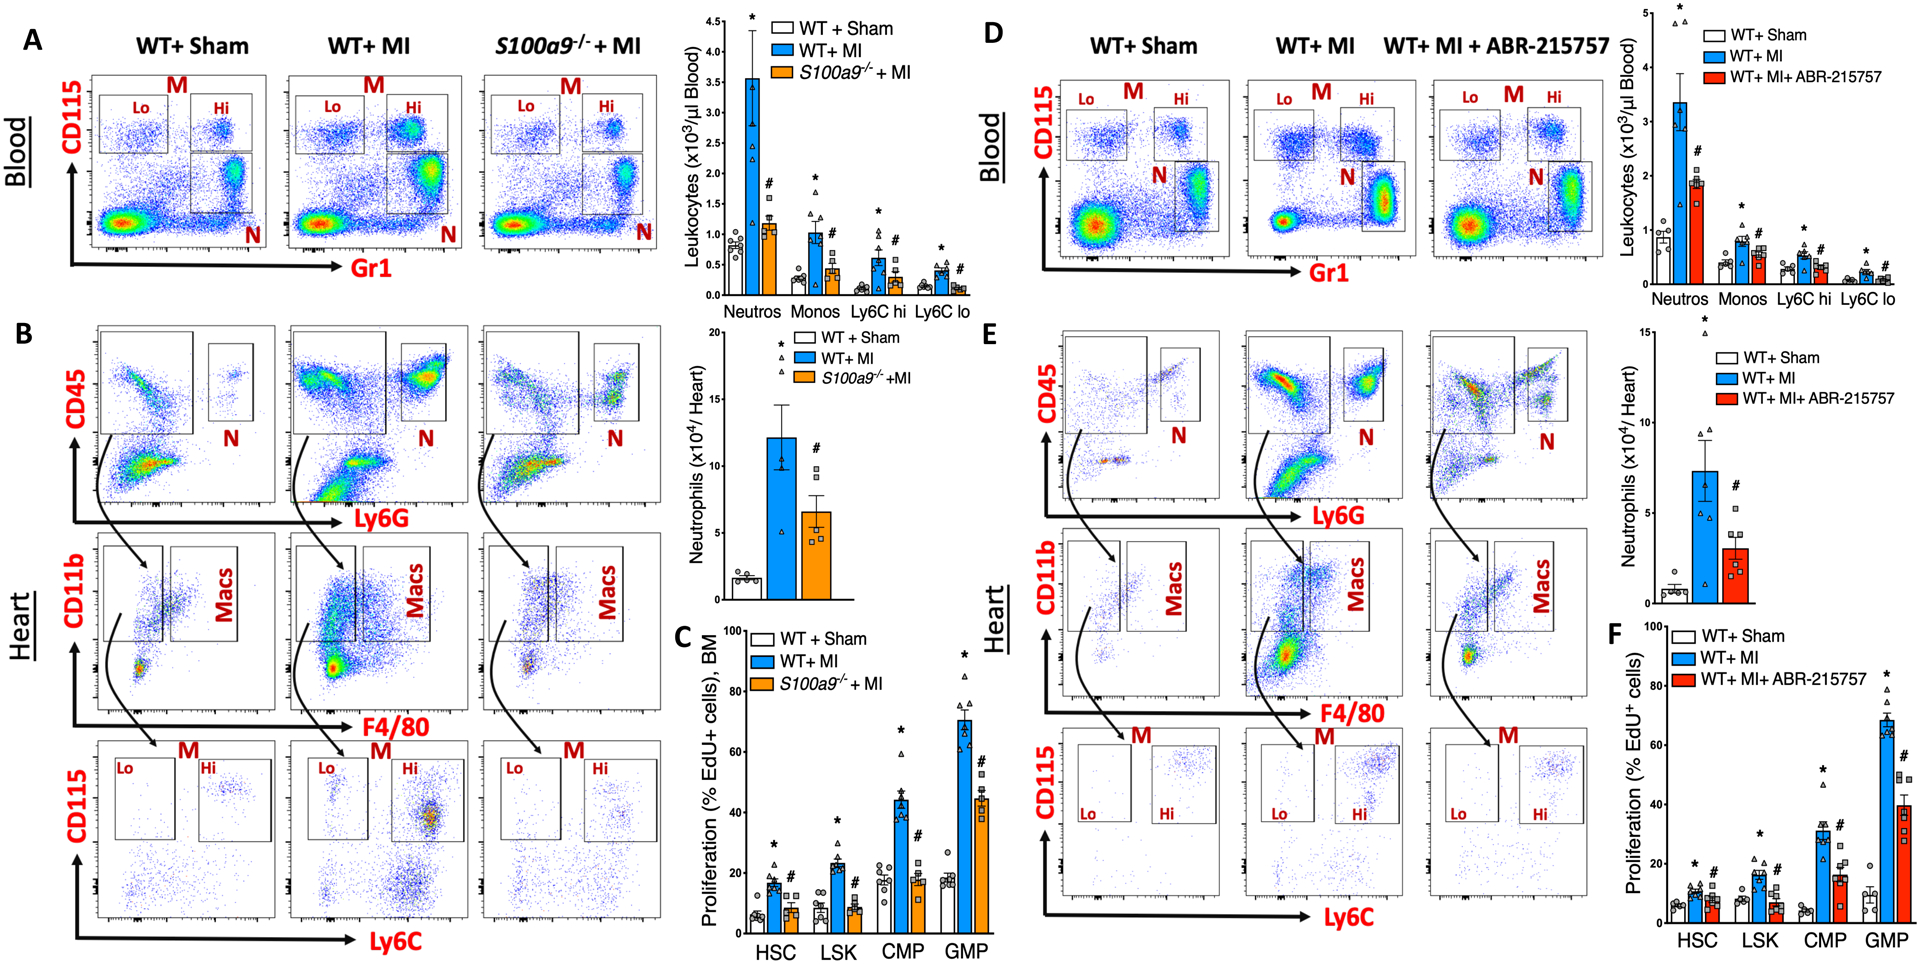
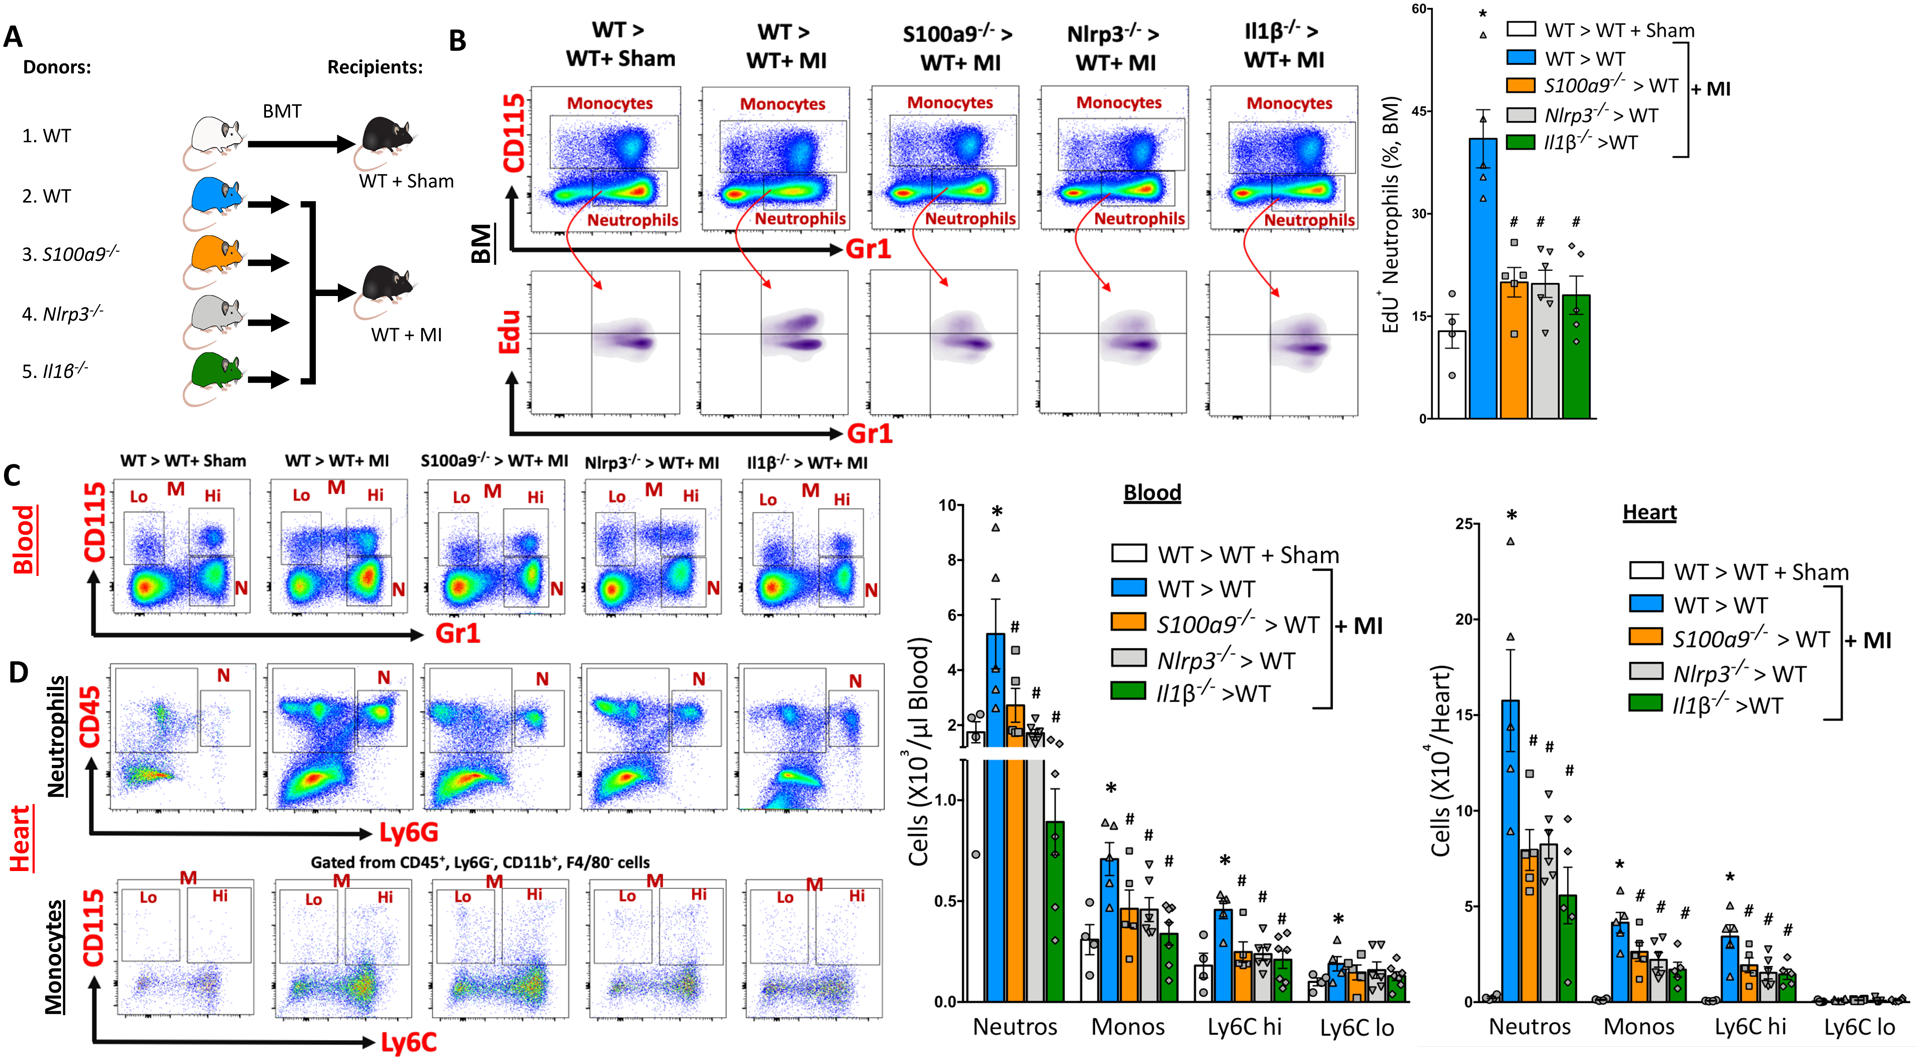
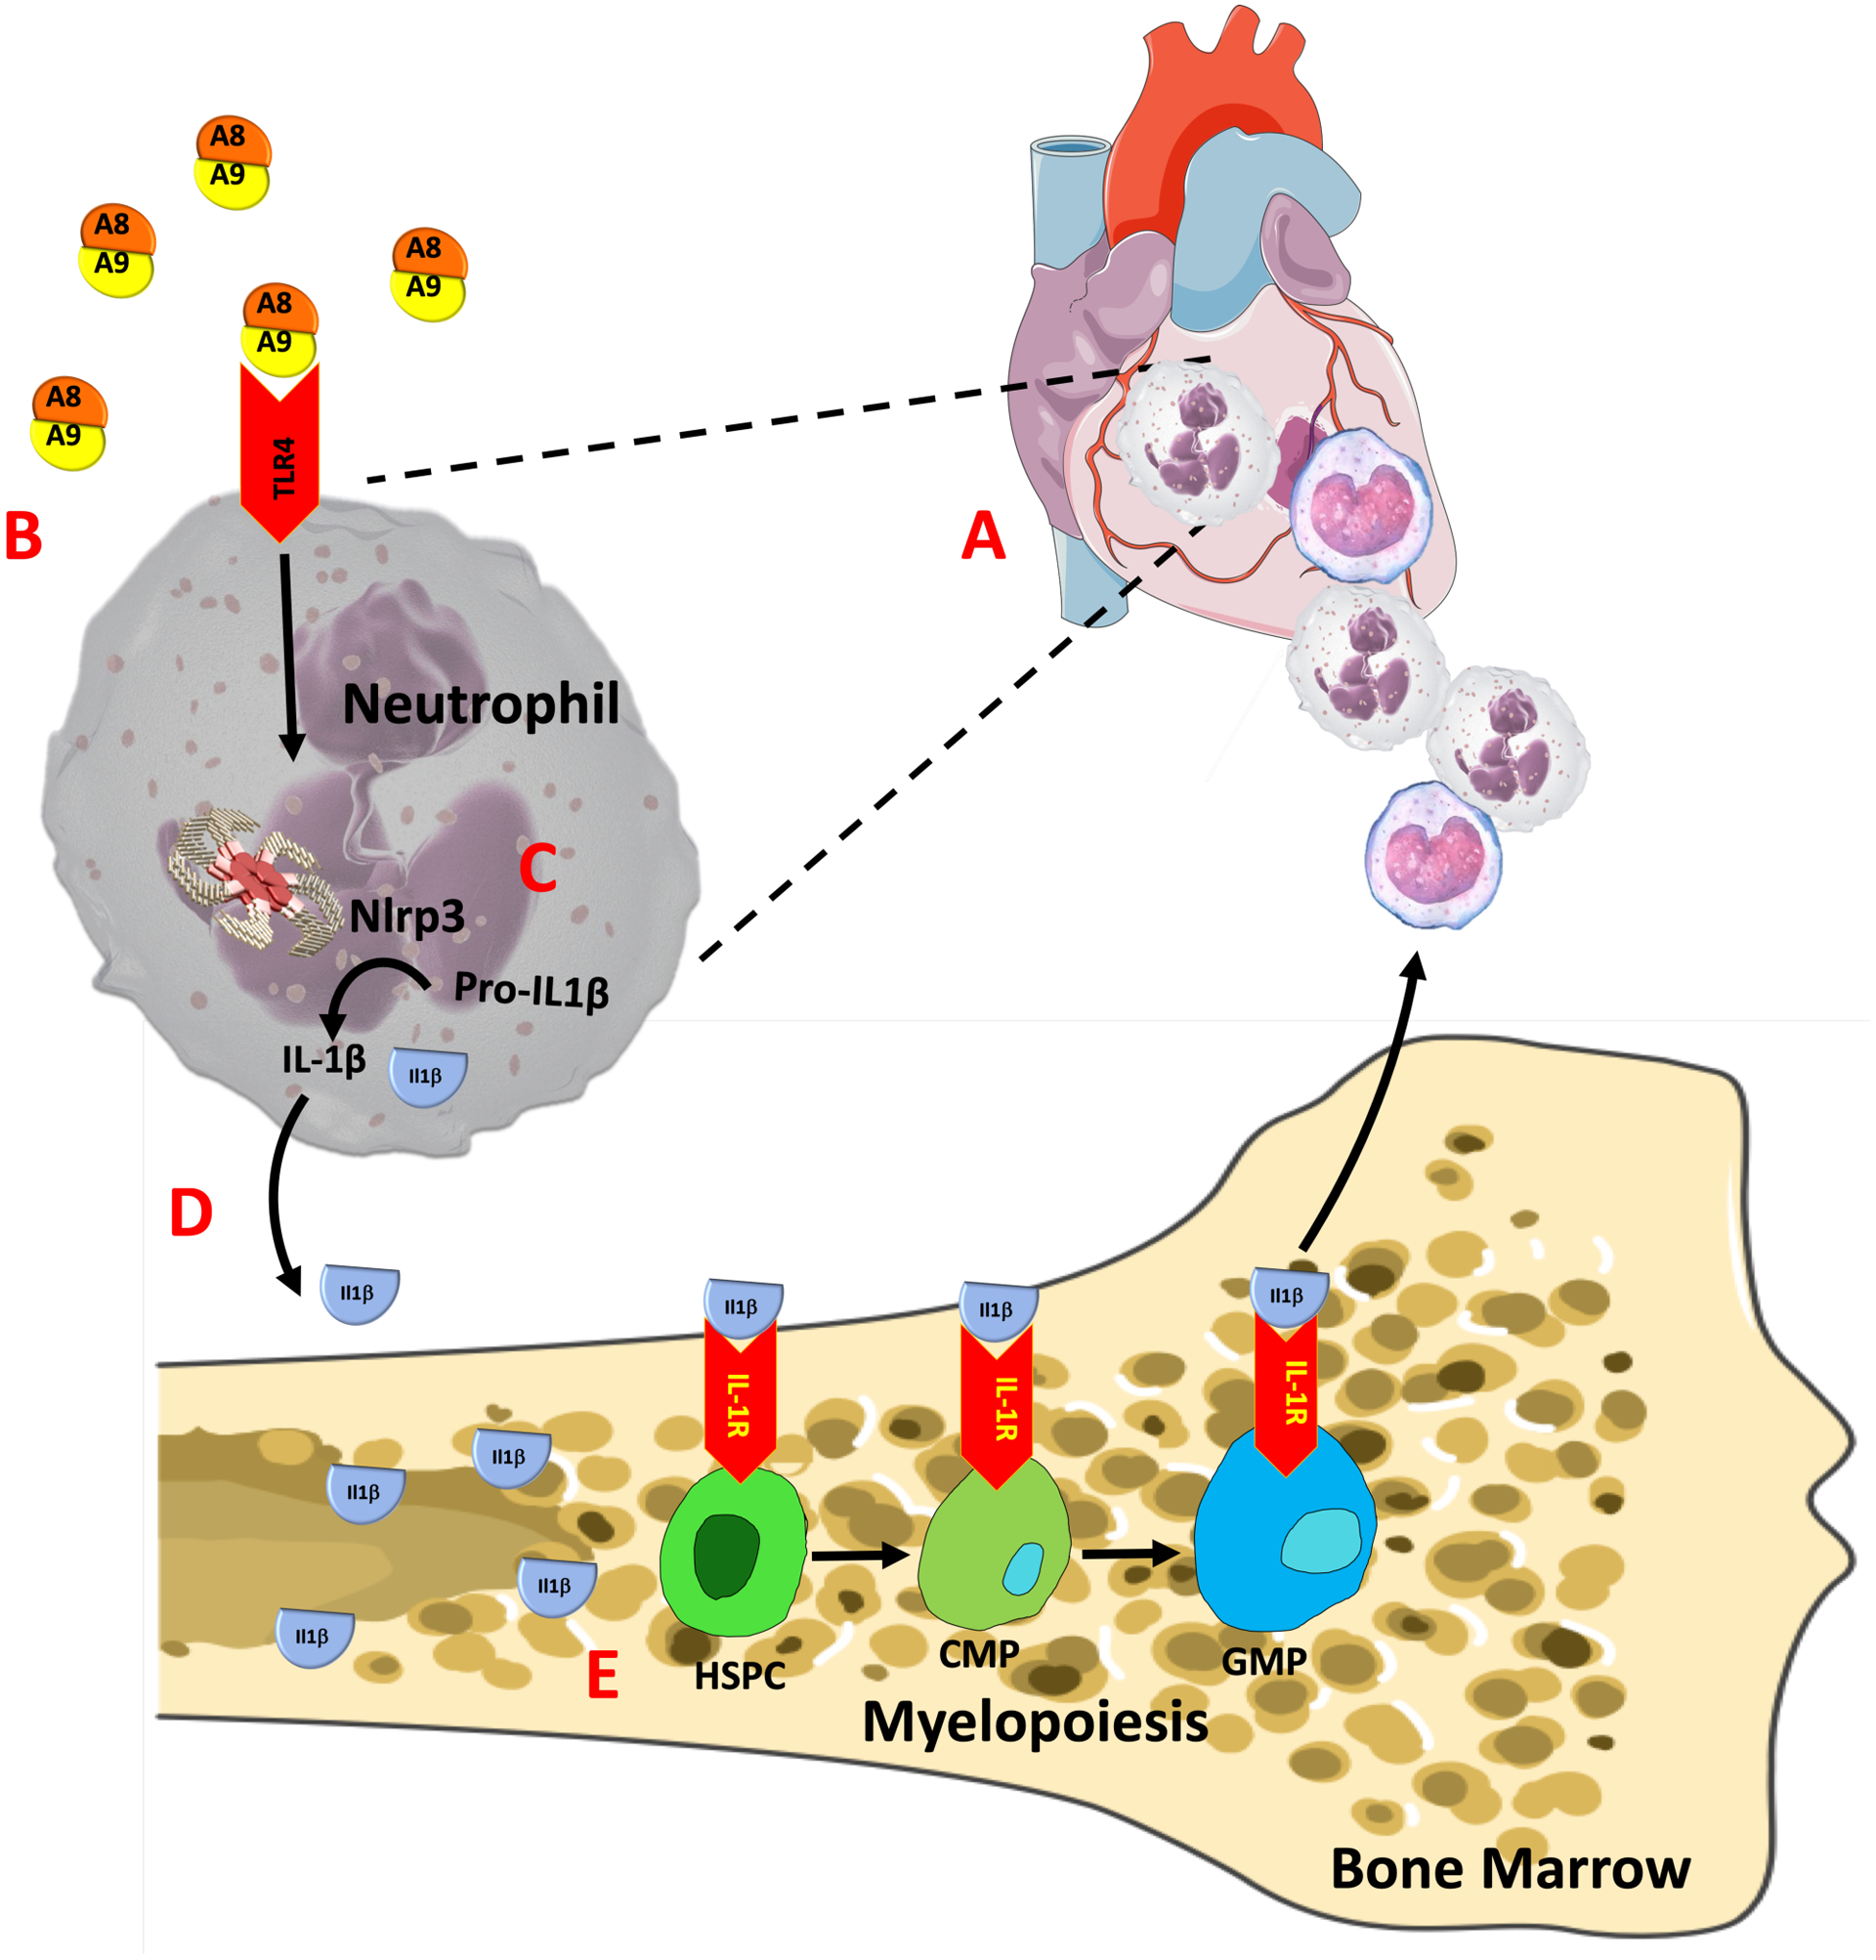
Results: Induction of MI results in rapid recruitment of neutrophils to the infarct, where they release specific alarmins, S100A8 and S100A9. These alarmins bind to the Toll-like receptor 4 and prime the nod-like receptor family pyrin domain-containing 3 inflammasome in naïve neutrophils and promote interleukin-1β secretion. The released interleukin-1β interacts with its receptor (interleukin 1 receptor type 1) on hematopoietic stem and progenitor cells in the bone marrow and stimulates granulopoiesis in a cell-autonomous manner. Genetic or pharmacological strategies aimed at disruption of S100A8/A9 and their downstream signaling cascade suppress MI-induced granulopoiesis and improve cardiac function. Furthermore, in patients with acute coronary syndrome, higher neutrophil count on admission and after revascularization correlates positively with major adverse cardiovascular disease outcomes.

Conclusions: Our study provides novel evidence for the primary role of neutrophil-derived alarmins (S100A8/A9) in dictating the nature of the ensuing inflammatory response after myocardial injury. Therapeutic strategies aimed at disruption of S100A8/A9 signaling or their downstream mediators (eg, nod-like receptor family pyrin domain-containing 3 inflammasome, interleukin-1β) in neutrophils suppress granulopoiesis and may improve cardiac function in patients with acute coronary syndrome.

Keywords: S100A8/A9, Nlrp3 inflammasome; alarmins; inflammation; myelopoiesis; myocardial ischemia; neutrophils.


Figures

Figure 1.
Figure 1.. Neutrophils dominate the heart following myocardial infarction (MI).
C57BL6 WT mice were subjected to MI by permanent ligation of the left anterior descending (LAD) artery and their myeloid progenitor (BM) and leukocyte cell populations (blood and heart) were quantified at 6, 12, 24, 72, 120, 240 and 360 hours following MI. Flow cytometry plots (top panel) representing neutrophil and /or monocyte populations in the heart (A) and blood (B) at baseline (sham) and peak along with their quantification (bottom panel). Cells in the hearts are normalized to 100 mg of tissue. C, Flow cytometric gating (top panel) and quantification of proliferation rates (as assessed by EdU incorporation) of myeloid progenitor cells in the BM at baseline (sham) and peak along with their quantification (bottom panel). MI, Myocardial infarction; Lo, Ly6C Lo monocytes; Hi, Ly6C Hi monocytes; CMP, Common myeloid progenitors; GMP, Granulocyte macrophage progenitors; LSK, Lineage, ckit+, Sca1+ cells and HSC, Hematopoietic stem cells. All cells were gated after eliminating debris, dead and clustered cells. Monocytes and neutrophils in the blood were gated on CD45+ cells, myeloid progenitor cells (CMP, GMP) on Lin, ckit+, Sca1 cells while HSCs were gated on LSK cells. The number in parenthesis next to each data symbol indicates sample size. Mean± SEM, n=6–11/ group. Statistical tests for (A) through (C): Kruskal-Wallis test and Dunn’s multiple comparison test, *P<0.05 compared to the baseline/ sham control in each figure, ns; not significant. D, Gene ontologies of cell-specific differentially expressed genes. The heatmaps depict genes ranked by the degree of cell-type specific enrichment. Endo, Endothelial cells; Fibro, Fibroblasts; Leuko, Leukocytes and Myo, Cardiomyocytes. The P value of GO enrichment in each gene set is reported. n=4 per sample. E, Immune response gene network connecting S100A8/9, Nlrp3 inflammasome and IL-1β in CD45 cells. The upstream connections of the inflammasome genes identified S100A8 and S100A9 as upstream drivers. The interconnections of S100A8/A9 and IL-1β in the inflammasome network are highlighted. Red or green nodes denote upregulation during MI or Sham, respectively. Quantification of S100A8/A9 protein levels (by ELISA) in the (F) heart lysates and (G) plasmas of WT sham and MI mice. Mean± SEM, n=6–11/ group. Statistical tests for (F) and (G): 1-way ANOVA and Holm-Sidak’s post-hoc test, *P<0.05 compared to the baseline/ sham controls in each figure.
Figure 2.
Figure 2.. Genetic deletion or pharmacological inhibition of S100A8/A9 suppress MI-induced granulopoiesis.
Flow cytometric gating (left panel) and quantification (right panel) of neutrophils in the blood (A) and heart (B) at ~ 18 hours post-MI in WT+ Sham, WT+ MI and S100a9−/−+ MI mice. N, Neutrophils; M, Monocytes; Lo, Ly6C Lo monocytes; Hi, Ly6C Hi monocytes and Macs, Macrophages. C, Effect of MI on the proliferation of hematopoietic stem and progenitor cells in the BM as assessed by EdU incorporation and flow cytometry. CMP, Common myeloid progenitors; GMP, Granulocyte macrophage progenitors; LSK, Lin, ckit+, Sca1+ cells and HSC, Hematopoietic stem cells. Cells in the hearts are normalized to 100 mg of tissue. Mean± SEM, n=5–7 per group. Statistical tests for (A) and (B): 1-way ANOVA and Holm-Sidak’s post-hoc test, * P<0.05 compared to all other groups in each cell type, # vs WT+ MI for each cell type. Statistical tests for (C): Kruskal Wallis test and Dunn’s multiple comparison test, * P<0.05 compared to all other groups in each cell type, # vs WT+ MI for each cell type. Flow cytometric gating (left panel) and quantification (right panel) of neutrophils in the blood (D) and heart (E) at ~18 hours post-MI in WT+ Sham, WT+ MI and WT+ MI+ ABR-215757 treated mice. ABR-215757 was administered orally once (10 mg /kg) 4 hours before LAD ligation and the treatment was continued (10 mg /kg/ day) in drinking water until termination. F, Effect of MI on the proliferation of hematopoietic stem and progenitor cells in the BM as assessed by EdU incorporation and flow cytometry. Cells in the hearts are normalized to 100 mg of tissue. Mean± SEM, n=5–7 per group. Statistical tests for (D) and (F): 1-way ANOVA and Holm-Sidak’s post-hoc test, * P<0.05 compared to all other groups in each cell type, # vs WT+ MI for each cell type. Statistical tests for (E): Kruskal Wallis test and Dunn’s multiple comparison test, P<0.05 compared to all other groups in each cell type, # vs WT+ MI for each cell type.
Figure 3.
Figure 3.. MI-induced granulopoiesis requires a functional S100A8/A9-Nlrp3-IL-1β signaling axis in neutrophils.
(A) Experimental overview: Bone marrow (BM) from C57BL6 WT, S100a9−/, Nlrp3−/− and Il1β−/− mice in BL6 background was transplanted to WT recipients and allowed to reconstitute for 6 weeks following which MI was induced by LAD ligation. Approximately 18 hours later, the effect of S100a9, Nlrp3 and Il1β gene deletion on MI-induced granulopoiesis was determined. B, Representative flow cytometry plots (left panel) and quantification (right panel) of newly formed neutrophils (EdU) in the BM of recipient mice (18 hr. post-MI) transplanted with BM from WT, S100a9−/−, Nlrp3−/− or Il1β−/− mice. Mean ± SEM, n= 4–6 per group. Statistical tests for (B):1-way ANOVA and Holm-Sidak’s post-hoc test, *P<0.05 compared to all other groups, # P<0.05 compared to WT> WT+ MI group. Representative flow cytometry plots (left panels) and quantification (right panels) of leukocytes in the blood (C) and heart (D) at ~18 hours post-MI. All cells were gated after eliminating debris, dead and clustered cells. Monocytes and neutrophils were gated on CD45+ cells (blood) or CD45+, CD11b+, F4/80 cells (heart). N, Neutrophils; M, Monocytes; Lo, Ly6C Lo monocytes and Hi, Ly6C Hi monocytes. Cells in the hearts are normalized to 100 mg of tissue. Mean ± SEM, n= 4–7 per group. Statistical tests for (C) and (D): 1-way ANOVA and Holm-Sidak’s post-hoc test, *P<0.05 compared to all other groups in each cell type, # P<0.05 compared to WT> WT+ MI group for each cell type.
Figure 4.
Figure 4.. TLR4 on cardiac neutrophils and IL1R1 on HSPCs in the BM is critical for MI-induced granulopoiesis.
(A) Cell surface expression of IL1R1 (MFI) on hematopoietic stem and progenitor cells in the Bone marrow (BM) of WT+ sham and WT+ MI mice (~18 Hrs. post-MI) as assessed by flow cytometry. Histograms representing IL1R1 expression on LSK, CMP and GMPs in the BM of sham and MI mice. Mean ± SEM, n= 5 per group. Statistical tests for (A): Mann-Whitney test, *P<0.05 compared to the corresponding sham group in each cell type. B, Experimental overview: BM from C57BL6 WT, Tlr4−/−, and Il1r1−/− mice was transplanted to WT recipients and allowed to reconstitute for 6 weeks. MI was induced by LAD ligation following which (~18 Hrs. later) the effect of Tlr4 and Il1r1 gene deletion on MI-induced granulopoiesis was examined. Representative flow cytometry plots (left panels) and quantification (right panels) of leukocytes in the blood (C) and heart (D) of sham and MI mice. Monocytes and neutrophils were gated on CD45+ cells (blood) or CD45+, CD11b+, F4/80 cells (heart). N, Neutrophils; M, Monocytes; Lo, Ly6C Lo monocytes and Hi, Ly6C Hi monocytes. E, Quantification of hematopoietic stem and progenitor cell proliferation (EdU incorporation) in the BM. Mean ± SEM, n= 4–6 per group. Statistical tests for (C) through (E): 1-way ANOVA and Holm-Sidak’s post-hoc test, *P<0.05 compared to the corresponding sham group in each cell type, # P<0.05 compared to WT> WT+ MI group in each cell type. F, Overview of competitive BMT study: Equal portions of BM from WT CD45.1 and WT CD45.2 (Group A) or WT CD45.1 and Il1r1−/− CD45.2 mice (Group B) were transplanted to WT CD45.2 mice (recipients). After the 6-week reconstitution period, MI was induced in the recipient mice and 12–14 hours later the ratio of CD45.1 to CD45.2 leukocytes in the blood (G), heart (H) and BM (I) along with the (J) proliferation (EdU incorporation) of LSK and myeloid progenitor cells (MPC) was determined. Cells in the hearts are normalized to 100 mg of tissue. Numbers in parentheses indicate the ratio of CD45.1 to CD45.2 cells. Ratios higher than 1 indicates competitive outgrowth of WT CD45.1 over Il1r1−/− CD45.2 cells. Mean ± SEM, n= 4–6 per group. Statistical tests for (G) through (J): 2-tailed unpaired t test, *P<0.05 vs. the corresponding CD45.1 (white bars) group in each cell type. n.s., not significant.
Figure 5.
Figure 5.. Genetic disruption of S100A8/A9-Nlrp3-IL1β signaling in neutrophils improves cardiac function.
(A) Experimental overview: Bone marrow (BM) from C57BL6 WT, S100a9−/−, Nlrp3−/− and Il1β−/− mice in BL6 background was transplanted to WT recipients and allowed to reconstitute for 6 weeks following which MI was induced by LAD ligation. B, Scar/infarct size was determined at termination (30 days post-MI). Mean ± SEM, n= 5–6 per group. Statistical tests for (B): 1-way ANOVA and Holm-Sidak’s post-hoc test, *P<0.05 compared to the sham group, # P<0.05 compared to WT> WT+ MI group. Effect of MI on cardiac function was assessed by echocardiography at day 0 (pre-MI), 2- and 30-days post-MI. C, Vector diagrams showing the direction and magnitude of myocardial contraction. Three-dimensional regional wall displacement illustrations, demonstrating contraction (yellow–red) or relaxation (blue) of consecutive cardiac cycle results at 30 days post-MI. Measurement of left ventricular functional parameters including (D) Ejection fraction, (E) Stroke volume and (F) Cardiac output. Mean ± SEM, n= 5–6 per group. Statistical tests for (D) through (F): 1-way ANOVA and Holm-Sidak’s post-hoc test, *P<0.05 compared to all other groups at each time point, # P<0.05 compared to WT+ MI group at each time point and for each parameter, n.s, not significant.
Figure 6.
Figure 6.. Leukocytosis and correlation between neutrophil numbers and major adverse cardiovascular events in ACS patients.
(A) Representative flow cytometry plots (top panels) and quantification (bottom panels) of leukocytes in fresh blood obtained from controls and ACS patients on admission and 6-, 12- and 24-hours post-revascularization. Numbers next to gates indicate population frequencies. The number of (B) white blood cells (WBCs), (C) neutrophils, (D) total monocytes and (E) monocyte subsets in the peripheral blood as assessed by either complete blood count (CBC) or flow cytometry. F, Mean fluorescence intensity (MFI) of CCR2 on monocyte subsets. All cells were gated after eliminating debris, dead and clustered cells. Neutrophils were identified as CD45+, HLA-DR, CD193, CD14 and CD15+ cells. Monocytes were identified as CD45+, HLA-DR+ and further differentiated as classical (C, CD14++, CD16), alternative (A, CD14, CD16++) and intermediate (I, CD14+, CD16+) subsets. Sample size for each group is indicated in parenthesis. Mean ± SEM. Statistical test for (B) through (F): Mann-Whitney test, *P<0.05 compared to the healthy control group in each cell type. G, Color-coded histograms representing intracellular expression (MFI) of pro- IL-1β and their quantification in circulating neutrophils from control and ACS patients. Statistical tests for (G): Mann-Whitney test, *P<0.05 compared to the healthy control group. H, IL-1β release from human neutrophils (healthy donors) in response to stimulation by S100A8/A9 and nigericin in the presence of Nlrp3 inhibitor. Mean ± SEM, n=6. Statistical tests: 1- way ANOVA and Holm-Sidak’s post-hoc test, P<0.05 compared to vehicle treated group, # P<0.05 compared to S100A8/A9+ nigericin group. I, Cumulative MACE-free survival curves of patients with peak-low and peak-high neutrophil counts over a period of 1 year. Statistical test for (I): Log-rank (Mantel-Cox) and Gehan-Breslow- Wilcoxon test, *P<0.05 compared to peak-low neutrophil group.
Figure 7.
Figure 7.. Schematic representation of the proposed signaling pathway
In response to myocardial infarction, circulating neutrophils are attracted to the ischemic heart (A), where, they undergo rapid priming and release S100A8/A9 locally within the ischemic microenvironment. B, S100A8/A9 binds to TLR4 on resident/ incoming neutrophils to (C) induce/ prime the Nlrp3 inflammasome and secretion of IL-1β which then (D) interact with its receptor (IL-1R) on hematopoietic stem and progenitor cells in the bone marrow to stimulate (E) myelopoiesis in a cell-intrinsic manner.

Comment in

References

    1. Coller BS. Leukocytosis and ischemic vascular disease morbidity and mortality: is it time to intervene? Arterioscler Thromb Vasc Biol. 2005;25:658–670. doi: 10.1161/01.ATV.0000156877.94472.a5. - DOI - PubMed
    1. Guasti L, Dentali F, Castiglioni L, Maroni L, Marino F, Squizzato A, Ageno W, Gianni M, Gaudio G, Grandi AM, et al. Neutrophils and clinical outcomes in patients with acute coronary syndromes and/or cardiac revascularisation. A systematic review on more than 34,000 subjects. Thromb Haemost. 2011;106:591–599. doi: 10.1160/TH11-02-0096. - DOI - PubMed
    1. Chia S, Nagurney JT, Brown DF, Raffel OC, Bamberg F, Senatore F, Wackers FJ, Jang IK. Association of leukocyte and neutrophil counts with infarct size, left ventricular function and outcomes after percutaneous coronary intervention for ST-elevation myocardial infarction. Am J Cardiol. 2009;103:333–337. doi: 10.1016/j.amjcard.2008.09.085. - DOI - PubMed
    1. Soehnlein O, Steffens S, Hidalgo A, Weber C. Neutrophils as protagonists and targets in chronic inflammation. Nat Rev Immunol. 2017;17:248–261. doi: 10.1038/nri.2017.10. - DOI - PubMed
    1. Ma Y, Yabluchanskiy A, Lindsey ML. Neutrophil roles in left ventricular remodeling following myocardial infarction. Fibrogenesis Tissue Repair. 2013;6:11. doi: 10.1186/1755-1536-6-11. - DOI - PMC - PubMed

Publication types