

Spatial and temporal distribution of infectious disease epidemics, disasters and other potential public health emergencies in the World Health Organisation Africa region, 2016-2018
- PMID: 31941554
- PMCID: PMC6964091
- DOI: 10.1186/s12992-019-0540-4
Spatial and temporal distribution of infectious disease epidemics, disasters and other potential public health emergencies in the World Health Organisation Africa region, 2016-2018
Abstract
Background: Emerging and re-emerging diseases with pandemic potential continue to challenge fragile health systems in Africa, creating enormous human and economic toll. To provide evidence for the investment case for public health emergency preparedness, we analysed the spatial and temporal distribution of epidemics, disasters and other potential public health emergencies in the WHO African region between 2016 and 2018.
Methods: We abstracted data from several sources, including: the WHO African Region's weekly bulletins on epidemics and emergencies, the WHO-Disease Outbreak News (DON) and the Emergency Events Database (EM-DAT) of the Centre for Research on the Epidemiology of Disasters (CRED). Other sources were: the Program for Monitoring Emerging Diseases (ProMED) and the Global Infectious Disease and Epidemiology Network (GIDEON). We included information on the time and location of the event, the number of cases and deaths and counter-checked the different data sources.
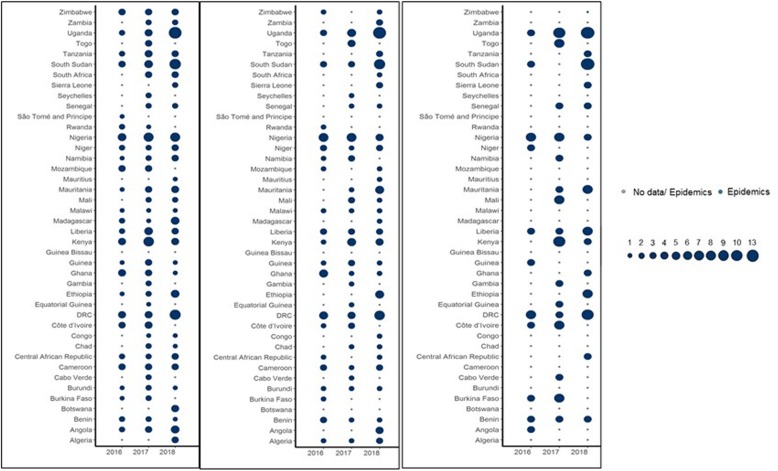
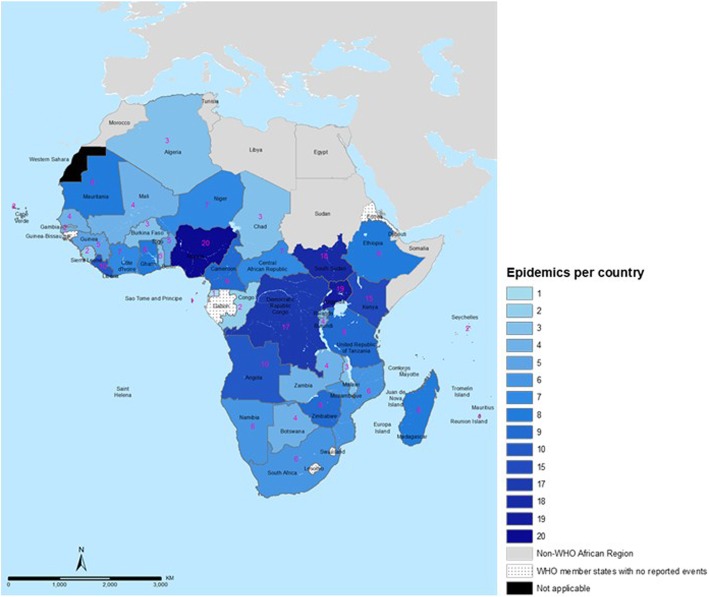
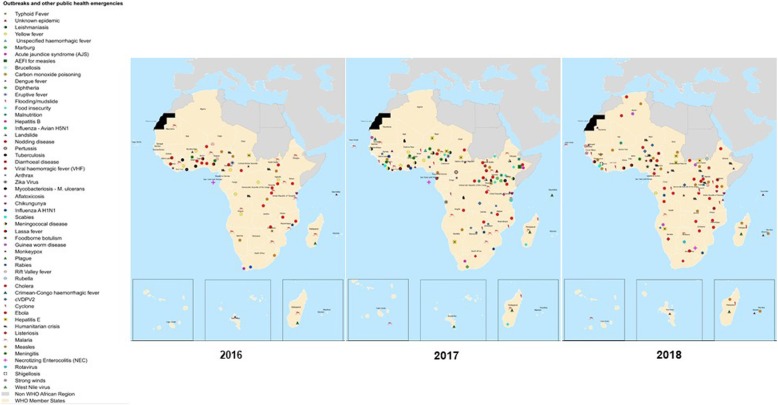
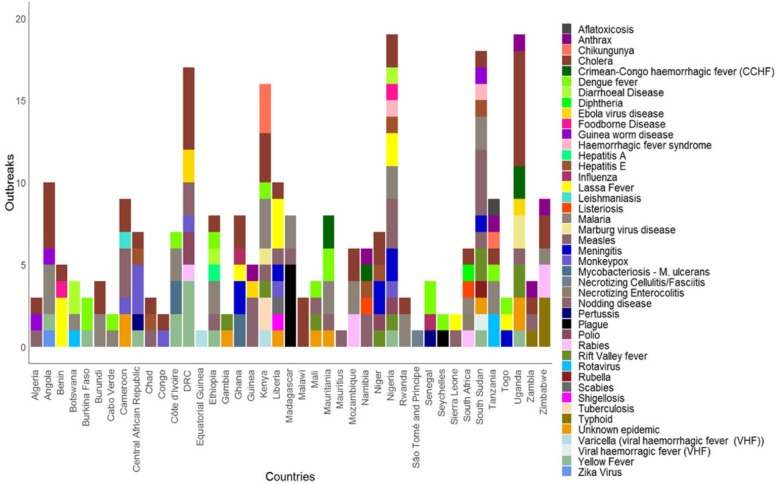
Data analysis: We used bubble plots for temporal analysis and generated graphs and maps showing the frequency and distribution of each event. Based on the frequency of events, we categorised countries into three: Tier 1, 10 or more events, Tier 2, 5-9 events, and Tier 3, less than 5 or no event. Finally, we compared the event frequencies to a summary International Health Regulations (IHR) index generated from the IHR technical area scores of the 2018 annual reports.
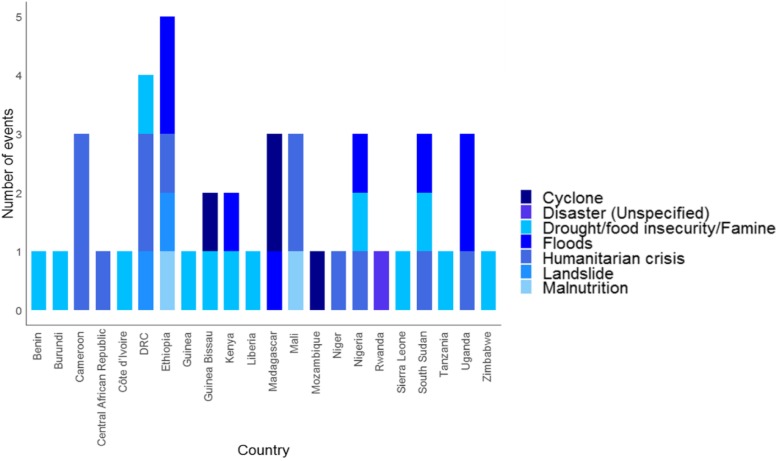
Results: Over 260 events were identified between 2016 and 2018. Forty-one countries (87%) had at least one epidemic between 2016 and 2018, and 21 of them (45%) had at least one epidemic annually. Twenty-two countries (47%) had disasters/humanitarian crises. Seven countries (the epicentres) experienced over 10 events and all of them had limited or developing IHR capacities. The top five causes of epidemics were: Cholera, Measles, Viral Haemorrhagic Diseases, Malaria and Meningitis.
Conclusions: The frequent and widespread occurrence of epidemics and disasters in Africa is a clarion call for investing in preparedness. While strengthening preparedness should be guided by global frameworks, it is the responsibility of each government to finance country specific needs. We call upon all African countries to establish governance and predictable financing mechanisms for IHR implementation and to build resilient health systems everywhere.
Keywords: African region; Disaster; Epidemic; Event; International health regulations; Public health emergency; Public health emergency of international concern; World Health Organisation.
Conflict of interest statement
The authors declare that they have no competing interests.
Figures
Comment in
-
Is Africa prepared for tackling the COVID-19 (SARS-CoV-2) epidemic. Lessons from past outbreaks, ongoing pan-African public health efforts, and implications for the future.Int J Infect Dis. 2020 Apr;93:233-236. doi: 10.1016/j.ijid.2020.02.049. Epub 2020 Feb 28. Int J Infect Dis. 2020. PMID: 32119980 Free PMC article. No abstract available.
References
-
- WHO Regional Office for Africa (2016). Mapping risks and the distribution of epidemics in the WHO African region, a technical report for the Regional Office for Africa. WHO: Brazzaville. (https://apps.who.int/iris/handle/10665/206560. Accessed 20 Feb 2019.
-
- WHO Regional Office for Africa (2018). The Work of WHO in the African Region - Report of the Regional Director: 2017–2018. Brazzaville. (https://apps.who.int/iris/bitstream/handle/10665/273743/AFR-RC68-2-eng.pdf. Accessed 25 Feb 2019.
-
- World Health Organisation. International Health Regulations (2005), Third Edition. http://apps.who.int/iris/bitstream/10665/246107/1/9789241580496-eng.pdf?....
-
- Centres for Disease Control (CDC), United States. www.cdc.gov/csels/dsepd/ss1978/lesson1/section11.html. Accessed 9 Dec 2019.
-
- United Nations Office for Disaster Risk Reduction (UNISDR) (https://www.unisdr.org/we/inform/terminology. Accessed 10 Dec 2019.)
Publication types
MeSH terms
Grants and funding
LinkOut - more resources
Full Text Sources
Medical
Miscellaneous
