. 2020 Feb 19;40(8):1668-1678.
doi: 10.1523/JNEUROSCI.2072-19.2019. Epub 2020 Jan 15.

Information-Limiting Correlations in Large Neural Populations

Affiliations

Information-Limiting Correlations in Large Neural Populations

Ramon Bartolo et al. J Neurosci. .

Abstract

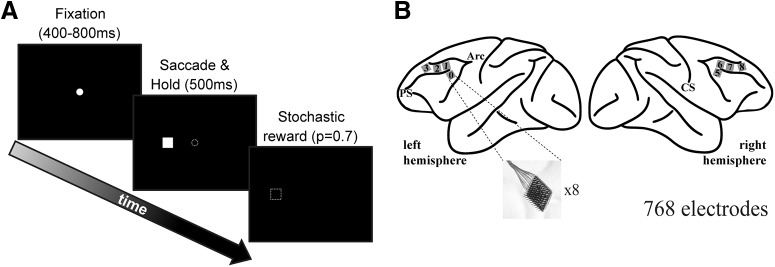
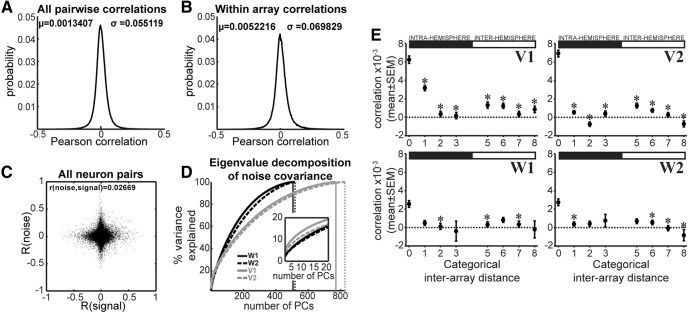
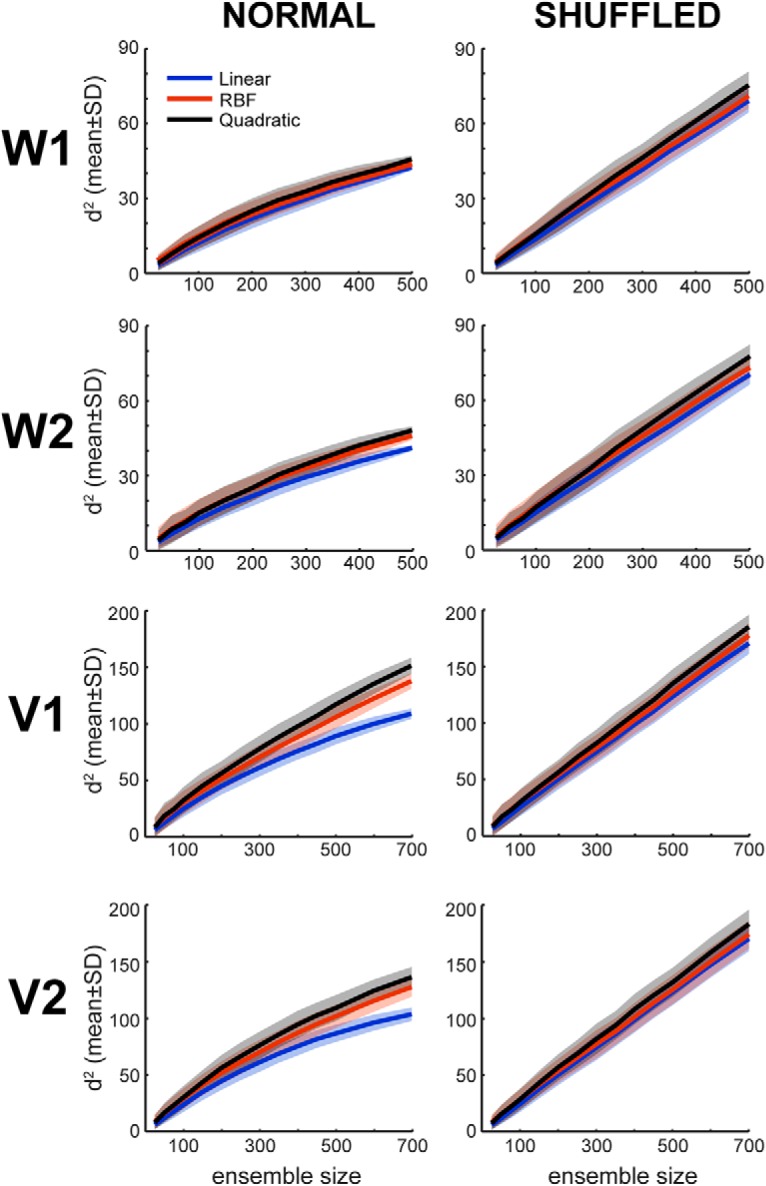
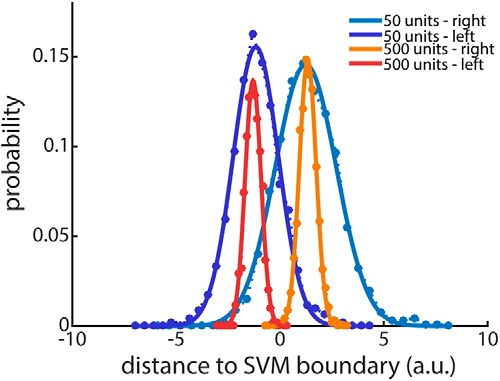
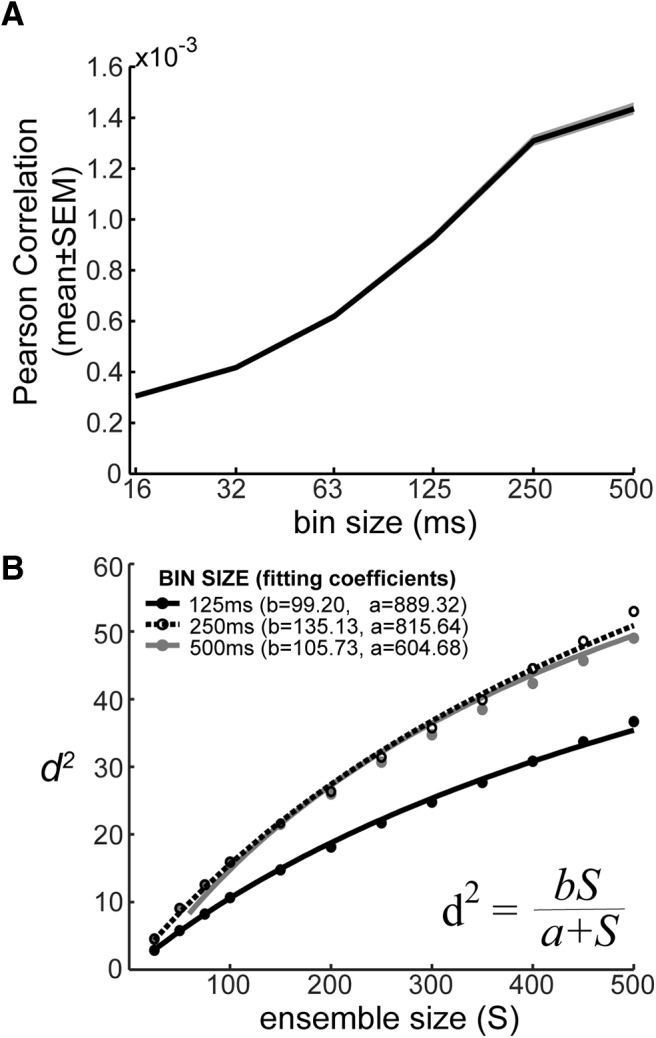
Understanding the neural code requires understanding how populations of neurons code information. Theoretical models predict that information may be limited by correlated noise in large neural populations. Nevertheless, analyses based on tens of neurons have failed to find evidence of saturation. Moreover, some studies have shown that noise correlations can be very small, and therefore may not affect information coding. To determine whether information-limiting correlations exist, we implanted eight Utah arrays in prefrontal cortex (PFC; area 46) of two male macaque monkeys, recording >500 neurons simultaneously. We estimated information in PFC about saccades as a function of ensemble size. Noise correlations were, on average, small (∼10-3). However, information scaled strongly sublinearly with ensemble size. After shuffling trials, destroying noise correlations, information was a linear function of ensemble size. Thus, we provide evidence for the existence of information-limiting noise correlations in large populations of PFC neurons.SIGNIFICANCE STATEMENT Recent theoretical work has shown that even small correlations can limit information if they are "differential correlations," which are difficult to measure directly. However, they can be detected through decoding analyses on recordings from a large number of neurons over a large number of trials. We have achieved both by collecting neural activity in dorsal-lateral prefrontal cortex of macaques using eight microelectrode arrays (768 electrodes), from which we were able to compute accurate information estimates. We show, for the first time, strong evidence for information-limiting correlations. Despite pairwise correlations being small (on the order of 10-3), they affect information coding in populations on the order of 100 s of neurons.

Keywords: Information saturation; neural coding; noise correlations; population coding; prefrontal cortex.


Figures

Figure 1.
Figure 1.
Task and recording sites. A, Schematic of the saccade task. The animals were required to fixate centrally and after a variable fixation time the fixation spot was toggled off at the same time a target was presented either to the left or right. The animals then made a saccade toward the target and were required to hold the target for 500 ms to successfully complete a trial. Stochastic reward (p = 0.7) was delivered for correct trials. B, Location of the 8 microelectrode arrays on the prefrontal cortex, surrounding the principal sulcus. Each array had 96 electrodes in a 10 × 10 arrangement. Numbers on the gray squares are an example of categorical distance, from the array located ventrolateral to the caudal end of the principal sulcus of the left hemisphere (labeled 0). PS, principal sulcus; Arc, arcuate sulcus; CS, central sulcus.
Figure 2.
Figure 2.
Neural responses. A, Raster plots of two example single cells with saccade direction selective activity. Each row of blue ticks represents the spikes during a trial. Red dots along each line represent trial start, cue onset, reward time and end of trial. Trials are aligned to cue onset and sorted by saccade direction. B, Venn diagrams illustrating the proportion of units responsive to the task. Blue circles represent neurons that significantly changed their activity between the fixation and the saccade and holding epochs of the task, tagged as “Task Responsive” (ANOVA, epoch wide firing rate, p < 0.05). Red circles represent units with a significant effect of saccade direction at any point during the saccade and hold epoch (ANOVA, 300 ms sliding window, p < 0.05). White circles indicate the total number of neurons recorded in each session (two sessions from each animal, Monkey W and Monkey V). C, Fraction of neurons responsive to saccade direction during trial execution at each array location. Spike counts from a 100 ms bin moving in 10 ms steps were used as dependent variable for an ANOVA with “direction” as factor. Results were pooled across hemispheres. Array numbers in legend correspond to those shown in Figure 1B. Plots show means ± SEM across the four sessions. D, Effect magnitude during trial execution measured as the negative logarithm of the p-value calculated from the ANOVAs. Same conventions as in C.
Figure 3.
Figure 3.
Noise correlations. A, Distribution of pairwise correlation coefficients. All possible pairs of simultaneously recorded neurons are included (n = 902659), and all recording sessions were pooled. B, Distribution of pairwise correlation coefficients including only same-array pairs of neurons (n = 125,552). All recording sessions were pooled. C, Noise correlations as a function of signal correlations. For individual sessions, the coefficient (mean ± SD) was 0.036 ± 0.017. Across all sessions, r = 0.02669 (p = 2.57 × 10−141). All correlations are Pearson coefficients. D, Scree plots from an eigenvalue decomposition of the noise covariance matrices illustrating the cumulative percentage of variance explained as a function of the number of principal components. The inset is a close up of the first 20 principal components. Vertical solid and dotted lines indicate the total number of components for each curve. E, Average correlation coefficient split by categorical-distance for each animal (V, W) and session (1, 2) separately. Categorical distance 0 indicates that the two units were recorded on the same multielectrode array, 1 indicates units were recorded in adjacent arrays, and so on. For interhemispheric distances, 5 indicates units recorded in location-matching arrays, 6 indicate units in adjacent to location-matching arrays, etc. (see example in Fig. 1B). Asterisks indicate a significant difference with respect to pairs recorded in the same array (U test, p < 0.05).
Figure 4.
Figure 4.
Comparison of different SVM kernels. Information measures obtained using three different kernels for the SVM classifier: linear and quadratic polynomials, and radial basis function (RBF). Decoding analyses for d2 estimations as a function of ensemble size (number of neurons) were performed for each animal/session and using both unshuffled data and shuffled data. n = 500 ensembles of each size randomly drawn from the full recorded population.
Figure 5.
Figure 5.
Decoding accuracy. Shown is the percentage of correctly decoded test trials as a function of ensemble size. Ensembles of different sizes were built by drawing units randomly from the simultaneously recorded population (without replacement). An SVM decoder was fitted and tested on each ensemble. n = 1000 random samples for each ensemble size. Black lines depict results using normal spike data for decoding, while blue lines depict the results of repeating the analysis after shuffling the spike data across trials of the same type (left or right trials). Solid line is mean; shaded region is SD.
Figure 6.
Figure 6.
Example of the distribution of the distances to the SVM classification boundary. Data is split by trial type (left, right) and shown for two example ensemble sizes (50, 500 units). Solid lines are Gaussian fits, which were used to calculate the probability of correctly classifying any given trial. The average probability across trial types was used to calculate the discriminability index d2 as a function of ensemble size (Eq. 1).
Figure 7.
Figure 7.
Information saturation in the presence of correlated noise. Discriminability index (d2) as a function of ensemble size calculated from the response distributions (Fig. 6). All conventions are the same as in Figure 5. n = 1000 samples for each ensemble size. Solid line is mean; shaded line is SD across samples.
Figure 8.
Figure 8.
Effect of bin size. A, Effect of bin size on noise correlations. Correlations increase with bin width. B, Projection of information to ensembles of infinite size. Examples of nonlinear fittings to the measured d2 values from unshuffled spike data to estimate the information value at the asymptotic level (coefficient b in the equation).
Figure 9.
Figure 9.
Asymptotic information value. Information from infinite population is plotted as a function of the lag between the bin center and the time of cue onset, separately for different bin widths. Each panel shows results for an individual recording session. Insets in each panel show the peak of the asymptotic information estimates as a function of bin width. Values shown are means ± SEM across 500 individual fittings (see Fig. 8B).
Figure 10.
Figure 10.
Estimated population size to encode 99% of the asymptotic information (S99). Population sizes are plotted as a function of time after cue onset separately for different bin widths as indicated in the legend. All conventions are the same as in Figure 9.

Comment in

References

    1. Abbott LF, Dayan P (1999) The effect of correlated variability on the accuracy of a population code. Neural Comput 11:91–101. 10.1162/089976699300016827 - DOI - PubMed
    1. Adrian ED. (1928) The basis of sensation. London: Christophers.
    1. Arndt C. (2001) Information measures, Ed 1 Berlin: Springer.
    1. Averbeck BB. (2009) Noise correlations and information encoding and decoding. In: Coherent behavioral in neuronal networks (Josic K, Rubin J, Matias M, Romo R, eds), pp 207–228. New York: Springer.
    1. Averbeck BB, Lee D (2003) Neural noise and movement-related codes in the macaque supplementary motor area. J Neurosci 23:7630–7641. 10.1523/JNEUROSCI.23-20-07630.2003 - DOI - PMC - PubMed

Publication types

LinkOut - more resources