. 2020 Jan 15;11(1):291.
doi: 10.1038/s41467-019-14050-z.

Intratumoral heterogeneity and clonal evolution in liver cancer

Affiliations

Intratumoral heterogeneity and clonal evolution in liver cancer

Bojan Losic et al. Nat Commun. .

Abstract

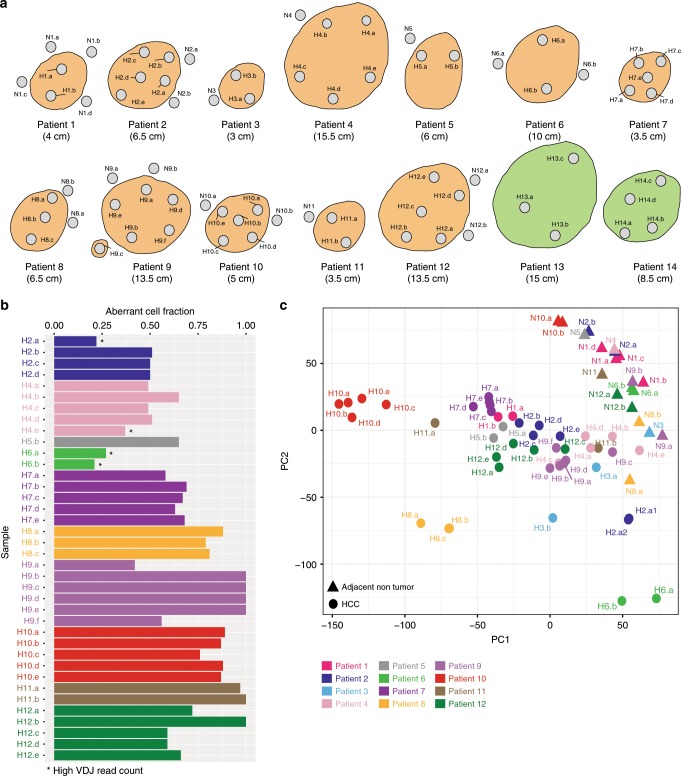
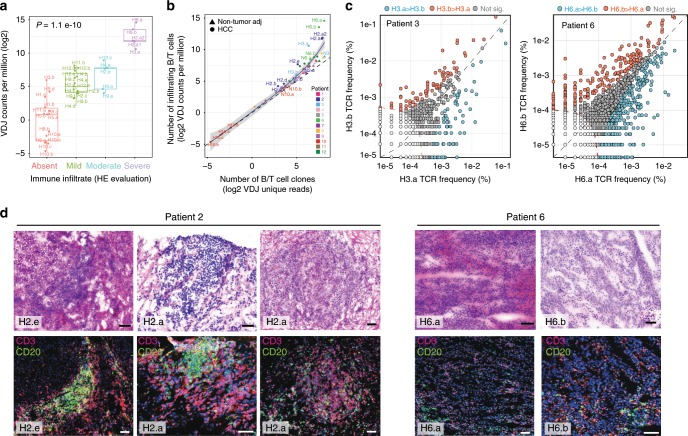
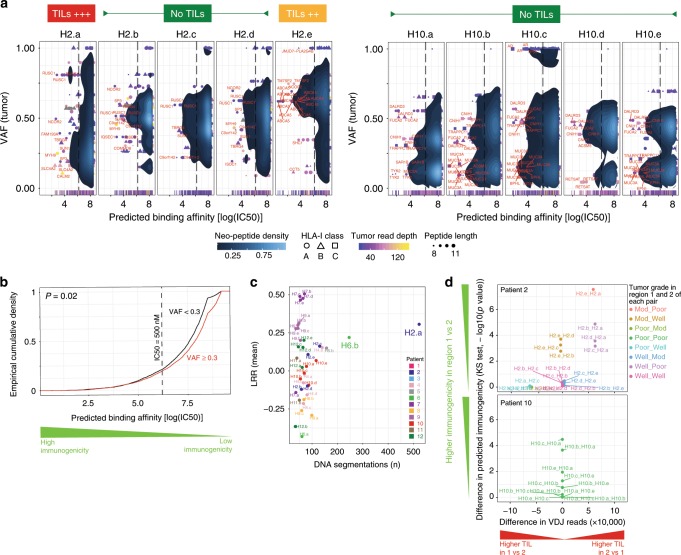
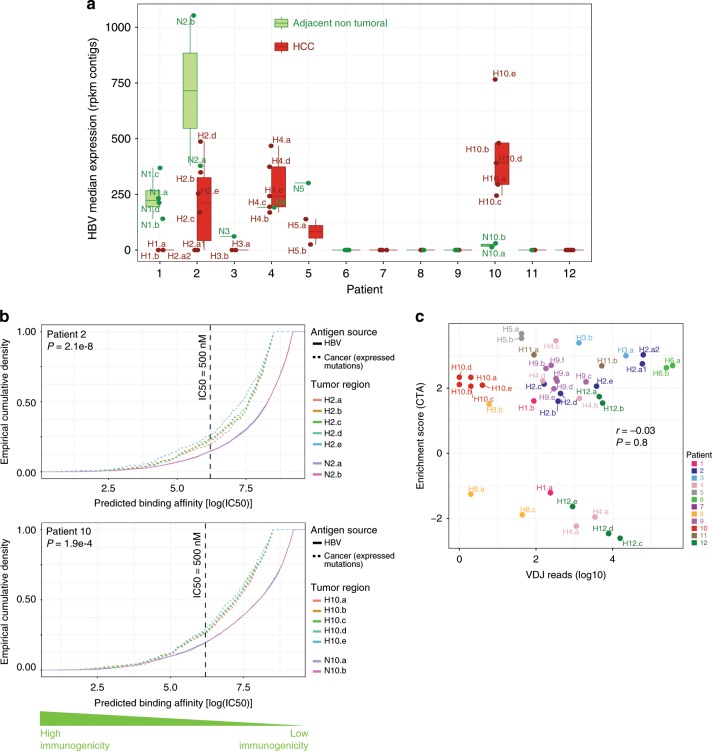
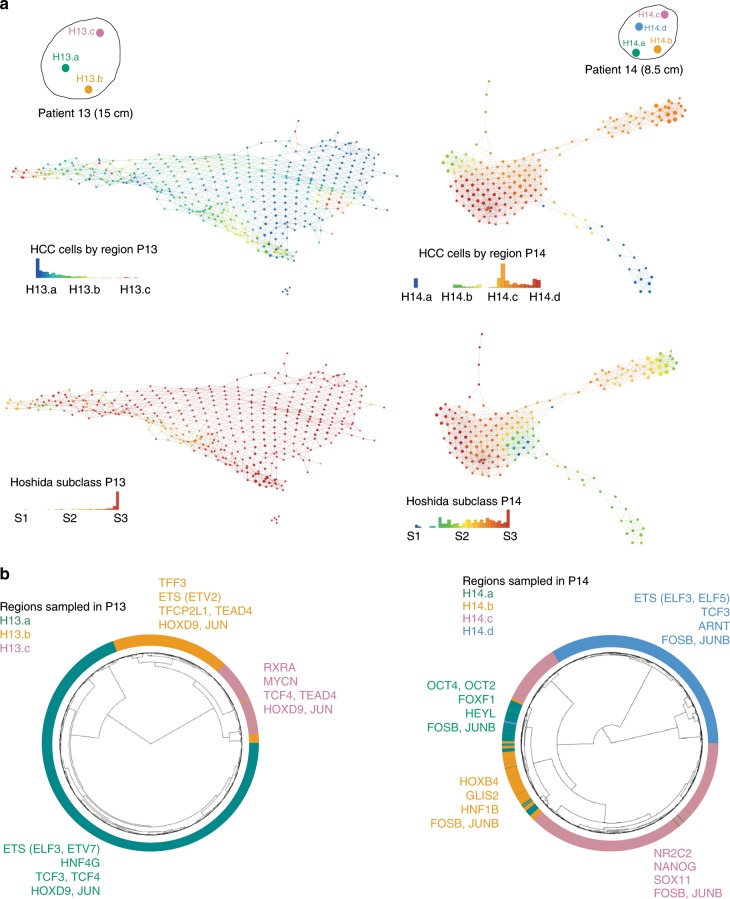
Clonal evolution of a tumor ecosystem depends on different selection pressures that are principally immune and treatment mediated. We integrate RNA-seq, DNA sequencing, TCR-seq and SNP array data across multiple regions of liver cancer specimens to map spatio-temporal interactions between cancer and immune cells. We investigate how these interactions reflect intra-tumor heterogeneity (ITH) by correlating regional neo-epitope and viral antigen burden with the regional adaptive immune response. Regional expression of passenger mutations dominantly recruits adaptive responses as opposed to hepatitis B virus and cancer-testis antigens. We detect different clonal expansion of the adaptive immune system in distant regions of the same tumor. An ITH-based gene signature improves single-biopsy patient survival predictions and an expression survey of 38,553 single cells across 7 regions of 2 patients further reveals heterogeneity in liver cancer. These data quantify transcriptomic ITH and how the different components of the HCC ecosystem interact during cancer evolution.


Conflict of interest statement

A.V. received consulting fees from Guidepoint and Fujifilm; advisory board fees from Exact Sciences, Nucleix and NGM Pharmaceuticals; and lecture fees from Exelixis. J.M.L. is receiving research support from Bayer HealthCare Pharmaceuticals, Eisai Inc, Bristol-Myers Squibb, Boehringer-Ingelheim and Ipsen, and consulting fees from Eli Lilly, Bayer HealthCare Pharmaceuticals, Bristol-Myers Squibb, Eisai Inc, Celsion Corporation, Exelixis, Merck, Ipsen, Roche, Genentech, Glycotest, Navigant, Leerink Swann LLC, Midatech Ltd, Fortress Biotech, Sprink Pharmaceuticals, Nucleix and Can-Fite Biopharma. The remaining authors declare no competing interests.

Figures

Fig. 1
Fig. 1. Summary of sampling and tumor purity data.
a Geographic distribution of the multiregional sampling (H: HCC sample; N: Nontumoral adjacent; Orange: Samples bulk sequenced; Green: Samples single-cell sequenced). b Regional tumor cell purity determined with ASCAT. c PCA of tumor and nontumor regions of all patients included in RNA-seq (Circles: HCC; Triangles: Adjacent nontumor).
Fig. 2
Fig. 2. Immunogenomic view of regional cancer-immune interactions in HCC and immune infiltrates.
a Number of RNA-seq reads mapping to VDJ loci grouped by pathological immune infiltrate assessment (ANOVA, error bars = SE, N = 38 samples. For each boxplot, the centre line represents the median. Upper and lower limits of each box represent the 75th and 25th percentiles, respectively. The whiskers represent the lowest data point still within 1.5× box size of the lower quartile and the highest data point still within 1.5× box size of the upper quartile). b Number of RNA-seq reads mapping to VDJ as a function of the number of unique reassembled CDR3 sequences (i.e., number of unique immune clones). c Scatter plot of TCR rearrangement frequencies between tumoral regions of patient 3 and 6. TCR rearrangements found at significantly higher frequencies in region H3.a/H6.a than H3.b/H6.b are filled in blue. TCR rearrangements found at significantly higher frequencies in region H3.b/H6.b than H3.a/H6.a are filled in red. d Paired H&E and immunofluorescence of CD3 and CD20 in high TIL burden regions of P02 and P06 (CD3: Red; CD20: Green; black bar 100 µm; white bar 50 µm, N = 3 independent experiments). Source data are provided as a Source Data file.
Fig. 3
Fig. 3. Neoantigen binding affinity.
a 2D density of log-scaled peptide binding affinity as a function of the VAF of somatic mutations across regions of P10 and P02. Dotted line depicts 50% inhibitory concentration (IC50) = 500 nM (lower IC50 means stronger binding and higher immunogenicity, HLA-I class A: circle; HLA-I class B: Triangle; HLA-I class C: square). b Empirical cumulative density plot of log-scaled binding affinity distribution for neoantigens according to VAF of expressed mutations. Kolmogorov-Smirnov test with one-sided alternative hypothesis. p-value is for rejecting the null in favor of the alternative. c Log R Ratio (LRR) mean as a function of DNA segmentation for each tumoral region. d Y-axis depicts one-sided Kolmogorov-Smirnov test p-value for regional sample pairs of neoantigen binding affinity profiles, i.e., a quantification of the relative shift of putative immunogenicity between paired tumor regions. X-axis depicts the difference in the number of RNA-seq reads mapped to the VDJ locus between the first and second region of each pair, i.e., the regional differences in adaptive immune burden. Sample pairs are colored based on tumor grade. Source data are provided as a Source Data file.
Fig. 4
Fig. 4. HBV antigen binding affinity and CTA immunogenicity.
a Expression distribution of HBV for adjacent nontumoral and tumoral regions across patients (HCC: Red; Adjacent nontumoral: Green, error bars = SE, N = 44 samples. For each boxplot, the centre line represents the median. Upper and lower limits of each box represent the 75th and 25th percentiles, respectively. The whiskers represent the lowest data point still within 1.5× box size of the lower quartile and the highest data point still within 1.5× box size of the upper quartile). b Empirical cumulative density plot of log-scaled binding affinity distribution across regions for both HBV and tumor neoepitopes. Kolmogorov-Smirnov test with one-sided alternative hypothesis. p-value is for rejecting the null in favor of the alternative. c Correlation plot of CTA enrichment score and RNA-seq reads mapped to the VDJ locus across regions. Source data are provided as a Source Data file.
Fig. 5
Fig. 5. Survival analyses of ITH models in TCGA-HCC.
a Kaplan-Meier curves with HCC DNA mutations and b DNA-based clonality estimates. c Kaplan-Meier curve for overall survival in the TCGA dataset after patients are classified based on the ITH signature. d Prediction error curves of competing parametric Cox proportional hazard models depicting time dependent Brier score for models built from principal components of the G3, EpCAM, 5-gene, and ITH signatures. Survival analysis was done using the Kaplan-Meier (log-rank) test.
Fig. 6
Fig. 6. HCC ecosystem and regional transcriptomic heterogeneity on single-cell RNA-seq.
a t-SNE plots of single-cell clusters colored by tumor region (H13.a: Green; H13.b: Yellow; H13.c: Pink) and b affiliation to cell lineage by gene expression. c Immunofluorescence staining for GNLY (red) and CD3 (green) in P14. Scale bar is 20 μm long in merge overview panels and 10 μm for all other panels. N = 3 independent experiments. Source data are provided as a Source Data file.
Fig. 7
Fig. 7. Regulatory network heterogeneity at the single-cell level.
a Geographic distribution of the multiregional sampling for single-cell RNA-seq. Topology data analysis of HCC-cell population across regions, as visualized with Ayasdi Platform. Cells are labeled based on tumor region and molecular subclass. Each dot represents a node, the size of which corresponds to the number of cells that were clustered to form that node. Lines or edges between nodes indicate they have cells in common. b Circular hierarchical clustering of HCC cells based on the activation status of TF derived from regulatory networks using SCENIC (H13.a: Green; H13.b: Yellow; H13.c: Pink). Source data are provided as a Source Data file.

References

    1. Villanueva A. Hepatocellular carcinoma. N. Engl. J. Med. 2019;380:1450–1462. doi: 10.1056/NEJMra1713263. - DOI - PubMed
    1. Amirouchene-Angelozzi Nabil, Swanton Charles, Bardelli Alberto. Tumor Evolution as a Therapeutic Target. Cancer Discovery. 2017;7(8):805–817. doi: 10.1158/2159-8290.CD-17-0343. - DOI - PubMed
    1. Jamal-Hanjani M, et al. Tracking the evolution of non-small-cell lung cancer. N. Engl. J. Med. 2017;376:2109–2121. doi: 10.1056/NEJMoa1616288. - DOI - PubMed
    1. McGranahan N, Swanton C. Cancer evolution constrained by the immune microenvironment. Cell. 2017;170:825–827. doi: 10.1016/j.cell.2017.08.012. - DOI - PubMed
    1. Zhang AW, et al. Interfaces of malignant and immunologic clonal dynamics in ovarian cancer. Cell. 2018;173:1755–1769.e22. doi: 10.1016/j.cell.2018.03.073. - DOI - PubMed

Publication types

MeSH terms