. 2020 Jan 15;11(1):284.
doi: 10.1038/s41467-019-14130-0.

Elastic straining of free-standing monolayer graphene

Affiliations

Elastic straining of free-standing monolayer graphene

Ke Cao et al. Nat Commun. .

Abstract

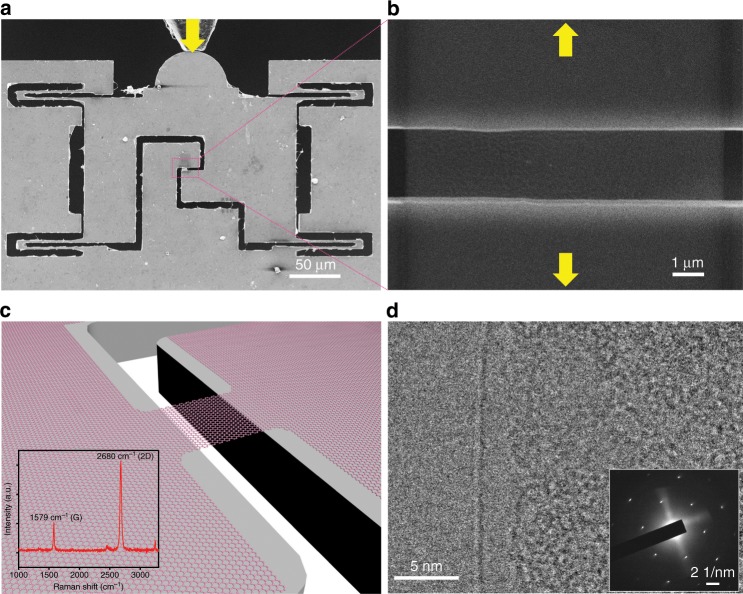
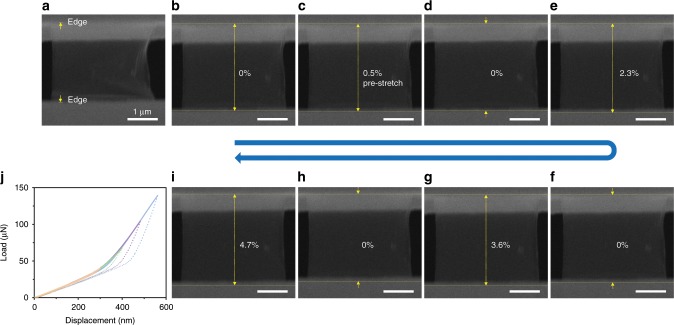
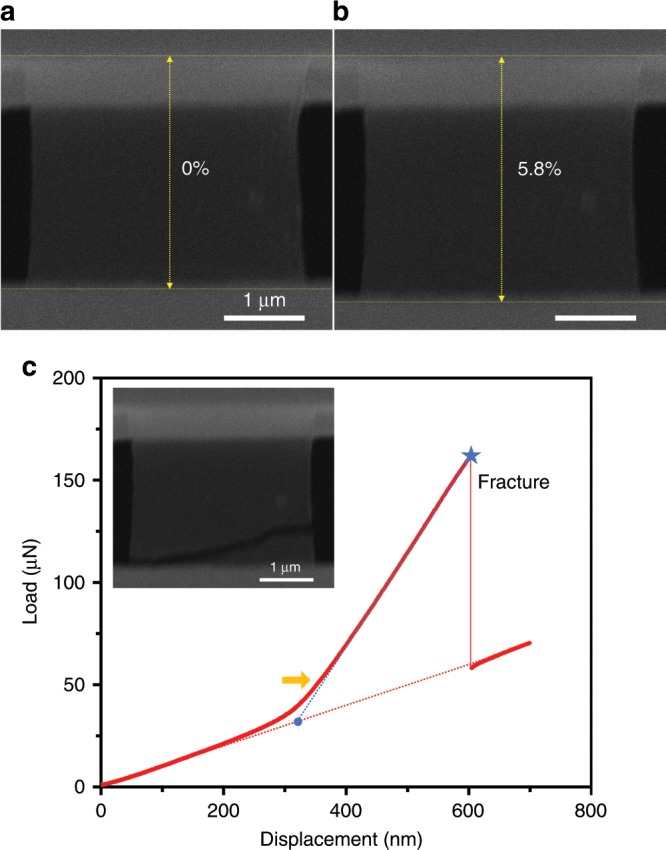
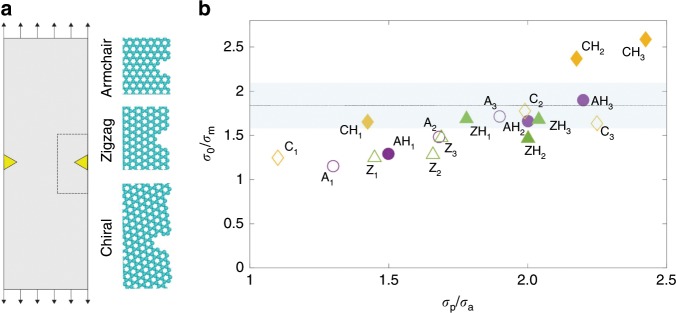
The sp2 nature of graphene endows the hexagonal lattice with very high theoretical stiffness, strength and resilience, all well-documented. However, the ultimate stretchability of graphene has not yet been demonstrated due to the difficulties in experimental design. Here, directly performing in situ tensile tests in a scanning electron microscope after developing a protocol for sample transfer, shaping and straining, we report the elastic properties and stretchability of free-standing single-crystalline monolayer graphene grown by chemical vapor deposition. The measured Young's modulus is close to 1 TPa, aligning well with the theoretical value, while the representative engineering tensile strength reaches ~50-60 GPa with sample-wide elastic strain up to ~6%. Our findings demonstrate that single-crystalline monolayer graphene can indeed display near ideal mechanical performance, even in a large area with edge defects, as well as resilience and mechanical robustness that allows for flexible electronics and mechatronics applications.


Conflict of interest statement

The authors declare no competing interests.

Figures

Fig. 1
Fig. 1. Experimental setup and characterization of free-standing graphene.
a In situ scanning electron microscope (SEM) tensile testing of a single-crystalline suspended graphene sample based on a push-to-pull (PTP) micromechanical device actuated by an external quantitative pico-indenter, the yellow arrow indicates the indentation direction during a tensile testing process. b Zoom-in view of the pink rectangle area in a showing a suspended graphene ribbon sample, whereas the yellow arrows indicate the tensile loading direction. c Illustration of a free-standing graphene ribbon sample suspended between the device gap. The inset in c shows Raman characterization of the monolayer graphene sample, the ratio of 2D to G is ~3. d TEM characterization of the edge of the suspended sample, inset showing the single-crystalline SAED pattern.
Fig. 2
Fig. 2. Fully recoverable elastic straining of a suspended graphene monolayer.
ai The sequence SEM images of the recorded video during the tensile testing procedure with the largest indentation displacement of 300 nm ac, 400 nm de, 500 nm fg, 600 nm hi. The yellow arrows in a indicate the edges of the PTP device gap (tilted view). The first cycle bc was to pre-stretch the relaxed free-standing single-crystalline graphene sample for marking the initial gauge length. The scale bar in all images are 1 μm. j The corresponding indenter load-displacement curves for cyclic elastic straining of the free-standing graphene (with unloading part marked in dash line).
Fig. 3
Fig. 3. Tensile fracture of the free-standing graphene.
a SEM image shows that the tested graphene sample under fully tightened state, with the scale bar shows 1 μm. b SEM image right before the tensile fracture, showing the peak strain state. c The corresponding indenter load-displacement curve, in which the blue dotted curve shows the linear fitting after the graphene sample being fully tightened and stretched (indicated with the orange arrow) while the inset shows the brittle fracture of the sample upon failure.
Fig. 4
Fig. 4. Molecular dynamics simulations on the fracture of free-standing graphene.
a MD simulations of graphene ribbon under tensile tests. Atomic structures of the representative edge defects (dash box in the tensile specimen) are illustrated in the ball-stick models. b The stress ratios measured from the simulation data, where σ0 is the intrinsic tensile strength of ideal graphene lattice, σm is the simulation value measured for graphene ribbons with edge defects. σp and σa are the peak principal (tensile) stress and average stress in the graphene ribbons. The simulation data is labeled by the name of defects that are summarized in Supplementary Fig. 3. The blue shadowed area in b shows the corresponding ratio of our experimentally measured tensile strengths versus the ideal graphene strength σ0.

References

    1. Novoselov KS, et al. Electric field effect in atomically thin carbon films. Science. 2004;306:666–669. doi: 10.1126/science.1102896. - DOI - PubMed
    1. Kelly, B. T. Physics of Graphite. (Applied Science, London, 1981).
    1. Geim AK, Novoselov KS. The rise of graphene. Nat. Mater. 2007;6:183–191. doi: 10.1038/nmat1849. - DOI - PubMed
    1. Liu F, Ming PM, Li J. Ab initio calculation of ideal strength and phonon instability of graphene under tension. Phys. Rev. B. 2007;76:064120. doi: 10.1103/PhysRevB.76.064120. - DOI
    1. Lee C, Wei X, Kysar JW, Hone J. Measurement of the elastic properties and intrinsic strength of monolayer graphene. Science. 2008;321:385–388. doi: 10.1126/science.1157996. - DOI - PubMed