. 2020 Jan 15;10(1):353.
doi: 10.1038/s41598-019-57257-2.

Postprandial Metabolism is Impaired in Overweight Normoglycemic Young Adults without Family History of Diabetes

Affiliations

Postprandial Metabolism is Impaired in Overweight Normoglycemic Young Adults without Family History of Diabetes

A Aneesh Kumar et al. Sci Rep. .

Abstract

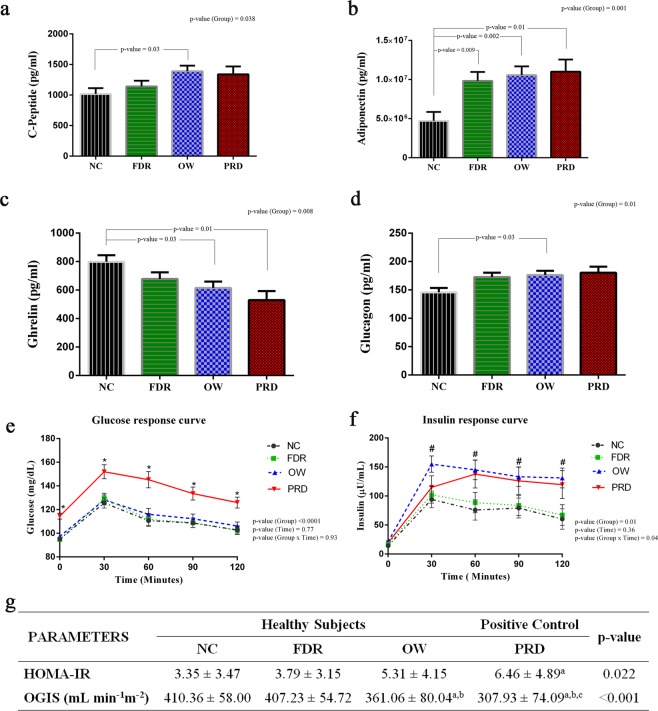
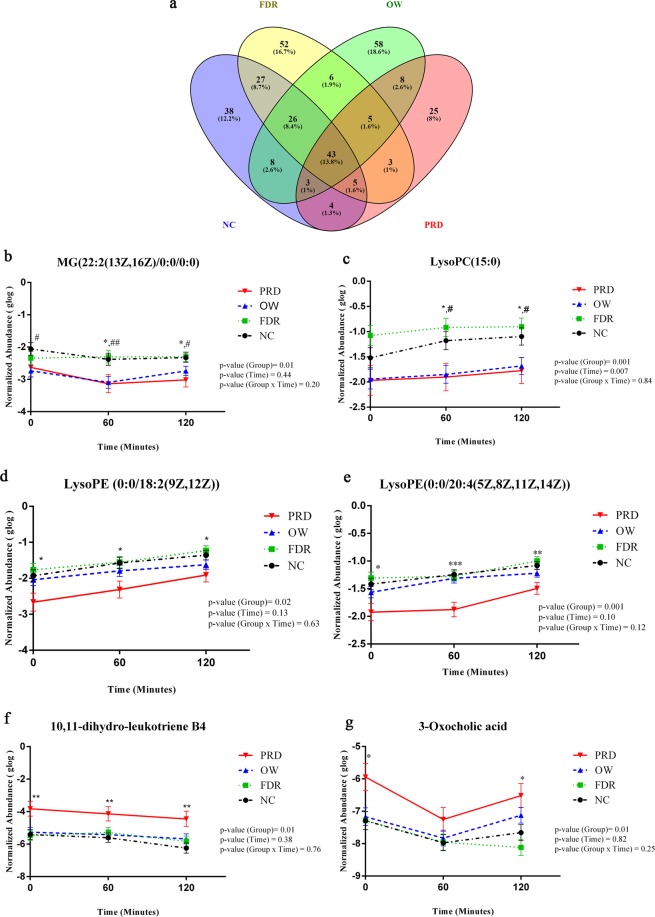
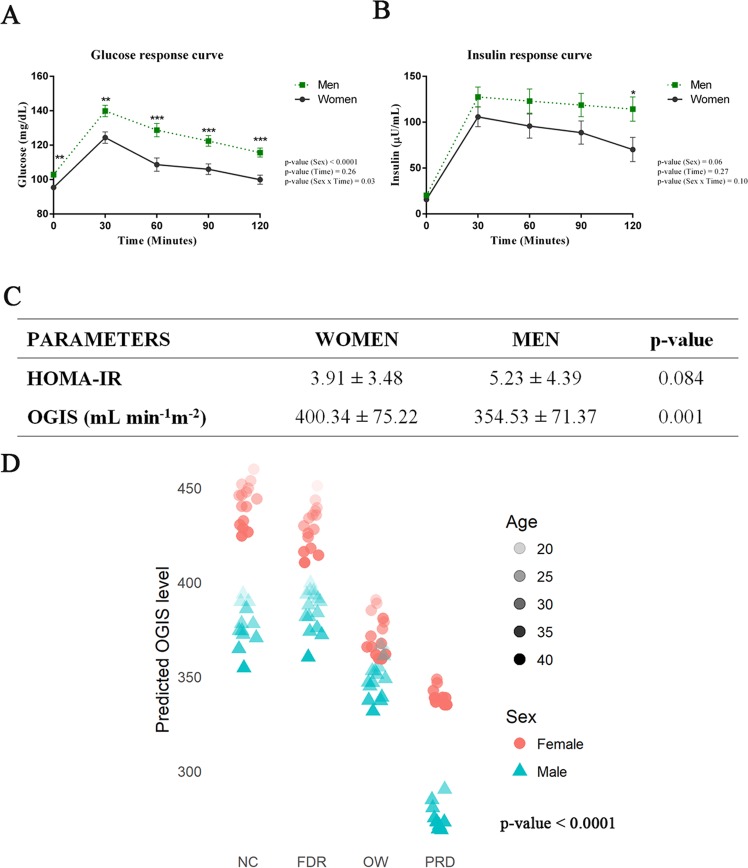
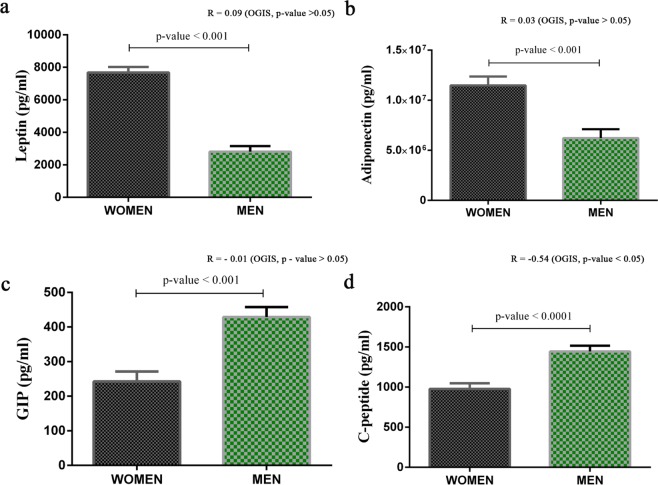
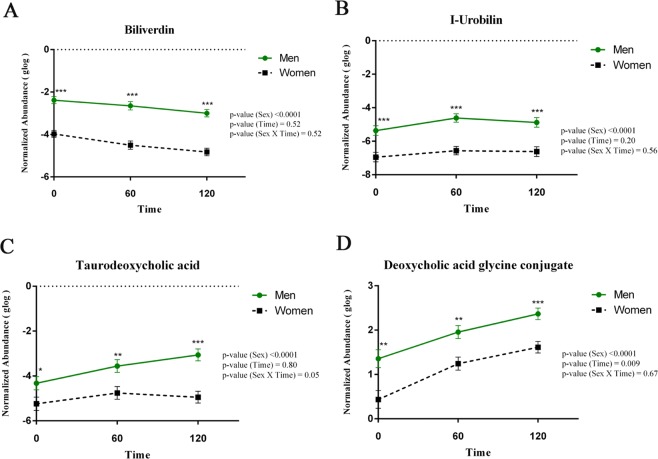
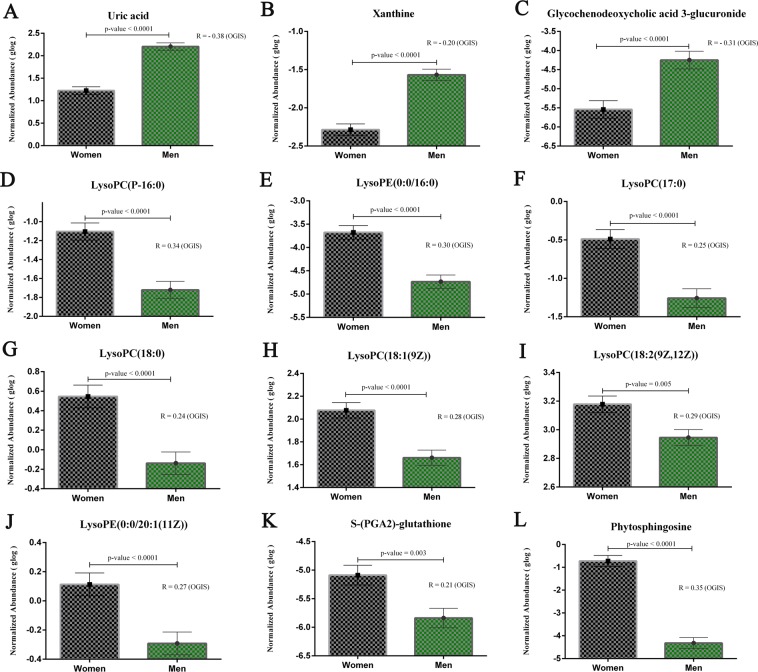
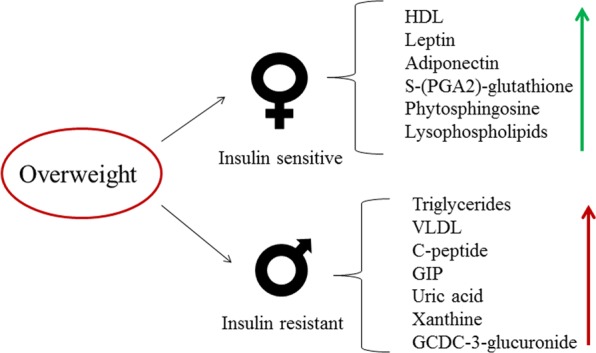
While the risk factors for Type 2 diabetes (T2DM) are known, early predictive markers of transition from normal to a prediabetes state are unidentified. We studied the basal metabolism and metabolic response to a mixed-meal challenge in 110 healthy subjects in the age group of 18 to 40 years (Male:Female = 1:1); grouped into first degree relatives of patients with T2DM (n = 30), those with a body mass index >23 kg/m2 but <30 kg/m2 (n = 30), those with prediabetes (n = 20) and normal controls (n = 30). We performed an untargeted metabolomics analysis of plasma and related that with clinical and biochemical parameters, markers of inflammation, and insulin sensitivity. Similar to prediabetes subjects, overweight subjects had insulin resistance and significantly elevated levels of C-peptide, adiponectin and glucagon and lower level of ghrelin. Metabolites such as MG(22:2(13Z, 16Z)/0:0/0:0) and LysoPC (15:0) were reduced in overweight and prediabetes subjects. Insulin sensitivity was significantly lower in men. Fasting levels of uric acid, xanthine, and glycochenodeoxycholic-3-glucuronide were elevated in men. However, both lysophospholipids and antioxidant defense metabolites were higher in women. Impaired postprandial metabolism and insulin sensitivity in overweight normoglycemic young adults indicates a risk of developing hyperglycemia. Our results also indicate a higher risk of diabetes in young men.


Conflict of interest statement

The authors declare no competing interests.

Figures

Figure 1
Figure 1
Effects of Family History of T2DM, Overweight, and Prediabetes on Insulin Sensitivity and Markers for Inflammation and T2DM. (ad) Markers for inflammation and T2DM in each group. ANCOVA analysis was performed to explore the level of risk markers in NC, FDR, OW, and PRD groups by selecting age and sex as covariates. A p-value of <0.05 was considered significant by applying Bonferroni correction procedure for multiple comparisons. The estimated marginal means (EMM) adjusted for age and sex were used for representation. (FDR- First-Degree Relatives of patients with T2DM, OW - Overweight, PRD - Prediabetes, and NC - Normal Healthy Control). (e,f) Repeated measures ANOVA were performed to explore the effect of time and risk factors on glucose and insulin response to a mixed-meal challenge. Symbols indicate significant difference from NC subjects compared to PRD (*) and OW (#). (g) A one-way ANOVA was conducted to compare the HOMA-IR and OGIS values in healthy groups such as NC, FDR, OW, and PRD group. Tukey HSD post hoc test (p < 0.05) was used for multiple comparisons (a-significantly different from NC, b- significantly different from FDR, and c- significantly different from OW).
Figure 2
Figure 2
Postprandial Metabolism is Different in Overweight individuals and Those with Prediabetes. (a)The metabolites changed significantly at 0 min, 60 min, and 120 min in NC, FDR, OW, and PRD groups were identified by repeated measures ANOVA analysis. Repeated measures ANOVA analysis was performed with MetaboAnalyst software and False Discovery Rate <0.05 was considered as significant. (bg) Metabolic alterations between study groups at 0 min, 60 min, and 120 min were identified by repeated measures ANOVA. Symbols indicate significant difference from NC subjects compared to PRD (*), OW (#), and FDR ($) by post hoc comparisons. A p-value of <0.05 was considered as significant by applying Bonferroni correction procedure for multiple comparisons. Error bar represents standard error (SE).
Figure 3
Figure 3
Men Have Reduced Insulin Sensitivity. (a) Postprandial Plasma Glucose Level. (b) Postprandial Plasma Insulin Level. Repeated measures ANOVA were performed to explore the effect of time and sex on glucose and insulin response to a mixed meal challenge. Asterisks (*) indicate a significant difference between sexes by post hoc comparisons. P-values were corrected by applying the Bonferroni correction procedure for multiple comparisons. (c) Student’s t-test (p-value <0.05) was used to compare the HOMA-IR and OGIS values in men and women. Error bar represents standard error (SE). (d) Linear mixed effect model for outcome variable OGIS predicted by using the GAD package in R (adjusted R2 = 0.33; p-value <0.0001).
Figure 4
Figure 4
Effects of Sex on Markers for Inflammation and T2DM. (ad) Comparison of markers for inflammation and T2DM in men (n = 55) and women (n = 55). ANCOVA analysis was performed to explore the level of risk markers in women and men by selecting age as a covariate. Estimated marginal means (EMM) adjusted for age was used for representation. Error bar represents standard error (SE). P-values were reported based on ANCOVA after adjusting age. Correlation coefficients and p-values from ANCOVA analysis are labeled in the figure and correlation coefficient values are provided in Supplementary Table S5.
Figure 5
Figure 5
The Postprandial Bile Secretion is Distinct in Men and Women. (ad) Repeated measures ANOVA were used to identify significantly altered bile acids between men and women at 3-time points. Asterisks (*) indicate a significant difference determined by post hoc comparisons. A p-value of <0.05 was considered significant by applying Bonferroni correction procedure for multiple comparisons. Error bar represents standard error (SE).
Figure 6
Figure 6
Metabolites Correlated with Insulin Sensitivity. (al) Pearson’s correlation analysis was performed between the intensity of metabolites at basal level and OGIS with corrplot package implemented in R 3.2.5. A correlation coefficient with a p-value of <0.05 was considered as significant. Estimated marginal means (EMM) adjusted for age was used for representation. Error bar represents standard error (SE). P-values were reported based on ANCOVA after adjusting age. Correlation coefficients and p-values from ANCOVA analysis are labeled in the figure and correlation coefficient values are provided in Supplementary Table S5.
Figure 7
Figure 7
Effect of Overweight and Sex on Insulin Sensitivity and Metabolome.

References

    1. Fonseca V. A. Defining and Characterizing the Progression of Type 2 Diabetes. Diabetes Care. 2009;32(suppl_2):S151–S156. doi: 10.2337/dc09-S301. - DOI - PMC - PubMed
    1. Issaka, A., Paradies, Y. & Stevenson, C. Modifiable and emerging risk factors for type 2 diabetes in Africa: A systematic review and meta-analysis protocol. Syst. Rev.7 (2018). - PMC - PubMed
    1. Nathan DM, et al. Impaired Fasting Glucose and Impaired Glucose Tolerance. Diabetes Care. 2007;30:753 LP–759. doi: 10.2337/dc07-9920. - DOI - PubMed
    1. Parhofer KG. Interaction between glucose and lipid metabolism: More than diabetic dyslipidemia. Diabetes and Metabolism Journal. 2015;39:353–362. doi: 10.4093/dmj.2015.39.5.353. - DOI - PMC - PubMed
    1. Sas KM, Karnovsky A, Michailidis G, Pennathur S. Metabolomics and diabetes: Analytical and computational approaches. Diabetes. 2015;64:718–732. doi: 10.2337/db14-0509. - DOI - PMC - PubMed

Publication types