

Encapsulation boosts islet-cell signature in differentiating human induced pluripotent stem cells via integrin signalling
- PMID: 31942009
- PMCID: PMC6962451
- DOI: 10.1038/s41598-019-57305-x
Encapsulation boosts islet-cell signature in differentiating human induced pluripotent stem cells via integrin signalling
Abstract
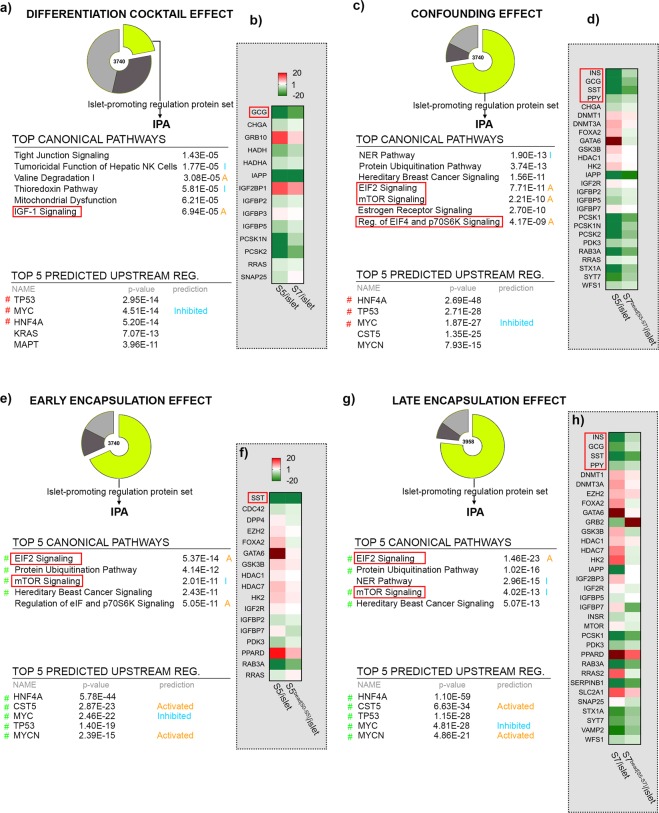
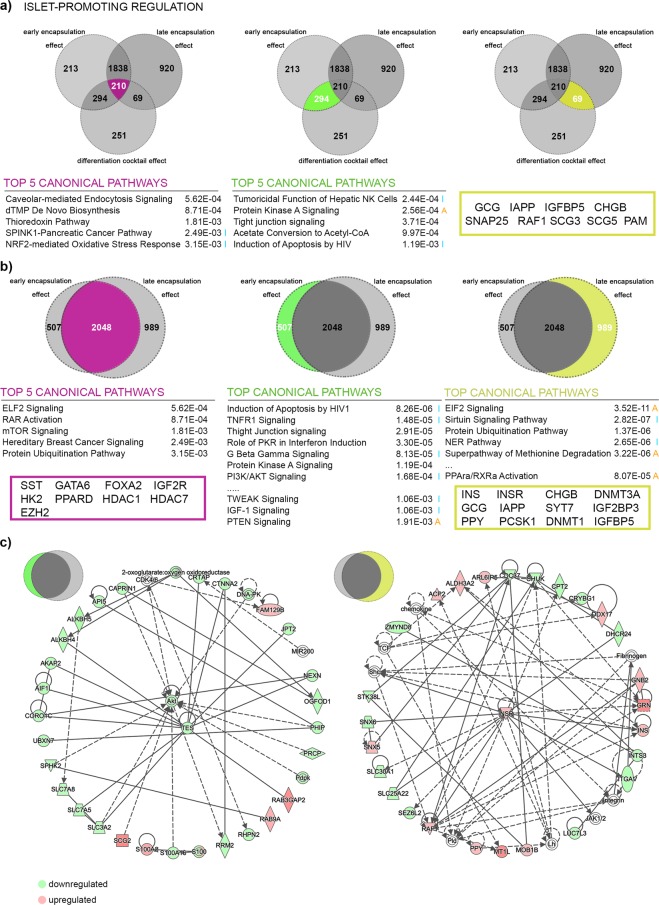
Cell replacement therapies hold great therapeutic potential. Nevertheless, our knowledge of the mechanisms governing the developmental processes is limited, impeding the quality of differentiation protocols. Generating insulin-expressing cells in vitro is no exception, with the guided series of differentiation events producing heterogeneous cell populations that display mixed pancreatic islet phenotypes and immaturity. The achievement of terminal differentiation ultimately requires the in vivo transplantation of, usually, encapsulated cells. Here we show the impact of cell confinement on the pancreatic islet signature during the guided differentiation of alginate encapsulated human induced pluripotent stem cells (hiPSCs). Our results show that encapsulation improves differentiation by significantly reshaping the proteome landscape of the cells towards an islet-like signature. Pathway analysis is suggestive of integrins transducing the encapsulation effect into intracellular signalling cascades promoting differentiation. These analyses provide a molecular framework for understanding the confinement effects on hiPSCs differentiation while confirming its importance for this process.
Conflict of interest statement
The authors declare no competing interests.
Figures


Similar articles
-
Alginate encapsulation of human embryonic stem cells to enhance directed differentiation to pancreatic islet-like cells.Tissue Eng Part A. 2014 Dec;20(23-24):3198-211. doi: 10.1089/ten.TEA.2013.0659. Tissue Eng Part A. 2014. PMID: 24881778 Free PMC article.
-
Extracellular matrix proteins refine microenvironments for pancreatic organogenesis from induced pluripotent stem cell differentiation.Theranostics. 2025 Jan 13;15(6):2229-2249. doi: 10.7150/thno.104883. eCollection 2025. Theranostics. 2025. PMID: 39990212 Free PMC article.
-
An inhibitor of fibroblast growth factor receptor-1 (FGFR1) promotes late-stage terminal differentiation from NGN3+ pancreatic endocrine progenitors.Sci Rep. 2016 Oct 27;6:35908. doi: 10.1038/srep35908. Sci Rep. 2016. PMID: 27786288 Free PMC article.
-
Conversion of embryonic stem cells into pancreatic beta-cell surrogates guided by ontogeny.Regen Med. 2006 May;1(3):327-36. doi: 10.2217/17460751.1.3.327. Regen Med. 2006. PMID: 17465786 Review.
-
Regenerative medicine for diabetes: differentiation of human pluripotent stem cells into functional β-cells in vitro and their proposed journey to clinical translation.Vitam Horm. 2014;95:223-48. doi: 10.1016/B978-0-12-800174-5.00009-0. Vitam Horm. 2014. PMID: 24559920 Review.
Cited by
-
Icariin Promote Stem Cells Regeneration and Repair Acinar Cells in L-arginine / Radiation -Inducing Chronic Pancreatitis in Rats.Dose Response. 2020 Oct 30;18(4):1559325820970810. doi: 10.1177/1559325820970810. eCollection 2020 Oct-Dec. Dose Response. 2020. PMID: 33192204 Free PMC article.
-
Artificial Cell Encapsulation for Biomaterials and Tissue Bio-Nanoengineering: History, Achievements, Limitations, and Future Work for Potential Clinical Applications and Transplantation.J Funct Biomater. 2021 Nov 30;12(4):68. doi: 10.3390/jfb12040068. J Funct Biomater. 2021. PMID: 34940547 Free PMC article. Review.
-
Insulin/Glucose-Responsive Cells Derived from Induced Pluripotent Stem Cells: Disease Modeling and Treatment of Diabetes.Cells. 2020 Nov 12;9(11):2465. doi: 10.3390/cells9112465. Cells. 2020. PMID: 33198288 Free PMC article. Review.
-
Advanced therapy to cure diabetes: mission impossible is now possible?Front Cell Dev Biol. 2024 Nov 19;12:1484859. doi: 10.3389/fcell.2024.1484859. eCollection 2024. Front Cell Dev Biol. 2024. PMID: 39629270 Free PMC article. Review.
-
In vitro generation of transplantable insulin-producing cells from canine adipose-derived mesenchymal stem cells.Sci Rep. 2022 Jun 1;12(1):9127. doi: 10.1038/s41598-022-13114-3. Sci Rep. 2022. PMID: 35650303 Free PMC article.
References
Publication types
MeSH terms
Substances
Grants and funding
LinkOut - more resources
Full Text Sources
Molecular Biology Databases
