. 2020 Jan 15;10(1):392.
doi: 10.1038/s41598-019-57357-z.

Feasibility Study of MRI Muscles Molecular Imaging in Evaluation of Early Post-Mortem Interval

Affiliations

Feasibility Study of MRI Muscles Molecular Imaging in Evaluation of Early Post-Mortem Interval

Daniela Sapienza et al. Sci Rep. .

Abstract

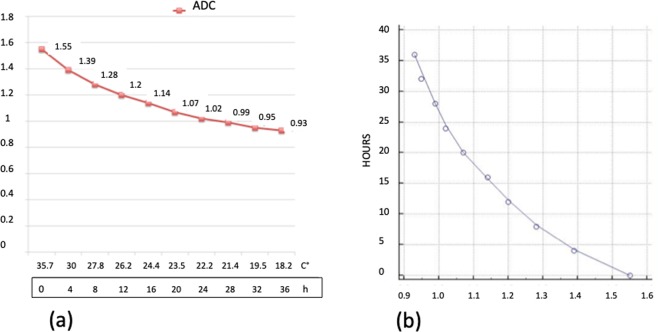
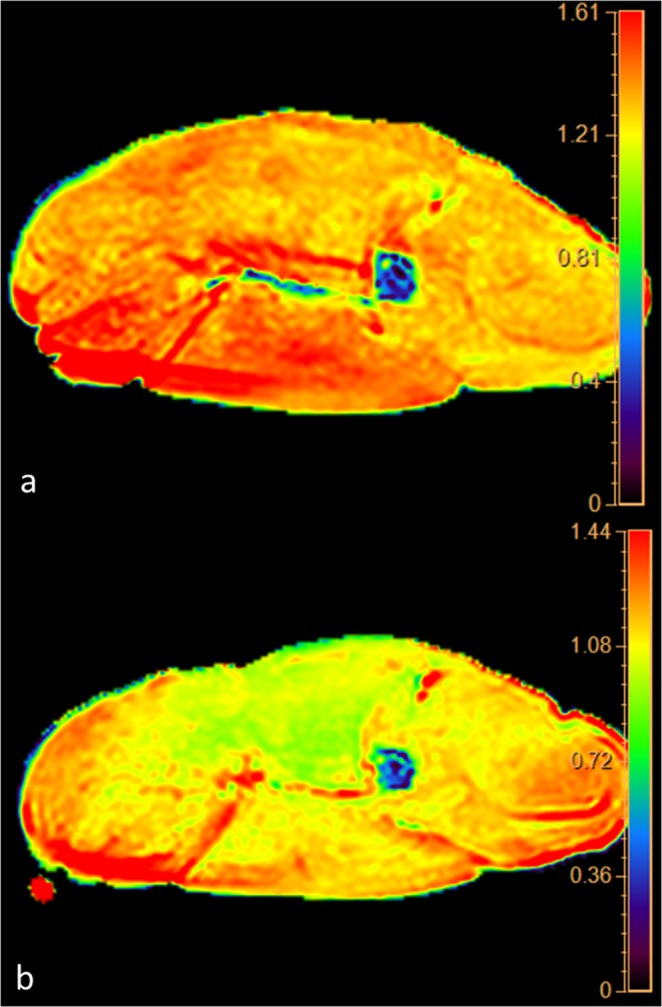
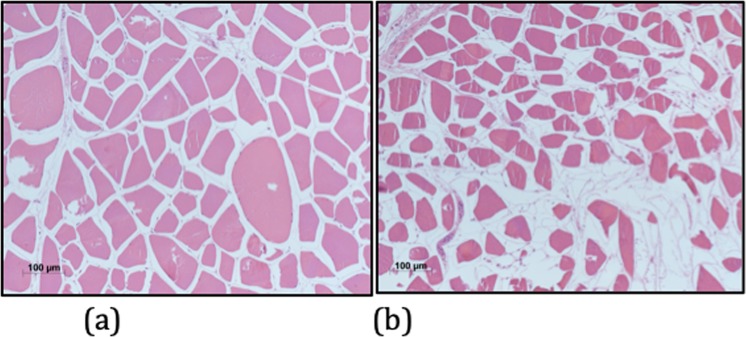
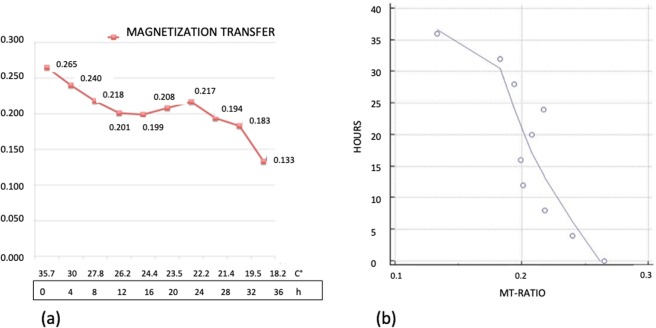
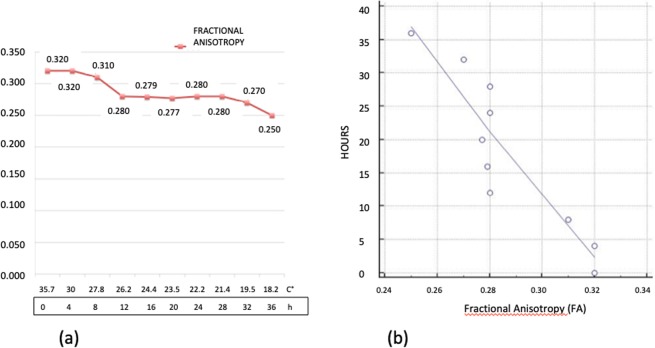
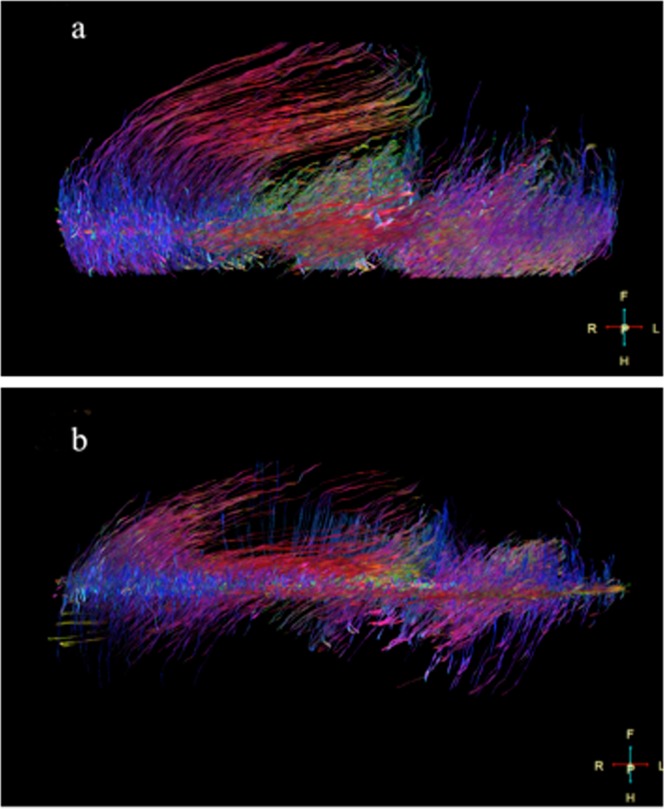
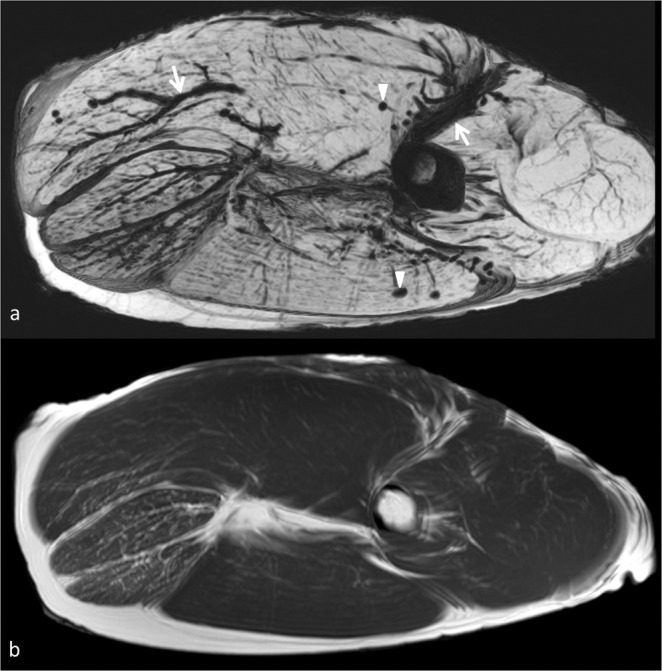
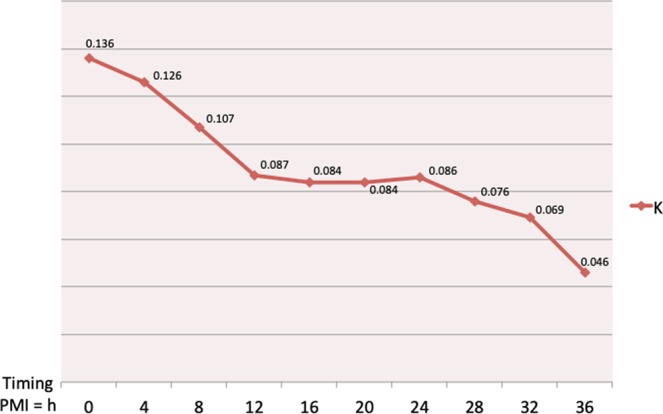
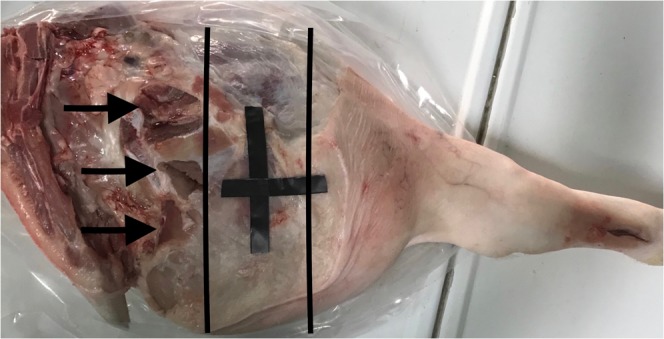
Estimating early postmortem interval (EPI) is a difficult task in daily forensic activity due to limitations of accurate and reliable methods. The aim of the present work is to describe a novel approach in the estimation of EPI based on quantitative magnetic resonance molecular imaging (qMRMI) using a pig phantom since post-mortem degradation of pig meat is similar to that of human muscles. On a pig phantom maintained at 20° degree, using a 1.5 T MRI scanner we performed 10 scans (every 4 hours) monitoring apparent diffusion coefficient (ADC), fractional anisotropy (FA) magnetization transfer ration (MTR), tractography and susceptibility weighted changes in muscles until 36 hours after death. Cooling of the phantom during the experiment was recorded. Histology was also obtained. Pearson's Test was carried out for time correlation between post-mortem interval and MRI data. We found a significative inverse correlation between ADC, FA, MT values and PMI. Our preliminary data shows that post-mortem qMRMI is a potential powerful tool in accurately determining EPI and is worth of further investigation.


Conflict of interest statement

The authors declare no competing interests.

Figures

Figure 1
Figure 1
(a) Graphic of the changes of ADC. On the axis of abscissas are represented the time and the changes of temperature. (b) Graphic of the correlation evaluated by Pearson’s Test between ADC data and post-mortem timing.
Figure 2
Figure 2
Panel of the color coded maps obtained at time 0 (upper map) and at 36 hours (lower map). Note the change of color from red to yellow-green representing decrease of the water diffusion in muscles.
Figure 3
Figure 3
(a) Histological transverse section of pig muscle at 12 hours. Muscle fibers are swollen and surrounded by edematous spaces (Haematoxylin and eosin stain; original magnification, x100). (b) Histological transverse section of pig muscle at 36 hours. Muscle fibers are shrunk or missing and replaced by fluid-filled channels (Haematoxylin and eosin stain; original magnification, x100).
Figure 4
Figure 4
(a) Graphic of the changes of Magnetization Transfer Ratio. On the axis of abscissas are represented the time and the changes of temperature. (b) Graphic of the correlation evaluated by Pearson’s Test between Magnetization Transfer Ratio data and post-mortem timing.
Figure 5
Figure 5
(a) Graphic of the changes of Fractional Anisotropy. On the axis of abscissas are represented the time and the changes of temperature. (b) Graphic of the correlation evaluated by Pearson’s Test between Fractional Anisotropy data and post-mortem timing.
Figure 6
Figure 6
(a) Tractography obtained from diffusion tensor sequence at time 0. The fiber muscles are well depicted and appear quite compact (b). Tractography obtained at 36 hours shows a dramatic loss of muscles fibers. The tractography correlates very well with histology shown in Fig. 3b.
Figure 7
Figure 7
Panel depicting the high sensititivity of susceptibility weighted imaging in demonstrating air in the vessels and tissue. Susceptibility weighted image shows with great advantage air in the intramuscular and  intermuscular vessels (arrows) and in the muscles (arrowheads). In T1 weighted image obtained in the same session (lower image) intravascular air cannot be seen.
Figure 8
Figure 8
The curve of the K factor shows that ADC, FA e MTR are temperature independent variables sensitive to PMI.
Figure 9
Figure 9
Picture of the pig leg. Black lines shows the area scanned with MRI. Arrows indicates the points used to carry out biopsies and temperature measurements.

Similar articles

Cited by

References

    1. Henßge C. Todeszeitschätzungen durch die mathematische Beschreibung der rektalen Leichenabkühlung unter verschiedenen Abkühlungsbedingungen. Z Rechtsmed. 1981;87:147–178. doi: 10.1007/BF00204763. - DOI - PubMed
    1. Henßge C, et al. Experiences with a compound method for estimating the time since death. I. Rectal temperature nomogram for time since death. Int J Legal Med. 2000;113:303–319. doi: 10.1007/s004149900089. - DOI - PubMed
    1. Mall G, Eisenmenger W. Estimation of time since death by heat-flow Finite-Element model part II: application to non-standard cooling conditions and preliminary results in practical casework. Leg Med (Tokyo) 2005;7:69–80. doi: 10.1016/j.legalmed.2004.06.007. - DOI - PubMed
    1. Hubig M, Muggenthaler H, Sinicina I, Mall G. Temperature based forensic death time estimation: The standard model in experimental test. Leg Med (Tokyo) 2015;17:381–387. doi: 10.1016/j.legalmed.2015.05.005. - DOI - PubMed
    1. Mathur A, Agrawal YK. An overview of methods used for estimation of time since death. Australian Journal of Forensic Sciences. 2011;43:275–285. doi: 10.1080/00450618.2011.568970. - DOI