. 2020 Jan;577(7792):689-694.
doi: 10.1038/s41586-019-1912-x. Epub 2020 Jan 15.

VEGF-C-driven lymphatic drainage enables immunosurveillance of brain tumours

Affiliations

VEGF-C-driven lymphatic drainage enables immunosurveillance of brain tumours

Eric Song et al. Nature. 2020 Jan.

Erratum in

Abstract

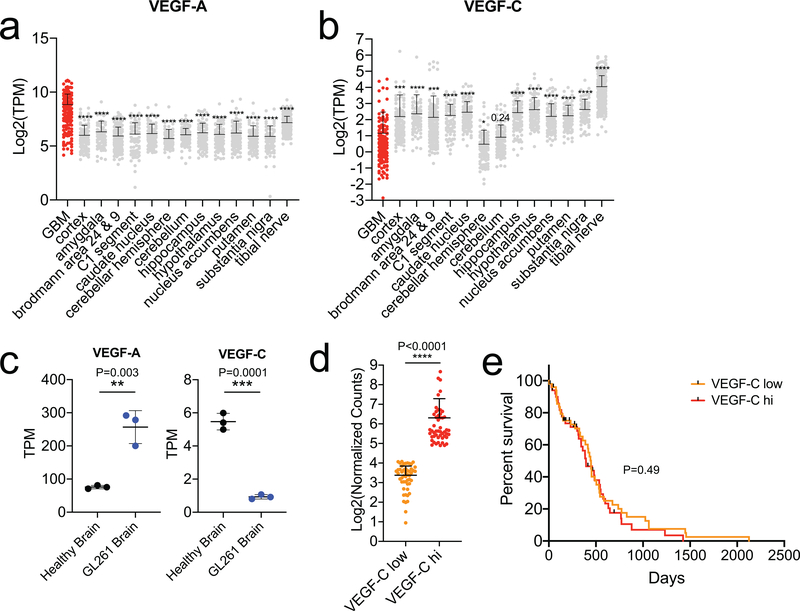
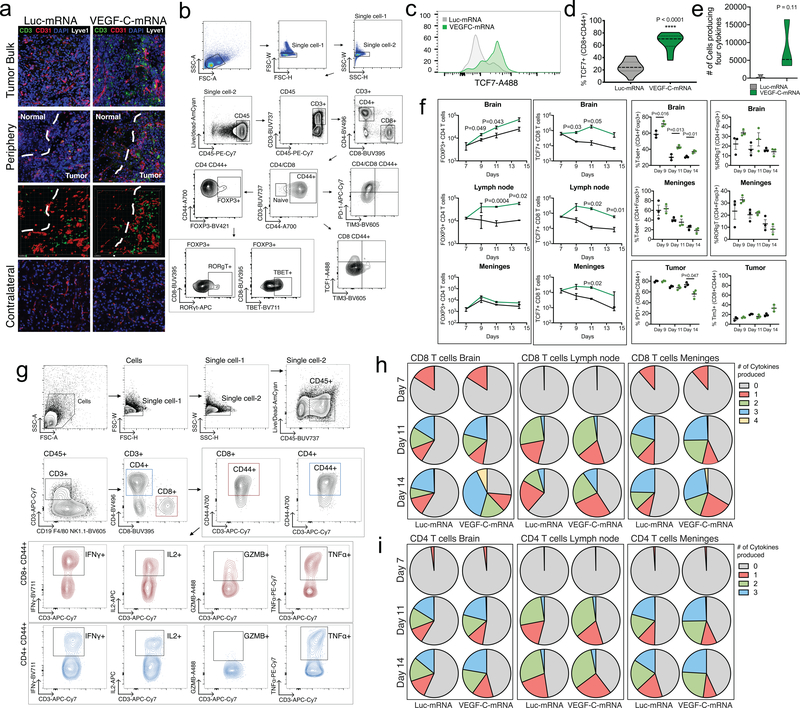
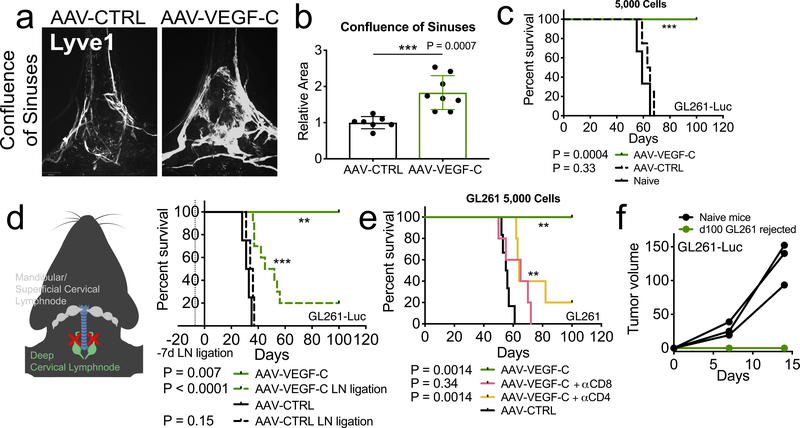
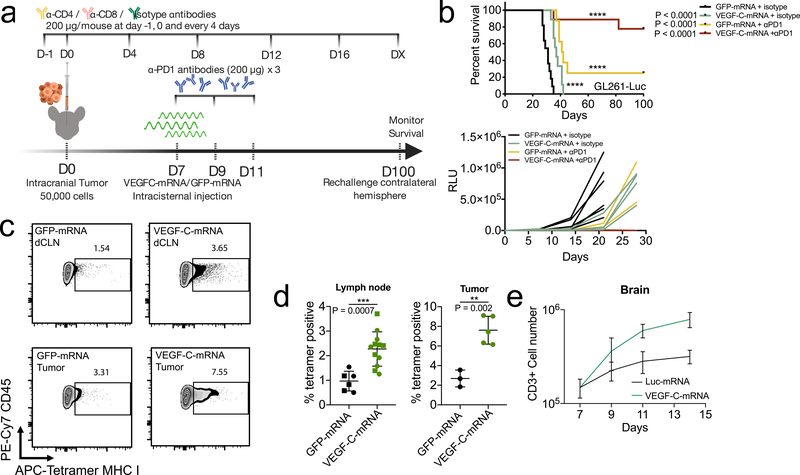
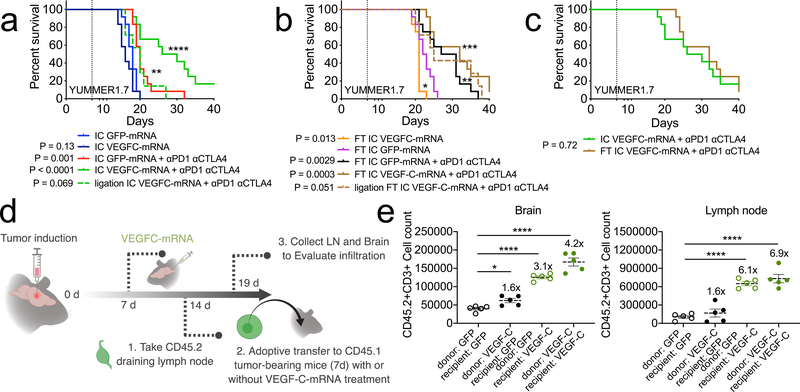
Immune surveillance against pathogens and tumours in the central nervous system is thought to be limited owing to the lack of lymphatic drainage. However, the characterization of the meningeal lymphatic network has shed light on previously unappreciated ways that an immune response can be elicited to antigens that are expressed in the brain1-3. Despite progress in our understanding of the development and structure of the meningeal lymphatic system, the contribution of this network in evoking a protective antigen-specific immune response in the brain remains unclear. Here, using a mouse model of glioblastoma, we show that the meningeal lymphatic vasculature can be manipulated to mount better immune responses against brain tumours. The immunity that is mediated by CD8 T cells to the glioblastoma antigen is very limited when the tumour is confined to the central nervous system, resulting in uncontrolled tumour growth. However, ectopic expression of vascular endothelial growth factor C (VEGF-C) promotes enhanced priming of CD8 T cells in the draining deep cervical lymph nodes, migration of CD8 T cells into the tumour, rapid clearance of the glioblastoma and a long-lasting antitumour memory response. Furthermore, transfection of an mRNA construct that expresses VEGF-C works synergistically with checkpoint blockade therapy to eradicate existing glioblastoma. These results reveal the capacity of VEGF-C to promote immune surveillance of tumours, and suggest a new therapeutic approach to treat brain tumours.


Conflict of interest statement

Competing Interests

Akiko Iwasaki, Eric Song, and Jean-Leon Thomas have filed a patent related to the manuscript as inventors. Application number, US 62/768,390; status of application, provisional; specific aspect of manuscript covered in patent application. Kari Alitalo is an inventor of several patents related to VEGF-C. He or his wife currently have no income, stock or other benefits from companies related to work in the manuscript. Helsinki University is a shareholder in companies related to the use of VEGF-C. Marcus Bosenberg is a consultant for Eli Lilly and Company.

Figures

Extended Data Fig 1.
Extended Data Fig 1.. Increased meningeal lymphatic vasculature confers protection against intracranial glioblastoma challenge in a draining lymph node and T cell dependent manner and provides long-term protection without BBB perturbance.
a-b Mice inoculated with 50,000 GL261-Luc cells were imaged every 7 days and showed consistent and reliable tumor growth (n = 4). c GL261-Luc shows lethality in mice in a cell number dependent way (500 cells, n = 5; 5000 cells, n = 5; 50,000 cells, n = 9). d Mice were injected I.V. with 70k MW Dextran-fluorescein and euthanized after 2 hours. Brains were collected and cryosectioned (n = 4) Experiment was repeated independently with similar results. e Mice were injected I.V. with 0.5% Evans Blue. After 2 hours mice were perfused intraventricularly and EB was extracted from brain tissue using DMF (WT, LPS, AAV-VEGF-C, VEGF-C-mRNA, n = 4; Tumor, Tumor + VEGF-C-mRNA, n = 5). f Representative image of AAV-CTRL and AAV-VEGF-C treated mice after implantation of 5,000 cells. Experiment was repeated independently with similar results. g Long term survival monitoring of mice after AAV-VEGF-C and AAV-CTRL injections into the cisterna magna (n = 5). h-i C57BL/6 mice received injection of AAV-CTRL or AAV-VEGF-C intra-cisternally (icm) through the cisterna magna. Six to eight weeks later, mice were euthanized and the dura was collected to image the lymphatic vasculature (LYVE1+) in the superior sagittal sinus (AAV-CTRL, n = 4; AAV-VEGF-C, n = 5). j C57BL/6 mice injected with CTRL-AAV or AAV-VEGF-C icm two months prior were implanted with 50,000 GL261-Luc cells in the striatum and monitored for survival (AAV-CTRL, n = 4; AAV-VEGF-C, n = 5) or. k AAV-CTRL or AAV-VEGF-C treated mice were depleted of CD4 or CD8 T cells using anti-CD4 (GK1.5) or anti-CD8 (YTS169.4) antibodies starting one day before tumor inoculation (GL261) and re-dosed every four days after (k; AAV-CTRL, n = 4; AAV-VEGF-C, n = 5; AAV-VEGF-C + αCD8, n = 4; AAV-VEGF-C + αCD4, n = 5). l muMT, B cell deficient mice were injected with AAV-CTRL or AAV-VEGF-C and challenged with 50,000 GL261-Luc cells two months after (AAV-CTRL, n = 5; muMT AAV-CTRL, n = 3; muMT AAV-VEGF-C, n = 5). m Schematic of mice procedure schedule in Fig 1f and Extended Data Fig 1m. Mice injected with AAV-CTRL or AAV-VEGF-C that survived over 100 days after 5,000 GL261-Luc challenge were re-challenged with 500,000 GL261-Luc in the flank. m IVIS imaging of mice ten days after flank re-challenge, and measurement of tumors at day 7 and 15 (n = 3). Data are pooled from two independent experiments (h-m). Data are mean ± S.D. *P < 0.05; **P < 0.01; ***P <0.001; ****P<0.0001 (two-tailed unpaired Student’s t-test, two-sided Log-rank Mantel-Cox test)
Extended Data Fig 2.
Extended Data Fig 2.. Correlation of VEGF-C expression profiles between human and murine GBM.
a-c RNAseq data of tumor tissue and healthy brain tissue from different regions of the tissue (TCGA (phs000178.v10.p8) and GTEX respectively (v6). a Expression profile of VEGF-A. b Expression profile of VEGF-C (GBM, n = 147; cortex, n = 133; amygdala, n = 81; Brodmann area 24&9, n = 215; C1 segment, n = 75; caudate nucleus, n = 135; cerebellar hemisphere, n = 115; cerebellum, n = 146; hippocampus, n = 103; hypothalamus, n = 101; nucleus accumbens, n = 125; putamen, n = 103; substantia nigra, n = 72; tibial nerve, n = 329). c RNAseq data of mice brain and GL261 tumors from mice brains were analyzed (n = 3 biologically independent samples). d ONCLNC (Onclnc.org) data of GBM patients stratified into two groups (VEGF-C low, lower 33%; VEGF-C hi, upper 33%; n = 50). e Kaplan Meier Survival curve of patients from e (n = 50). Data are mean ± S.D. *P < 0.05; **P < 0.01; ***P <0.001; ****P<0.0001 (two-tailed unpaired Student’s t-test, two-sided Log-rank Mantel-Cox test, Pearson’s correlation)
Extended Data Fig 3.
Extended Data Fig 3.. VEGF-C-mRNA validation in vitro and in vivo uptake/expression tropism.
a cDNA sequence of VEGF-C used for mRNA production. b 5-methyl cytosine and pseudo uridine were used to substitute all of cytosine and uridine in the mRNA. c VEGF-C-mRNA was transfected into HEK293T cells and cell lysate and media were collected to detect full length, and secreted intermediate and processed peptides. d VEGF-C-mRNA (5 μg) was delivered in vivo into the cisterna magna of mice using a JETPEI polyplex system. Six hours after, mice CSF was collected using a capillary tube, filtered with an amicon filter and the wash-through was used to run a western blot (each lane is n = 10 animals pooled). e Raw western blot images of Extended Data Fig 4c (gel 1: column 1, control; 2, Cy5-GFP-mRNA; 3, VEGF-C-mRNA; 4, control; 5, Cy5-GFP-mRNA; 6, VEGF-C-mRNA) (gel 2: column 1, control; 2, Cy5-GFP-mRNA; 3, VEGF-C-mRNA) and Extended Data Fig 4d (gel 3: column 1–3 Cy5-GFP-mRNA; column 4–6 Cy5-GFP-mRNA; 7–9 recombinant human VEGF-C in increasing concentration). Experiments were repeated twice independently with similar results. f VEGF-C-mRNA and Cy5 labeled GFP-mRNA was mixed at a 1:1 ratio and delivered in vivo with JETPEI. 15 minutes later, mice were euthanized and whole skull cap was imaged to observe the distribution of mRNA particles. Experiments were repeated independently twice with similar results. g-hVEGF-C-mRNA and Cy5 labeled GFP-mRNA were mixed at a 1:1 ratio and delivered in vivo with JETPEI. 24 h later brains, meninges and lymph nodes of treated mice were collected for flow cytometry to measure % Cy5 positive cells in each compartment (control, n = 6; Cy5-mRNA, n = 9; data are pooled from two independent experiments). i CSF, Meninges, Brain and Serum were collected at 2 month-time point (AAV-CTRL, AAV-VEGF-C), 24 h-time point (GFP-mRNA, VEGF-C-mRNA), or days 7 and 28 after tumor inoculation and ELISA was performed to detect VEGF-C (CSF; AAV-VEGF-C, n = 6; other groups n = 3; 5 animals were pooled for each sample) (Meninges; AAV-VEGF-C, n = 6; d7 tumor, n =3; other groups n = 5). (Brain; AAV-CTRL, GFP-mRNA, n = 6; AAV-VEGF-C, VEGF-C-mRNA, n = 5; d7 tumor, n = 3; d28 tumor, n = 7) (Serum; n = 3). Data are mean ± S.D. *P < 0.05; **P < 0.01; ***P <0.001; ****P<0.0001 (two-tailed unpaired Student’s t-test)
Extended Data Fig 4.
Extended Data Fig 4.. VEGF-C signals specifically in lymphatic endothelial cells in the meninges and dCLNs and provides survival benefits in an administration timepoint dependent manner.
(a) Gating strategy for lymphatic endothelial cells (LECs) and blood endothelial cells (BECs). (b) Concatenated images of LECs and BECs from meninges and lymph node depicting AKT-phosphorylation intensity. Experiment was repeated independently with similar results. (c) Quantification of AKT(pS473) positive population and MFI within LECs and BECs in the meninges and dCLNs (meninges; WT, n = 5; AAV-VEGF-C, tumor + Luc-mRNA, tumor + VEGF-C-mRNA, n = 8) (lymph nodes; WT, n = 5; AAV-VEGF-C, n = 8; tumor + Luc-mRNA, n = 7; tumor + VEGF-C-mRNA, n = 8). (d) Fluorescent microscope images of dCLN after VEGF-C-mRNA treatment in tumor bearing mice (CD31, red; LYVE1, green; DAPI, blue). (e) Fluorescent microscope images of meninges after VEGF-C-mRNA treatment in tumor bearing mice (CD31, red; LYVE1, green; DAPI, blue). Experiment was repeated independently with similar results. f-h Mice were treated with AAV-VEGF-C or VEGF-C-mRNA at different timepoints relative to GL261-Luc tumor inoculation (d0). Tumor growth kinetics (g-h) and survival (f) was monitored (n = 5 for all groups). *P < 0.05; **P < 0.01; ***P <0.001; ****P<0.0001 (two-sided Log-rank Mantel-Cox test). Data are mean ± S.D. *P < 0.05; **P < 0.01; ***P <0.001; ****P<0.0001 (two-tailed unpaired Student’s t-test)
Extended Data Fig 5.
Extended Data Fig 5.. Therapeutic delivery of VEGF-C potentiates checkpoint inhibitor therapy even at late stages of tumor development.
a (Fig 3c–d) Cell number quantification per tumor of bearing hemisphere or lymph node using CountBright absolute beads and autocounter (see methods for details) (Lymph node; GFP-mRNA n = 6; VEGF-C-mRNA, n = 12) (Tumor; GFP-mRNA n = 3; VEGF-C-mRNA, n = 5). b Mice that rejected tumors after VEGF-C-mRNA + anti-PD1 (RMP1–14) combination therapy were re-challenged in the contralateral hemisphere and observed for survival (Naïve, n = 5; d100 rejected, n = 4). c T cells from lymph nodes and spleens from mice that rejected tumors after VEGF-C-mRNA + anti-PD1 (RMP1–14) combination therapy or naïve WT mice were isolated and transferred into naïve WT mice intravenously. 24 h later, GL261 tumors were inoculated intracranially and observed for survival (WT, n = 5; WT Naïve T cell transfer, n = 5; WT Memory T cell transfer, n = 7). d Mice inoculated with 50,000 GL261-Luc cells were treated with VEGF-C-mRNA/GFP-mRNA (day 7) and with either anti-PD1 (RMP1–14) antibodies or isotype antibodies (day 7, 9 and 11) and monitored for survival. Mice were depleted of CD4 or CD8 T cells using anti-CD4 (GK1.5) or anti-CD8 (YTS169.4) antibodies starting one day before tumor inoculation and re-dosed every four days after (VEGF-C-mRNA + αPD-1, n = 6; GFP-mRNA + αPD-1, n = 6; VEGF-C-mRNA + αPD-1 + αCD4, n = 5; VEGF-C-mRNA + αPD-1 + αCD8, n = 5). e Schematic for experiment design of f-g. f-g Mice inoculated with 50,000 CT2A-BFP cells (f) or CT2A cells (g) were treated with VEGF-C-mRNA/GFP-mRNA (day 7) and with either anti-PD1(RMP1–14) and/or anti-4–1BB (LOB12.3) antibodies or PBS (day 7, 9 and 11) and monitored for survival (f VEGF-C-mRNA + αPD1 + α4–1BB, n = 5; GFP-mRNA + αPD1 + α4–1BB, n = 5; VEGF-C-mRNA + PBS, n = 4; GFP-mRNA + PBS, n = 6) (g n = 5 for all groups except VEGF-C-mRNA + α4–1BB αPD1, n = 7). h-j Mice inoculated with 50,000 GL261 cells were treated with VEGF-C-mRNA/GFP-mRNA (day 7) and with either anti-PD1 (RMP1–14) antibodies (h), anti-TIM3 (RMT3–23) antibodies (i), anti-CTLA4 (9H10) antibodies (j) or PBS (day 7, 9 and 11) and monitored for survival (n = 5). For i and j same control mice were used for GFP-mRNA + PBS and VEGF-C-mRNA + PBS groups. k Schematic for experiment design of l. l Mice inoculated with 50,000 GL261-Luc cells were treated with VEGF-C-mRNA/GFP-mRNA (day 20) and with either anti-PD1 (RMP1–14) and anti-TIM3 (RMT3–23) antibodies or PBS (day 20, 22, 24) and monitored for survival (n = 5). *P < 0.05; **P < 0.01; ***P <0.001; ****P<0.0001 (two-tailed unpaired Student’s t-test, two-sided Log-rank Mantel-Cox test)
Extended Data Fig 6.
Extended Data Fig 6.. Validation of endogenous retrovirus EMV2 as a tumor antigen for GL261.
a RNA-seq analysis of murine endogenous retrovirus elements in publicly available data sets on C57BL/6J mice brains and GL261 cell lines from various sources. b Quantification of ERV elements in brain and tumor tissue from RNA-Seq (Brain, n = 9; Tumor, n = 6). c Gating strategies for tetramer staining. d Mice were injected with 500,000 GL261 cells or PBS in the flank. Seven days after tumor inoculation, draining inguinal lymph nodes were collected and emv2-env (Kb-restricted peptides aa 604–611 of p15E protein (KSPWFTTL)) tetramers were used to validate tumor specific T cell proliferation. Experiments were repeated twice independently with similar results. Data are mean ± S.E.M
Extended Data Fig 7.
Extended Data Fig 7.. VEGF-C dependent anti-PD-1 potentiation is specific among other VEGF family proteins and is not through a direct effect on tumor or immune cells.
a C57BL/6 mice received intra-cisterna magna (icm) injection of AAV-CTRL or -sVEGFR-3. After 4 weeks, mice were euthanized and the dura mater was collected to image the lymphatic vasculature (LYVE1) in the confluence of sinuses (b) (n = 5). c Mice were pre-treated with AAV-sVEGFR-3 4–6 weeks prior to tumor inoculation. 7 days post tumor inoculation, mice were treated with VEGF-C-mRNA and anti-PD1 (RMP1–14) antibodies (days 7, 9 and 11) (n = 5). d-f Mice were treated with 5 μg of recombinant protein (VEGF-A, B, C156S, or D) in combination with anti-PD1 (RMP1–14) antibodies (days 7, 9 and 11) and monitored for survival (n = 5). g-k Mice were injected with CT2A-BFP tumors. Mice were treated with VEGF-C-mRNA at day 7. On day 8, brains and lymph nodes from all mice were collected and analyzed using flow cytometry. Experiment was repeated independently with similar results. g Sample plots of experiments, h-k quantification of experiments (n = 5). l Flow cytometry was used to evaluate VEGFR-3 expression in GL261 cells. VEGFR3-GFP plasmid was transfected into HEK293T cells as a positive control. Experiment was repeated independently with similar results. m MTT assay to measure GL261 cancer cell proliferation in the presence of VEGF-C after 48 hours (all groups, n = 8). n Flow cytometry was used to evaluate VEGFR-3 expression in leukocyte compartments in the tumor. Experiment was repeated independently with similar results. o BMDCs were cultured with VEGF-C and evaluated for costimulatory molecule expression at naïve state (top row) or with LPS stimulation (bottom row). p Isolated T cells were activated in vitro with CD3/CD28 and IL-2 in the presence of VEGF-C. Data are mean ± S.D. *P < 0.05; **P < 0.01; ***P <0.001; ****P<0.0001 (two-tailed unpaired Student’s t-test, two-sided Log-rank Mantel-Cox test).
Extended Data Fig 8.
Extended Data Fig 8.. Flow cytometry analysis of myeloid cell populations after VEGF-C treatment.
Mice bearing 7 day-tumors were treated with Luc-mRNA or VEGF-C-mRNA and evaluated for changes in myeloid populations. a Gating strategy for different myeloid cells. b-d Cell counts of different cell types were measured at different time points after VEGF-C-mRNA treatment. e-g MHCII and CD80 MFI levels were graphed and showed no significant alteration after VEGF-C-mRNA treatment. b and e are leukocytes from brain tissue. c and f are leukocytes from draining cervical lymph nodes. d and g are leukocytes from meninges (n = 3, 3 animals pooled for each replicate). Data are mean ± S.E.M *P < 0.05; **P < 0.01; ***P <0.001; ****P<0.0001 (two-tailed unpaired Student’s t-test)
Extended Data Fig 9.
Extended Data Fig 9.. VEGF-C treatment changes T cell phenotypes and functionality.
Mice bearing 7 day-tumors were treated with Luc-mRNA or VEGF-C-mRNA and evaluated for changes. a Mice brains were collected 2 days after VEGF-C-mRNA treatment, cryosectioned and analyzed by immunofluorescence microscopy. b Gating strategy for flow cytometry analysis of T cells. c Example of TCF7 staining in CD3+CD8+CD44+ populations after VEGF-C-mRNA treatment. Experiment was repeated twice independently with similar results. d Percent of TCF7+ T cells in CD3+CD8+CD44+ population in the brain (Luc-mRNA, n = 14; VEGF-C-mRNA, n = 9, data pooled from 3 independent experiments). e Number of cells CD3+CD8+CD44+ cells producing IFNγ, TNFα, IL2 and GZMB in the brain (n = 3; 3 animals were pooled for each n). Violin plots display quartiles with dotted horizontal lines, median with dashed lines and minima and maxima with solid lines. f Quantification of cell counts in different compartments after VEGF-C-mRNA treatment. Percent of cells expressing specific transcription factors or immune checkpoint inhibitors after VEGF-C-mRNA treatment. g Gating strategy for cytokine production in T cells. h-i Quantification of T cells expressing multiple cytokines (n = 3, 3 animals pooled for each replicate). Data are mean ± S.E.M *P < 0.05; **P < 0.01; ***P <0.001; ****P<0.0001 (two-tailed unpaired Student’s t-test)
Extended Data Fig 10.
Extended Data Fig 10.. T cell extrinsic VEGF-C signaling mediates protection against intracranial tumor and is equivalent to peripheral priming.
a Schematic of experiment design for main Fig a-c and Extended Fig. 13a-e. b Flank tumor growth kinetics from main Fig 4a–c were measured using a caliper (n = 12 for all groups except; ligation groups, n = 7). c-e mice were given either only intracranial B16 tumors (IC, c) or a B16 flank tumor and intracranial tumor (FT, d) and treated with GFP/VEGF-C-mRNA on day 7 and anti-PD1 (RMP1–14), anti-CTLA4 (9H10), and anti-TIM3 (RMT3–23) on days 7, 9 and 11. f Flow cytometry gating strategy for main Fig 4e–f. g Schematic of VEGF-C induced tumor rejection. *P < 0.05; **P < 0.01; ***P <0.001; ****P<0.0001 (two-sided Log-rank Mantel-Cox test)
Figure 1
Figure 1. Increased meningeal lymphatic vasculature confers protection against intracranial glioblastoma challenge in a draining lymph node and T cell dependent manner and provides long-term protection.
a-b C57BL/6 mice received injection of AAV-CTRL or AAV-VEGF-C intra-cisternally (icm) through the cisterna magna. Six to eight weeks later, mice were euthanized and the dura was collected to image the lymphatic vasculature (LYVE1+) in the confluence of sinuses (AAV-CTRL, n = 7; AAV-VEGF-C, n = 8). c-e C57BL/6 mice injected with CTRL-AAV or AAV-VEGF-C icm two months prior were implanted with 5,000 (e) (Naïve = 3, AAV-CTRL, n = 4; AAV-VEGF-C, n = 8) GL261-Luc cells in the striatum and monitored for survival. d Six to eight weeks after AAV icm injection, the dcLNs of mice were ligated using a cauterizer. Seven days later, mice were challenged with 50,000 GL261-Luc cells in the striatum and monitored for survival (AAV-CTRL, n = 4; AAV-CTRL LN ligation, n = 4; AAV-VEGF-C, n = 4; AAV-VEGF-C LN ligation, n = 10). f Mice injected with AAV-CTRL or AAV-VEGF-C that survived over 100 days after 5,000 GL261-Luc challenge were re-challenged with 500,000 GL261-Luc in the flank. IVIS imaging of mice ten days after flank re-challenge, and measurement of tumors at day 7 and 15 (n = 3). Data are pooled from two independent experiments (b-f). Data are mean ± S.D. *P < 0.05; **P < 0.01; ***P <0.001; ****P<0.0001 (two-tailed unpaired Student’s t-test, two-sided Log-rank Mantel-Cox test)
Figure 2
Figure 2. Human GBM is deprived of lymphangiogenic signals at steady state but increases after αPD-1 therapy.
RNAseq data of tumor tissue (TCGA, phs000178.v10.p8) and healthy brain cortex (GTEX, phs000424.v7.p2). a-c Expression profiles of VEGF-A, CD31 (angiogenic) and VEGF-C (lymphangiogenic) genes in cortex versus GBM samples (cortex, n = 133; GBM, n = 147, patient samples). d-f RNAseq correlation of change in VEGF-C and T cell markers after PD-1 therapy (data from GSE121810, n = 24). Data are mean ± S.D. *P < 0.05; **P < 0.01; ***P <0.001; ****P<0.0001 (two-tailed unpaired Student’s t-test, Pearson’s correlation)
Figure 3
Figure 3. Therapeutic delivery of VEGF-C potentiates checkpoint inhibitor therapy by increased T cell priming.
a Schematic of treatment plans for (b). b Mice inoculated with 50,000 GL261-Luc cells were treated with VEGF-C-mRNA/GFP-mRNA (day 7) with either anti-PD1 (RMP1–14) antibodies or isotype antibodies (day 7, 9 and 11) and monitored for survival (kaplan meier curve; GFP-mRNA + isotype, n = 11; VEGF-C-mRNA + isotype, n = 9; GFP-mRNA + αPD1, n = 8; VEGF-C-mRNA + αPD1, n = 10, Data are pooled from 2 independent experiments) (tumor burden measurement; GFP-mRNA + isotype, n = 7; VEGF-C-mRNA + isotype, n = 5; GFP-mRNA + αPD1, n = 4; VEGF-C-mRNA + αPD1, n = 5). c-d Mice were inoculated with 50,000 GL261-Luc cells and treated with GFP-mRNA or VEGF-C-mRNA at day 7. Seven days after mRNA treatment, dcLNs and tumor bearing-brain hemisphere were collected to detect tetramer positive CD8 T cells. c Concatenated FACS plot of CD45+CD3+CD8+CD44+ T cells in tumor-bearing brain and dcLNs with GFP-mRNA or VEGF-C-mRNA treatment. Percent quantification of dcLNs (d, circle, ipsilateral; square, contralateral) or tumor infiltrating-tetramer positive CD8 T cells (Lymph node; GFP-mRNA n = 6; VEGF-C-mRNA, n = 12) (Tumor; GFP-mRNA n = 3; VEGF-C-mRNA, n = 5). Experiment was repeated independently with similar results. e Mice were inoculated with 50,000 GL261-Luc cells and treated with Luc-mRNA or VEGF-C-mRNA at day 7. Tumor inoculated brain hemisphere was collected and analyzed using FACS (n = 3; 3 animals were pooled for each n). e Number of CD3-positive cells (n = 3; 3 animals were pooled for each n). Data are mean ± S.D. *P < 0.05; **P < 0.01; ***P <0.001; ****P<0.0001 (two-tailed unpaired Student’s t-test, two-sided Log-rank Mantel-Cox test).
Figure 4
Figure 4. T cell extrinsic VEGF-C signaling mediates protection against intracranial tumor and is equivalent to peripheral priming.
a-c mice were given either only YUMMER1.7 intracranial tumors (IC, a) or a YUMMER1.7 flank tumor and YUMMER1.7 intracranial tumor (FT, b) and treated with GFP/VEGF-C-mRNA on day 7 and anti-PD1 (RMP1–14), anti-CTLA4 (9H10) on days 7, 9 and 11. (a, n = 12 for all groups except ligation IC VEGFC-mRNA + αPD1 αCTLA4, n = 7; b, n = 12 for all groups except ligation FT IC VEGFC-mRNA + αPD1 αCTLA4, n = 7). d Schematic for experiment design of e. Congenic CD45.2 mice were injected with GL261 tumors. 7 days post tumor inoculation (pti), mice were treated with GFP-mRNA or VEGF-C-mRNA. At 7 days post mRNA-treatment (14 day-pti) leukocytes from dcLNs were transferred into congenic CD45.1 mice bearing 7 day-tumors. Five days after transfer, dcLNs and brain tissues were harvested to analyze T cell infiltration. e Quantification of brain infiltrating and lymph node T cells (n = 5 animals, all groups). Data are mean ± S.E.M *P < 0.05; **P < 0.01; ***P <0.001; ****P<0.0001 (two-tailed unpaired Student’s t-test, two-sided Log-rank Mantel-Cox test)

Comment in

References

    1. Aspelund A et al. A dural lymphatic vascular system that drains brain interstitial fluid and macromolecules. J Exp Med 212, 991–999, doi: 10.1084/jem.20142290 (2015). - DOI - PMC - PubMed
    1. Louveau A et al. Structural and functional features of central nervous system lymphatic vessels. Nature 523, 337–341, doi: 10.1038/nature14432 (2015). - DOI - PMC - PubMed
    1. Louveau A et al. CNS lymphatic drainage and neuroinflammation are regulated by meningeal lymphatic vasculature. Nat Neurosci 21, 1380–1391, doi: 10.1038/s41593-018-0227-9 (2018). - DOI - PMC - PubMed
    1. Antila S et al. Development and plasticity of meningeal lymphatic vessels. J Exp Med 214, 3645–3667, doi: 10.1084/jem.20170391 (2017). - DOI - PMC - PubMed
    1. Da Mesquita S et al. Functional aspects of meningeal lymphatics in ageing and Alzheimer’s disease. Nature, doi: 10.1038/s41586-018-0368-8 (2018). - DOI - PMC - PubMed

Publication types

MeSH terms

Substances