. 2020 Jan;577(7791):549-555.
doi: 10.1038/s41586-019-1922-8. Epub 2020 Jan 15.

B cells and tertiary lymphoid structures promote immunotherapy response

Affiliations

B cells and tertiary lymphoid structures promote immunotherapy response

Beth A Helmink et al. Nature. 2020 Jan.

Abstract

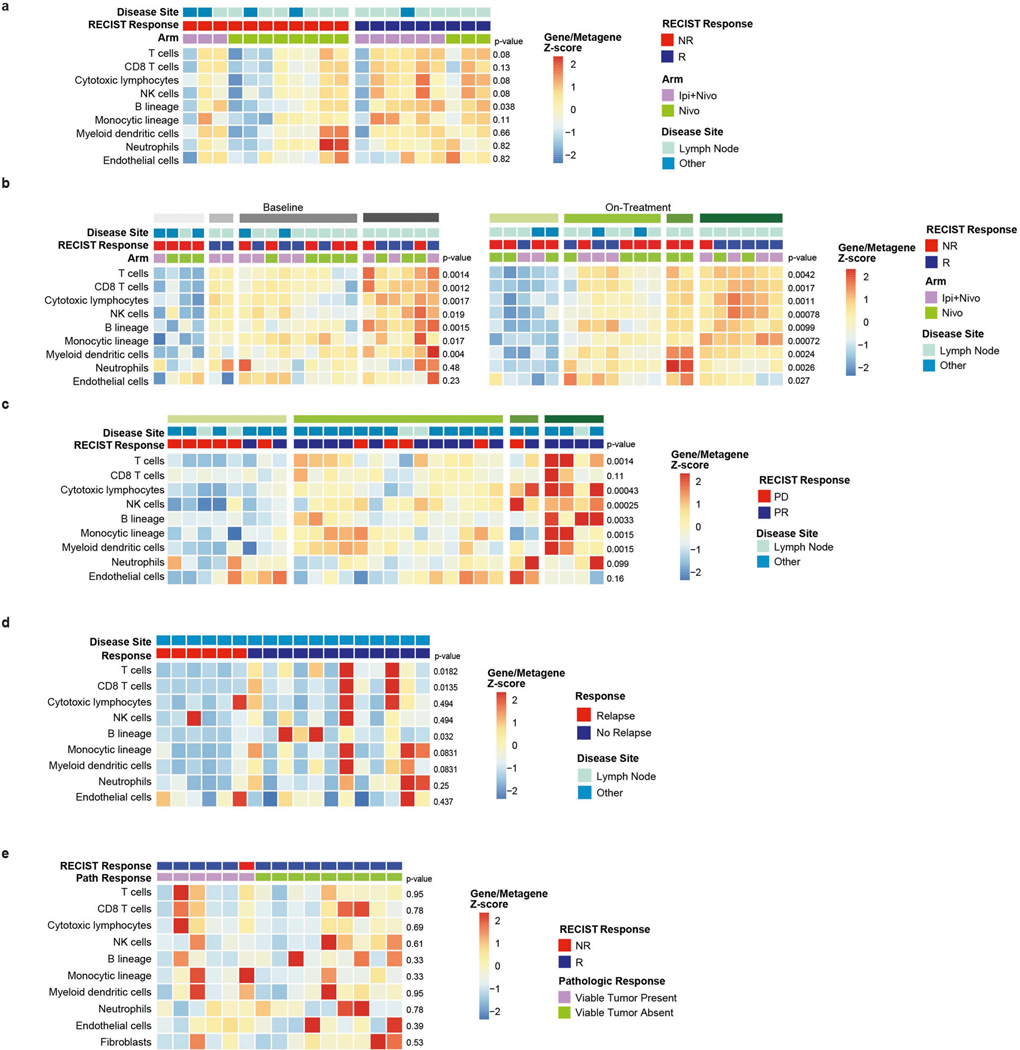
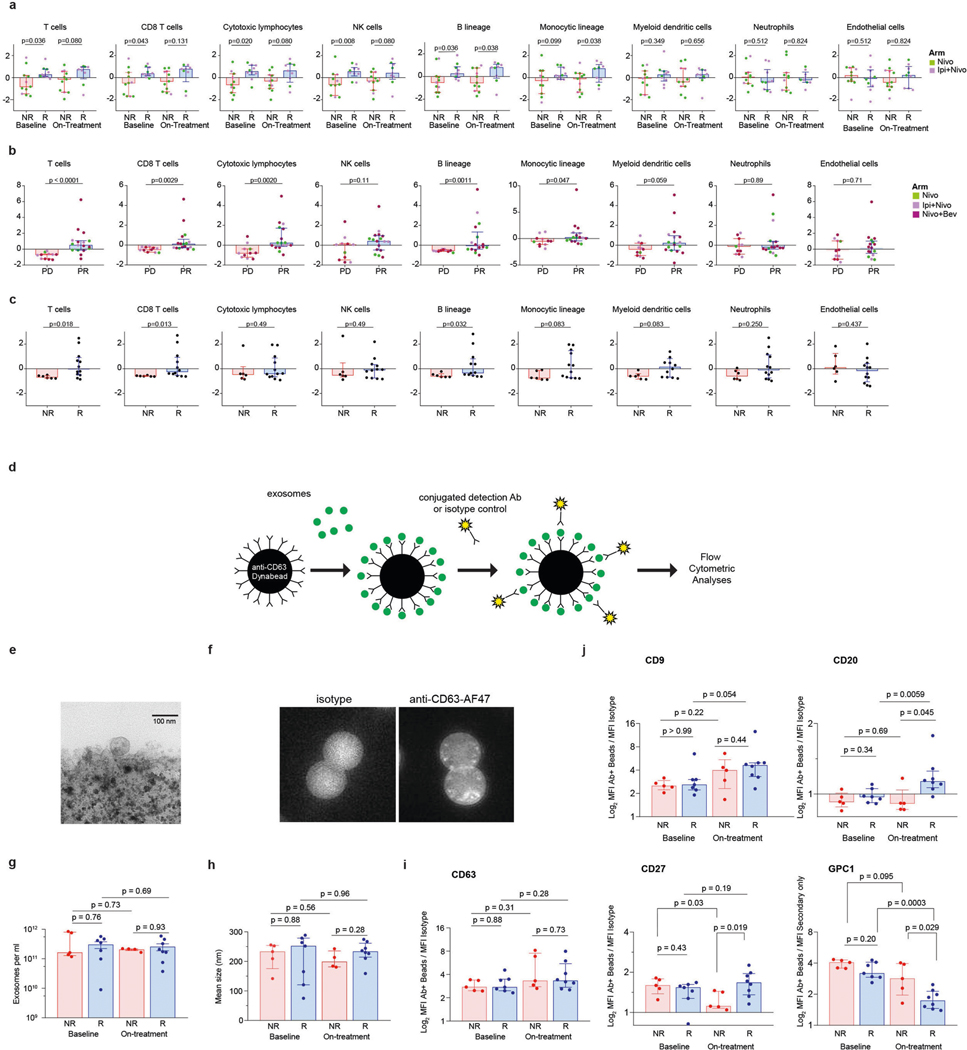
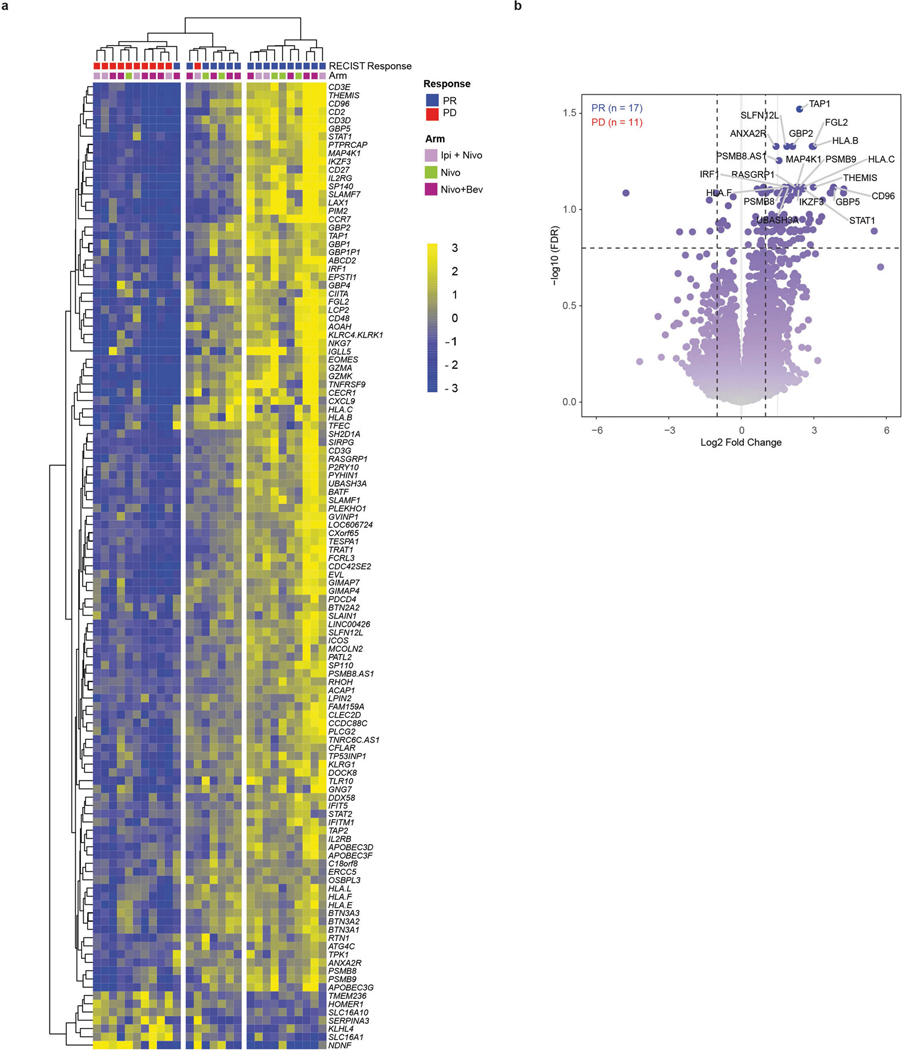
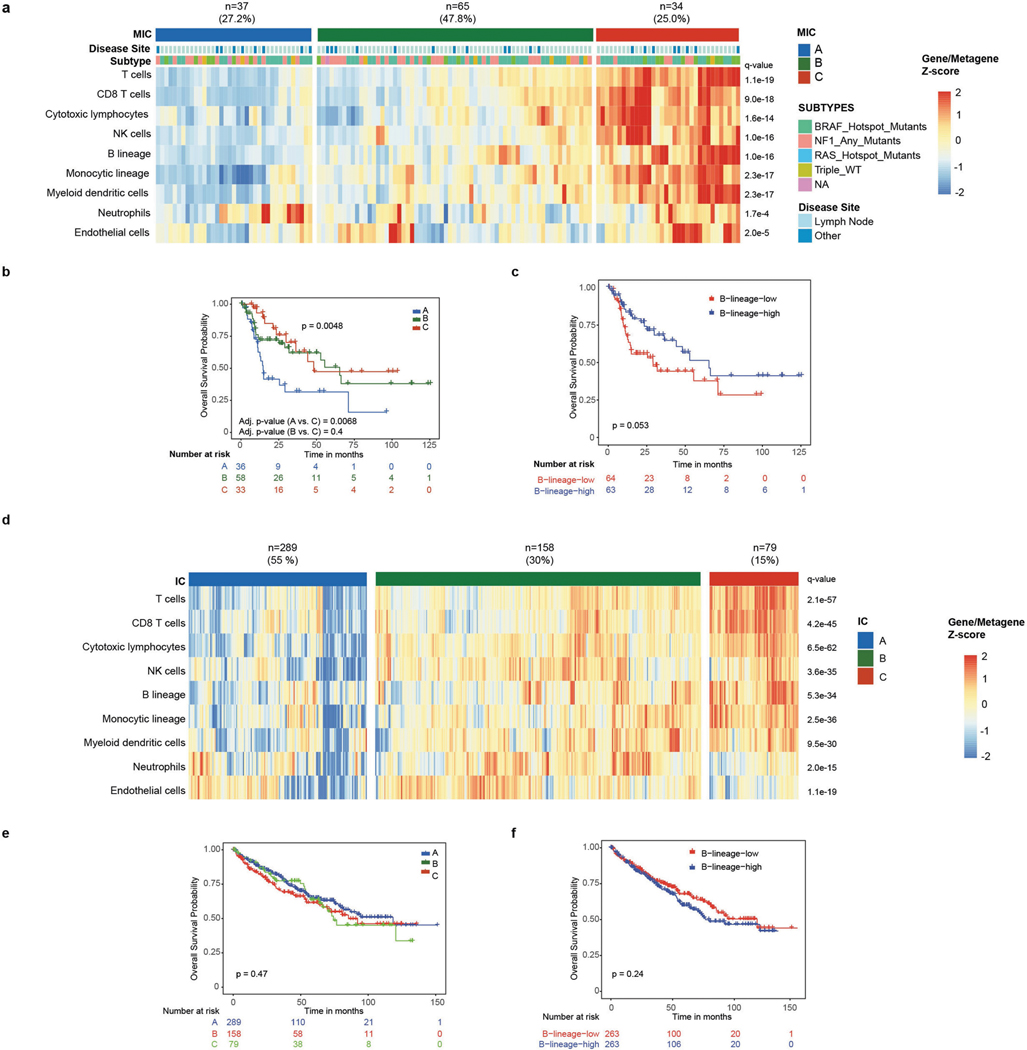
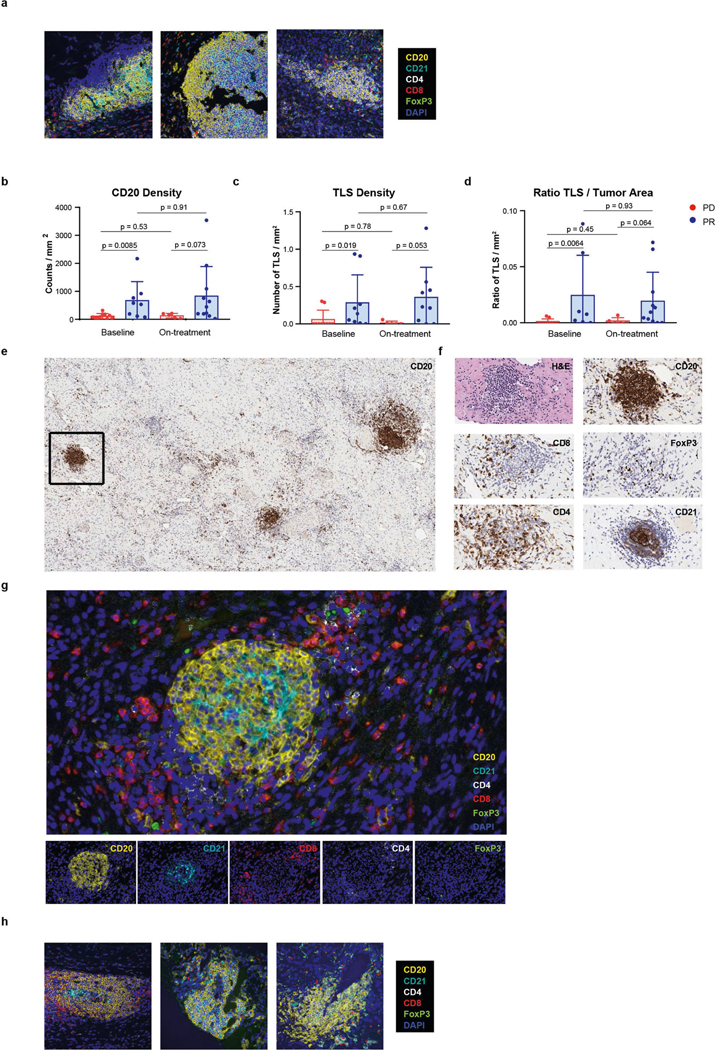
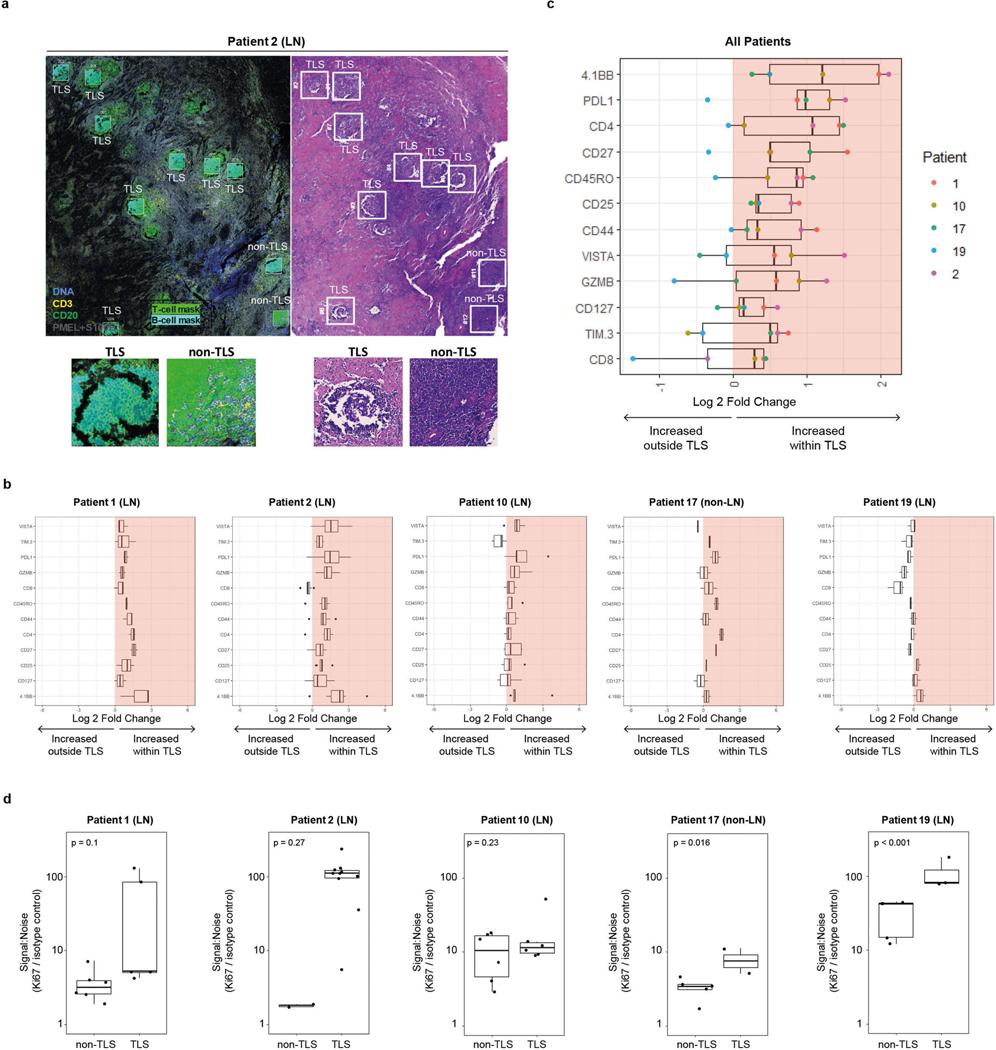
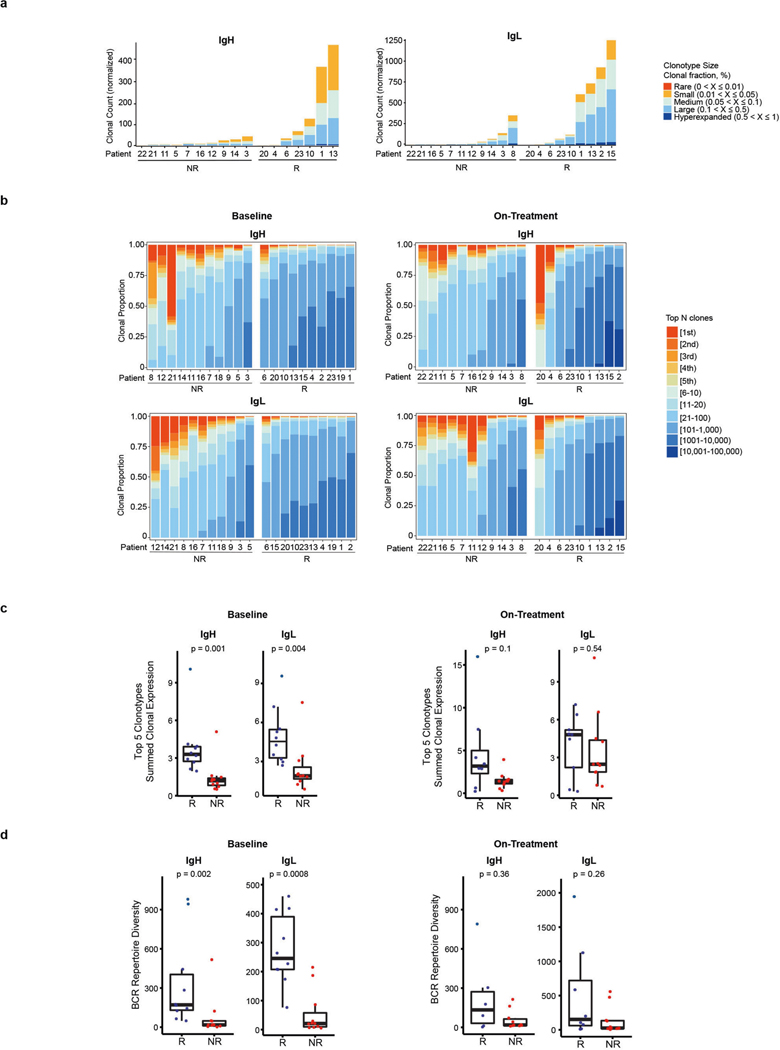
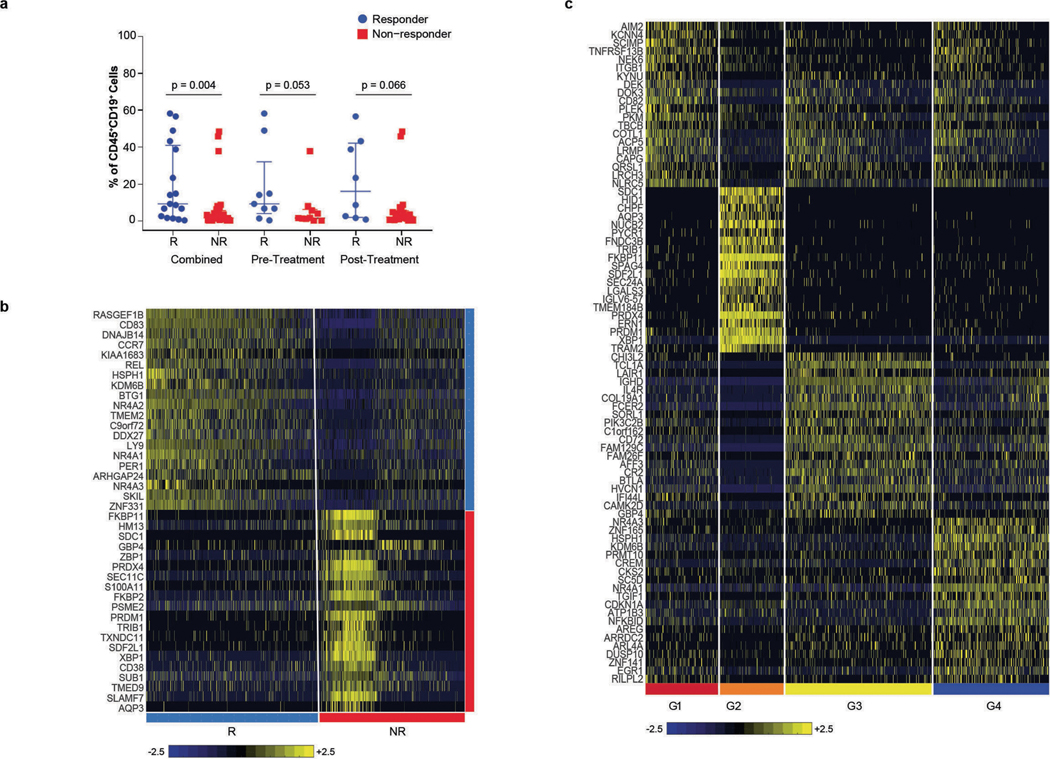
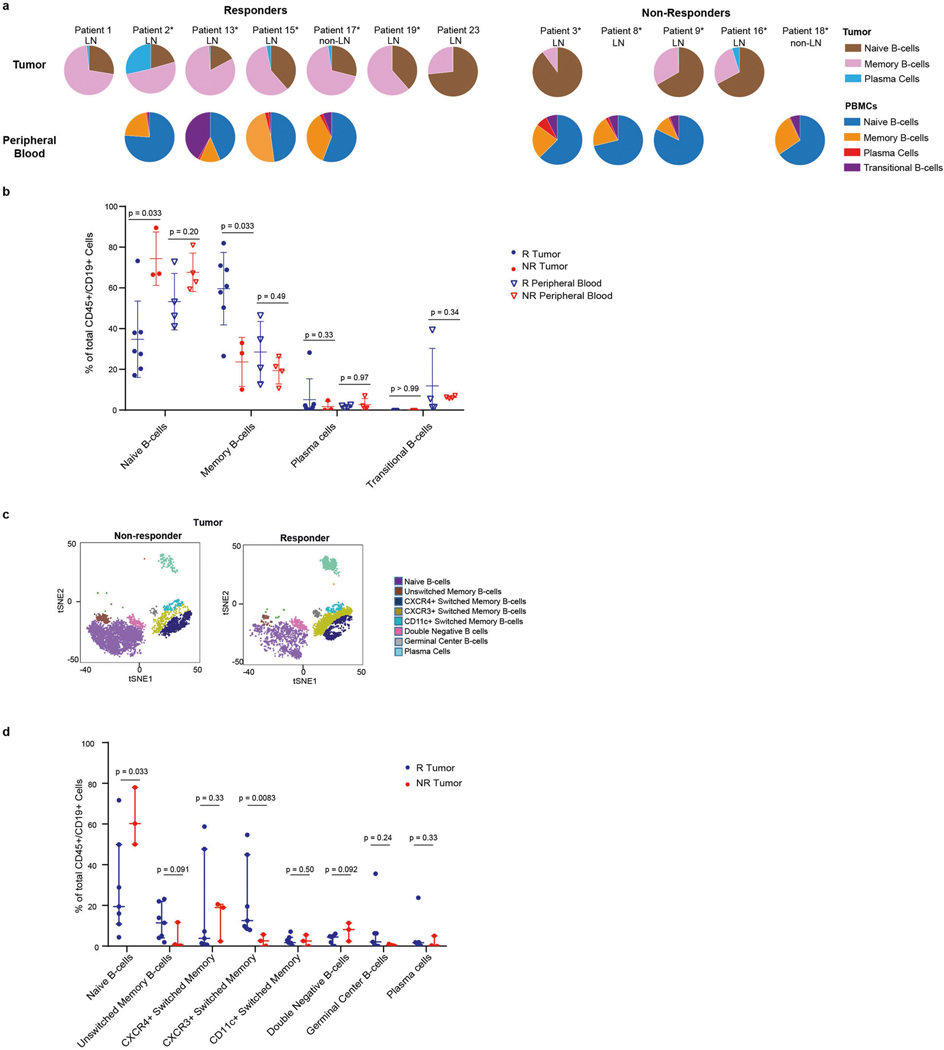
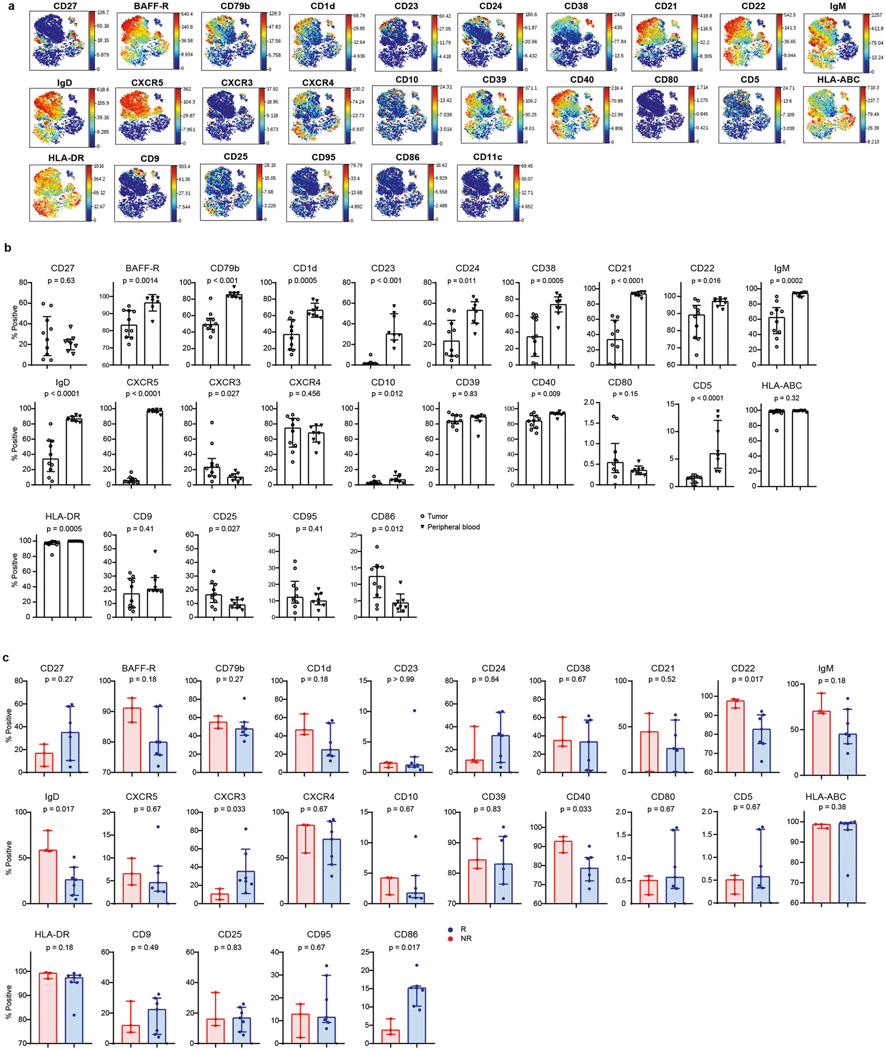
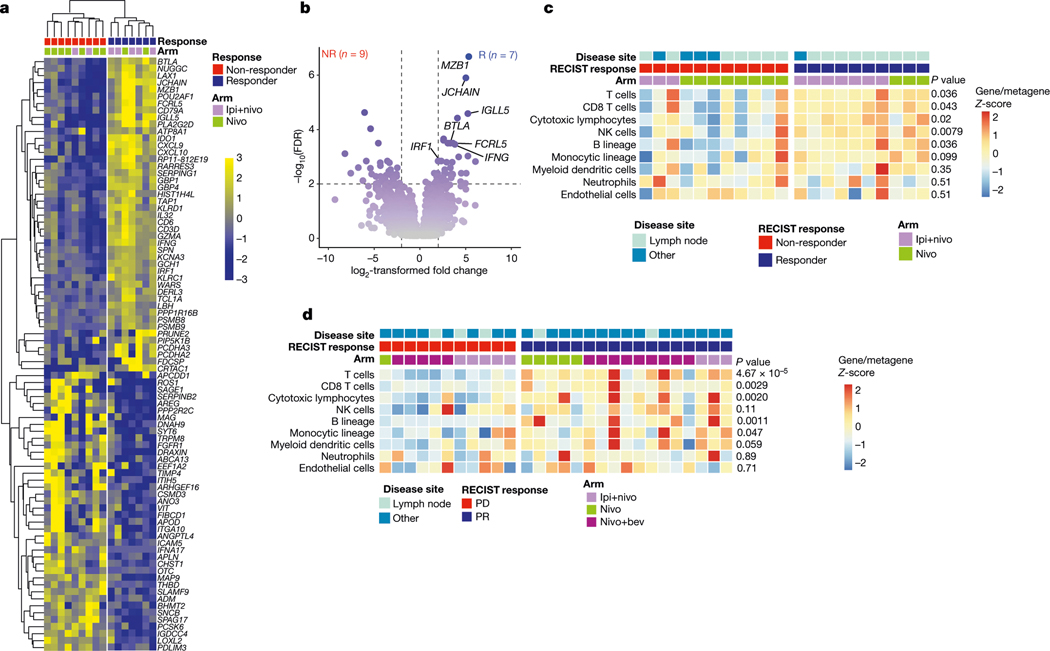
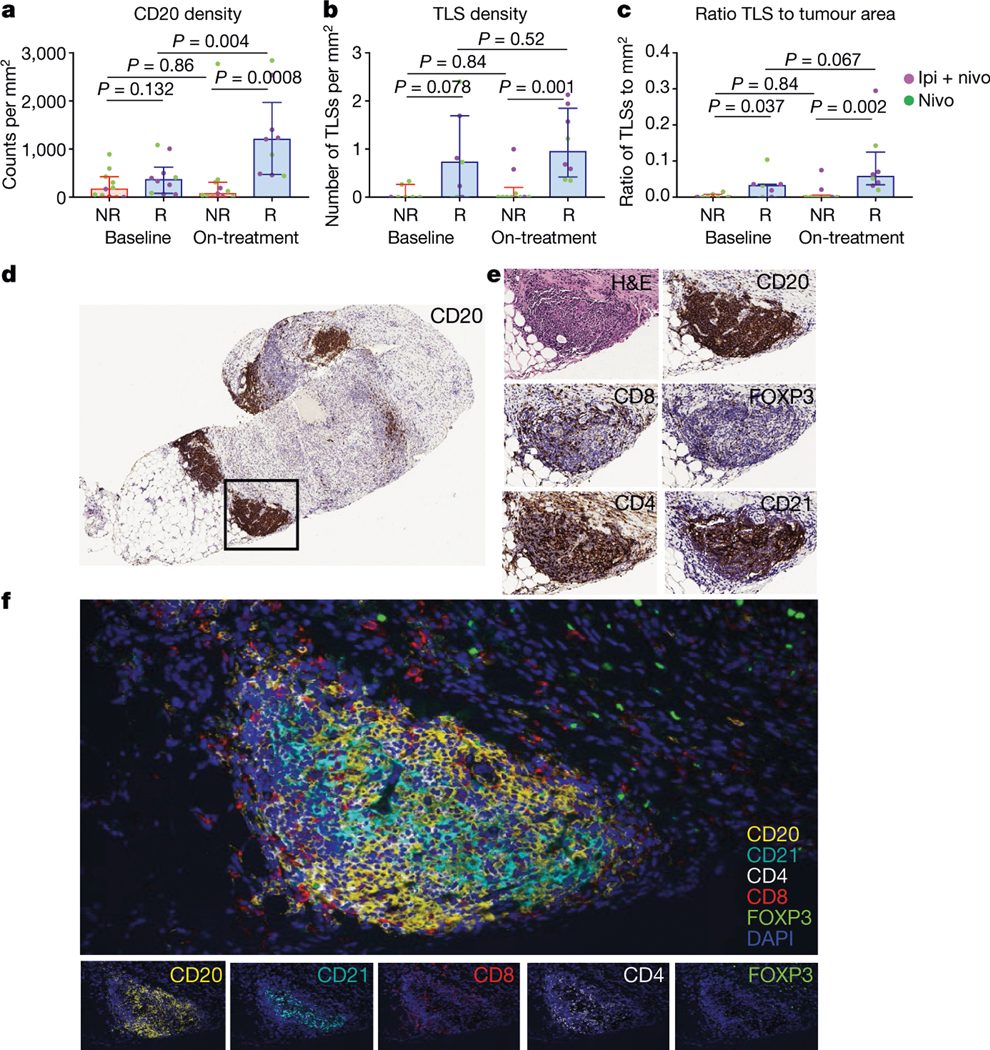
Treatment with immune checkpoint blockade (ICB) has revolutionized cancer therapy. Until now, predictive biomarkers1-10 and strategies to augment clinical response have largely focused on the T cell compartment. However, other immune subsets may also contribute to anti-tumour immunity11-15, although these have been less well-studied in ICB treatment16. A previously conducted neoadjuvant ICB trial in patients with melanoma showed via targeted expression profiling17 that B cell signatures were enriched in the tumours of patients who respond to treatment versus non-responding patients. To build on this, here we performed bulk RNA sequencing and found that B cell markers were the most differentially expressed genes in the tumours of responders versus non-responders. Our findings were corroborated using a computational method (MCP-counter18) to estimate the immune and stromal composition in this and two other ICB-treated cohorts (patients with melanoma and renal cell carcinoma). Histological evaluation highlighted the localization of B cells within tertiary lymphoid structures. We assessed the potential functional contributions of B cells via bulk and single-cell RNA sequencing, which demonstrate clonal expansion and unique functional states of B cells in responders. Mass cytometry showed that switched memory B cells were enriched in the tumours of responders. Together, these data provide insights into the potential role of B cells and tertiary lymphoid structures in the response to ICB treatment, with implications for the development of biomarkers and therapeutic targets.


Conflict of interest statement

Competing interests J.A.W. is an inventor on a US patent application (PCT/US17/53.717) submitted by the University of Texas MD Anderson Cancer Center that covers methods to enhance immune checkpoint blockade responses by modulating the microbiome. J.A.W. reports compensation for speaker’s bureau and honoraria from Imedex, Dava Oncology, Omniprex, Illumina, Gilead, PeerView, Physician Education Resource, MedImmune and Bristol-Myers Squibb. J.A.W. serves as a consultant/advisory board member for Roche/Genentech, Novartis, AstraZeneca, GlaxoSmithKline, Bristol-Myers Squibb, Merck, Biothera Pharmaceuticals and Microbiome DX. J.A.W. also receives research support from GlaxoSmithKline, Roche/Genentech, Bristol-Myers Squibb, and Novartis. J.A.W., S.M.R. and B.A.H. are co-inventors on an unpublished patent application related to methods of targeting B cells to enhance response to immune checkpoint blockade. M.T.T. reports advisory board participation and speaker paid honorarium from Nanostring and Myriad Genetics. M.A.D. serves as a paid consultant for BMS, Novartis, and Roche/Genentech. M.A.D. also reports to be a principal investigator of a research grant from Roche/Genentech and an unpaid consultant to Nanostring. C.U.B. reports an advisory role in BMS, MSD, Roche, Novartis, GSK, AZ, Pfizer, GenMab and Pierre Fabre. C.U.B. receives research funding from BMS, Novartis and Nanostring. C.U.B. reports stock ownership from Uniti Cars and Neon Therapeutics. N.H. is a founder, stockholder and SAB member of Neon Therapeutics. W.H.F. serves as a consultant for AstraZeneca, Ipsen, Adaptimmune, OxfordBiotherapeutics, and Catalym. W.H.F. reports participation in data transparency committee for Servier and data management committee for Novartis. O.K. receives grant support from BMS. J.E.G. is a contributor of UpToDate-melanoma staging and prognosis. J.E.G. reports to be an unpaid member of Melanoma Research Foundation and Melanoma Research Alliance. J.E.G. reports to be on advisory board of Merck. R.K. reports to be scientific founder, stockholder and consultant of Codiak Biosciences. A.J.L. reports consultancies and research support from BMS, Genentech/Roche and MedImmune/Astra-Zeneca. P.S. reports a patent licensed to Jounce Therapeutics. P.S. serves as a consultant for Constellation, Jounce Therapeutics, Neon, BioAtla, Pieris, Oncolytics, Forty-Seven, Polaris, Apricity, Marker, Codiak, ImaginAb, Hummingbird, Dragonfly, Lytix and Bristol-Myers Squibb (BMS). P.S. has ownership interests in Jounce Therapeutics, Neon, Constellation, Oncolytics, BioAtla, Forty-Seven, Apricity, Polaris, Marker, Codiak, ImaginAb, Hummingbird, Dragonfly and Lytix. L.H.B. reports to be on StemImmune/Calidi Scientific and Medical Advisory, Scientific Advisory Board of BoardNextCure, Replimmune, Western Oncolytics, Torque Therapeutics Khloris, Pyxis, Cytomix. L.H.B. reports to be Chair of Food and Drug Administration Cellular, Tissues and Gene Therapies Advisory Committee. R.Z. reports a patent application related to work on GITR, PD1 and CTLA4. R.Z. is a consultant for Leap Therapeutics. P.H. is on advisory board for Dragonfly, GlaxoSmithKline, Immatics and Sanofi. S.W., S.O. and M.B. are employees and stockholders of NanoString Technologies. All other authors report no competing interests directly relevant to this work.

Figures

Extended Data Fig. 1 |
Extended Data Fig. 1 |. MCP-counter results in patients with melanoma and RCC treated with pre-surgical ICB or targeted therapy.
a, Supervised clustering by response of MCP-counter scores in on-treatment samples from a cohort of high-risk patients with resectable melanoma treated with neoadjuvant ICB, with responders defined as achieving a complete or partial response by RECIST 1.1 (n = 11 NR and 9 R). b, Analysis shown by unsupervised hierarchical clustering of baseline (n = 11 NR and 10 R) and on-treatment samples (n = 11 NR and 9R) from the neoadjuvant melanoma cohort. Unique clusters identified are indicated by shaded boxes on top row. c, Unsupervised hierarchical analysis shown for metastatic RCC patients (same cohort as Fig. 1d; n = 11 PD and 17 PR). Response (PR, partial response) or non-response (PD, progressive disease) as measured by RECIST 1.1. Unique clusters identified are indicated by shaded boxes on top row. d, Supervised clustering by response of MCP-counter scores from OpACIN-neo clinical trial (NCT02437279) of neoadjuvant versus adjuvant ICB in high-risk resectable melanoma (n = 6 NR and 12 R). Responders were defined as patients who did not have a relapse. e, Supervised clustering by response of MCP-counter scores in combined pre-treatment and on-treatment biopsies from a cohort of high-risk resectable melanoma patients treated with neoadjuvant targeted therapy (dabrafenib and trametinib) as part of NCT02231775 (n = 7 patients for baseline and n = 8 patients for on-treatment samples) with responder defined as achieving a complete or partial response by RECIST 1.1 and non-responder defined as having stable or progressive disease. Pathological response is defined by the presence or absence of viable tumour at time of surgical resection. P values were made using two-sided Mann–Whitney U-test.
Extended Data Fig. 2 |
Extended Data Fig. 2 |. Representation of MCP-counter scores for all patient cohorts and analyses of peripheral blood exosomes.
ac, Box plot representation of heat maps for patients with: high-risk resectable melanoma treated with neoadjuvant ICB (n = 11 NR and 10 R for baseline and n = 11 NR and 9 R on treatment) as presented in Fig. 1c and Extended Data Fig. 1a, b (a); metastatic RCC treated with pre-surgical ICB as presented in Fig. 1d and Extended Data Fig. 1c (n = 11 PD and 17 PR) (b); and high-risk resectable melanoma treated with ICB as part of OpACIN-neo trial as presented in Extended Data Fig. 1d (n = 6 NR and 12 R) (c). For ac, medians with interquartile range are shown. P values were determined by two-sided Mann–Whitney U-test. d, Schematic for exosomal analyses of serum samples from patients with melanoma on neoadjuvant ICB trial. e, Representative transmission electron micrographs showing Dynabead with exosomes present after immunocapture. f, Nanoimager-captured images of the beads coated with CD63+ exosomes as compared with isotype control. g, h, Exosomal concentration (g) and mean exosomal size (h) for serum samples for responders and non-responders at the time point indicated. i, Ratio of mean fluorescent intensity (MFI) of beads stained with anti-CD63 as compared to isotype control. j, Ratio of mean fluorescent intensity of beads stained with anti-CD9, -CD20, -CD27 and -GPC1 antibodies as compared to isotype control (or secondary antibody only for GPC1). For ej, bars indicate median values and individual data points representing 8 R and 5 NR (unless indicated in the Methods) in addition to interquartile ranges. P values were determined using two-sided Mann–Whitney U-test.
Extended Data Fig. 3 |
Extended Data Fig. 3 |. Transcriptional analysis of tumour specimens from patients with metastatic RCC treated with pre-surgical ICB.
a, Supervised hierarchical clustering by response of RCC tumour specimens at baseline of most DEGs by microarray analysis, with response defined as having a partial response by RECIST 1.1 and non-response as having progressive disease (n = 11 PD and 17 PR). Fold change and P values are calculated by the limma package as described in the Methods. A cut-off of gene expression fold change of ≥ 2 or ≤ 0.5 and a FDR q ≤ 0.05 was applied to select DEGs. b, Volcano plot depiction of DEGs by response from same cohort.
Extended Data Fig. 4 |
Extended Data Fig. 4 |. Immune infiltrate is prognostic of improved diseasespecific survival in TCGA cutaneous melanoma cohort but not the clear-cell RCC cohort.
a, Unsupervised hierarchical analysis of TCGA SKCM RNA-seq data using MCP-counter scores identifies three MICs with differential presence of individual cell types as indicated. Numbers of patients in each class is shown on top of the plot. P value determined by two-sided Kruskal–Wallis rank-sum test and q value calculated by FDR. b, Kaplan–Meier estimates of overall survival of MIC groups. c, Kaplan–Meier estimates of overall survival by B cell lineage scores shown by high and low groups dichotomized by median values. Overall survival was defined as the time interval from date of accession for each sample to date of death or censoring from any cause (Methods). d, Unsupervised hierarchical analysis of TCGA KIRC RNA-seq data using MCPcounter scores identifies three immune classes with differential presence of individual cell types as indicated. Numbers of patients in each class are shown at top of plot. P values determined by two-sided Kruskal–Wallis rank-sum test q value calculated by FDR. e, Kaplan–Meier estimates of overall survival probability of immune class groups. f, Kaplan–Meier estimates of overall survival probability by B cell lineage scores shown by high and low groups dichotomized by median values. For both, overall survival was defined as the time interval from date of accession for each sample to date of death or censoring from any cause. For b, c, e, f, patient numbers are included in the table below the graph and P values were calculated by log-rank test.
Extended Data Fig. 5 |
Extended Data Fig. 5 |. TLSs found in nodal and non-nodal metastases are consistent with mature secondary follicular-like TLSs with modest correlation with gene expression data.
a, Representative TLSs in tumours from patients with melanoma treated with neoadjuvant ICB demonstrating maturation status as indicated by the presence of follicular dendritic cells (CD21) and germinal centre B cells (CD23). We also include multiplex immunohistochemistry for SYTO13, MECA79, CD20 and CD4 (with magnified view of individual TLSs indicated by white box on the right). Circles denote defined TLSs based on multiplex immunohistochemistry. Black line approximates tumour border. b, Representative TLSs from non-lymph node metastases on additional patients with metastatic melanoma indicated by H&E staining, as well as singlet staining for CD20, CD21 and CD23. Black line on H&E image denotes tumour border. c, Comparison of baseline and on-treatment gene expression with MCP-counter analyses for B cell lineage as well as MS4A1 expression by RNA-seq for patients with high-risk resectable melanoma treated with ICB as part of clinical trial (n = 11 NR and 10 R for baseline and n = 11 NR and 9 R for on-treatment). Response and treatment arm as indicated. Medians with interquartile range are shown. P values were determined by twosided Mann–Whitney U-test. d, Linear regression modelling of MCP-counter values for B cell lineage with regards to CD20 counts (n = 10 NR and 7 R) and TLS density (n = 10 NR and 6 R) as indicated. e, Linear regression modelling of MS4A1 gene expression with regards to CD20 counts (n = 10 NR and 7 R) and TLS density (n = 10 NR and 6 R) as indicated. These represent on-treatment time points. For d, e, r, values calculated by linear regression and P values for nonzero slope as calculated by Prism v.8.0.0.
Extended Data Fig. 6 |
Extended Data Fig. 6 |. TLSs are associated with response in RCC similar to those observed in melanoma.
a, Multiplex immunohistochemistry images from three additional patients with advanced melanoma treated with neoadjuvant ICB. Staining as indicated and similar to Fig. 2. b, Quantification of CD20 cells by singlet immunohistochemistry and association with response to neoadjuvant ICB in metastatic RCC, with responders defined as having partial response and non-responders as having progressive disease by RECIST 1.1 (n = 10 PD and 8 PR at baseline and n = 5 PD and 11 PR on treatment). c, d, Density of TLSs (n = 10 PD and 9 PR at baseline and n = 5 PD and 9 PR on treatment) (c) and ratio of tumour area occupied by TLSs (n = 10 PD and 7 PR at baseline and n = 5 PD and 11 PR on treatment) (d) and correlation by treatment response. Bars indicate median values and interquartile ranges are shown. P values were determined by two-sided Mann–Whitney U-test. eg, Representative image of CD20 staining in responder with TLSs, associated H&E slide, singlet stains and characterization by multiplex immunofluorescence of TLSs. h, Multiplex immunohistochemistry images from three additional patients with RCC treated with pre-surgical ICB. Staining as indicated and similar to g.
Extended Data Fig. 7 |
Extended Data Fig. 7 |. TLSs are associated with markers of T cell activation and response and B cell proliferation.
NanoString GeoMx Digital Spatial Profiling was used to perform high-plex proteomic analysis with spatial resolution. a, Example of selection of ROIs (200 μm × 200 μm) from representative patients with melanoma treated with neoadjuvant ICB including ROI containing TLSs and ROIs outside the context of a TLS (non-TLS). ROI selection was completed using H&E staining and confirmed with immunofluorescence as shown using S100B and PMEL, SYTO13, CD3 and CD20. Masking for B cells and T cells as indicated based on CD3 and CD20 staining. b, Fold change (log2-transformation) in expression of various markers of T cell activation and response in TLS-associated T cells as compared to T cells found outside the TLS per individual slide. Data show individual TLS ROI values divided by the average non-TLS value of that slide. Increased expression in the context of TLSs is represented by shaded pink box (>0). c, Average log2transformed fold change of expression for TLS-associated T cells as compared to non-associated T cells. Individual dots represent individual patients/slides as indicated. Data show the average log2-transformed count per TLS ROI value minus the average log2-transformed count per non-TLS ROI value per slide for each protein queried. For b and c, increased expression in the context of TLSs is represented by shaded pink box (>0). Median and interquartile range are indicated. Error bars indicate 95% confidence intervals. d, Levels of Ki67 protein expression in B cell masks of non-TLSs and TLS ROIs by individual patient as indicated. Counts are represented as signal-to-noise ratios of Ki67 compared to geometric means of isotype controls. Median and interquartile range are indicated. Error bars indicated 95% confidence ratios, and P values were determined by Student’s t-test. For ad, the number of ROIs analysed for each patient are 11 for patient 1, 12 for patient 2, 12 for patient 10, 7 for patient 17 and 7 for patient 19.
Extended Data Fig. 8 |
Extended Data Fig. 8 |. BCR analyses of intratumoral B cells in patients with advanced melanoma before and after treatment with neoadjuvant ICB.
a, Clonal counts for all identified clonotypes for both IgH and IgL after treatment with ICB. Patients are grouped as responders and non-responders and identified as indicated in which each bar represents individual patient. b, Clonal proportion for all identified clonotypes for both IgH and IgL for baseline samples further evaluated in Fig. 3a and on-treatment samples in a. Patients are grouped as responders and non-responders and identified as indicated in which each bar represents individual patient. c, d, Summed expression of top five clonotypes in normalized read counts (c) and BCR repertoire diversity (d) for responders and non-responders for both IgH and IgL at baseline (n = 11 NR and 10 R for IgH and IgL) and on-treatment (n = 10 NR and 9 R for IgH and n = 11 NR and 9 R for IgL). Box plot shows median and interquartile range. P values determined by two-sided Mann–Whitney U-test.
Extended Data Fig. 9 |
Extended Data Fig. 9 |. Single-cell RNA-seq analysis reveals unique clusters of B cells associated with response to ICB.
a, Scatter plots comparing the percentage of CD45+ cells staining positive for CD19+ (B cells) as indicated between responder (n = 17) and non-responder (n = 31) samples with all time points combined or stratified by pre- and post-treatment as indicated. Data are median and interquartile range. P values were determined by two-sided Mann–Whitney U-test. b, Heat map displaying scaled expression values (log2(TPM + 1) of discriminative genes from all B cells between responder (blue) and non-responder (red) samples. Top marker genes are shown for each group. c, Heat map showing scaled expression values (log2(TPM + 1)) of discriminative gene sets per cluster as defined in Fig. 3c. A list of representative genes is shown per cluster next to the left margin. For both heat maps, colour scheme is based on z-scores from −2.5 (blue) to 2.5 (yellow).
Extended Data Fig. 10 |
Extended Data Fig. 10 |. Mass cytometry reveals significant differences in Bcell populations between responder and non-responder tumours.
a, Pie charts representing composition of individual tumour and peripheral blood samples for patients with melanoma treated with ICB used in all analyses for mass cytometry. Matched patient samples are located directly beneath one another. Samples from patients with lymph node or non-lymph-node metastases as indicated. Cell types as indicated. Asterisk indicates samples included in t-SNE plots and pie charts in c, Fig. 3d–f, and phenographs in Extended Data Fig. 11. b, Scatter plots demonstrating quantification of different peripheral blood and intratumoral B cell phenotypes. Median and interquartile range are shown. All samples are represented in b (for tumour, n = 7 R and 3 NR and, for peripheral blood, n = 4 R and 4 NR). P values were determined by one-sided Mann–Whitney U-test. c, t-SNE plots demonstrating intratumoral B cell phenotypes from the neoadjuvant ICB trial in patients with advanced melanoma grouped by response and including further breakdown of memory cell subtypes and germinal centre B cells. Plots represent combined analyses of tumours ran simultaneously with the peripheral blood samples (n = 5 R and 3 NR) and include baseline and on-treatment samples as detailed in Supplementary 31. d, Quantification of B cell subtypes in tumour from mass cytometric analyses in responders and non-responder from all tumours (n = 7 R and 3 NR). Median and interquartile range are shown. P values were determined by one-sided Mann–Whitney U-test.
Extended Data Fig. 11 |
Extended Data Fig. 11 |. Surface expression of markers analysed by mass cytometry.
a, Individual phenographs for surface expression of each marker analysed as indicated. These data represent combined tumour and peripheral blood samples from patients with melanoma treated with ICB ran together (8 tumour n = 5 R and n = 3 NR and 8 peripheral blood samples n = 4 R and n = 4 NR), thus eliminating batch effect. b, Percentage of CD45+CD19+ cells by tissue type—peripheral blood versus tumour—that are positive for each of the surface markers indicated. c, Percentage of CD45+CD19+ cells in tumour by response—responder versus non-responder—that are positive for each of the surface markers indicated. For b and c, all samples are represented (for tumour, n = 7 R and 3 NR and, for peripheral blood, n = 4 R and n = 4 NR). Error bars indicate median and interquartile range. P values were determined by two-sided Mann–Whitney U-test.
Fig. 1 |
Fig. 1 |. Transcriptional analysis of tumour specimens from patients with high-risk resectable melanoma and metastatic RCC treated with pre-surgical ICB.
a, Supervised hierarchical clustering of differentially expressed genes (DEG) on RNA-seq analysis by response of melanoma tumour specimens at baseline, with responder defined as having a complete or partial response by RECIST 1.1 and non-responder as having less than partial response (n = 9 non-responders and 7 responders). A cut-off of gene expression fold change of ≥ 2 or ≤ 0.5 and a false discovery rate (FDR) q ≤ 0.05 was applied to select DEGs. Ipi, ipilimumab; nivo, nivolumab. b, Volcano plot depiction of DEG by response from same cohort as in a. R, responders; NR, non-responders. c, Supervised clustering of melanoma tumour specimens by response at baseline (n = 11 non-responders and 10 responders), displaying MCP-counter scores. NK cells, natural killer cells. d, Supervised clustering by clinical response defined as achieving a partial response (PR) according to RECIST 1.1 and non-responders as having progressive disease (PD) of RCC baseline tumour specimens (n = 11 PD and 17 PR) using methodology as in c. P values were determined by two-sided Mann–Whitney U-test. Bev, bevacizumab.
Fig. 2 |
Fig. 2 |. TLSs containing B cells, T cells and follicular dendritic cells are predictive of response to ICB.
a, Quantification of CD20 cells by singlet immunohistochemistry and association with response to neoadjuvant ICB in resectable melanoma with responders defined as having complete or partial response by RECIST 1.1 and non-responders as having less than a partial response (n = 11 NR and 10 R at baseline and n = 11 NR and 9 R on treatment). b, c, Density of TLSs (b) and ratio of tumour area occupied by TLSs (c) and correlation by treatment response (n = 7 NR and 7 R at baseline and n = 10 NR and 8 R after treatment). For ac, bars indicate median values, and errors bars denote interquartile range; individual data points are shown. P values were determined by two-sided Mann–Whitney U-test. d, Representative image of CD20 staining of TLSs in a responder after treatment with ipilimumab and nivolumab. e, Additional staining of boxed area in d showing associated haematoxylin and eosin (H&E) staining and singlet immunostaining of CD20, CD8, CD4, FOXP3 and CD21. f, Multiplex immunofluorescence assay of TLSs as in d for the following markers: CD20, CD21, CD4, CD8, FOXP3 and DAPI. Original magnification, ×20.
Fig. 3 |
Fig. 3 |. Analyses of B-cell receptor clones and single-cell analyses suggest active role for B cells in anti-tumour immunity.
a, Normalized clonal counts for BCRs identified in patients with high-risk resectable melanoma treated with neoadjuvant ICB. Both the IgH and IgL are evaluated with responders and non-responders as shown. All samples analysed at baseline. b, Scatter plots demonstrating the percentage of various cell types as indicated between responders (n = 17) and non-responders (n = 31) from a separate cohort of patients with advanced melanoma analysed by single-cell RNA-seq. Samples before and after treatment are combined. B cells are represented by the CD45+CD19+ population. Data are median values with interquartile ranges, and individual data points are shown. P values were determined by two-sided Mann–Whitney U-test. Adjustments for multiple comparisons were not made. c, t-distributed stochastic neighbour embedding (t-SNE) plot of all B cells collected and analysed by single-cell RNA-seq in b. Cells are coloured based on four clusters identified by k-means clustering (G1–G4). Number of cells analysed is 1,760 B cells from 48 tumours arising in 32 patients treated with PD1 blockade monotherapy, CTLA4 blockade monotherapy, or combined PD1 and CTLA4 blockade. d, t-SNE plots demonstrating peripheral blood and intratumoral combined B cell populations from mass cytometric analyses in responders versus non-responders (n = 4 R and 4 NR for peripheral blood and n = 5 R and 3 NR for tumour) from the neoadjuvant ICB trial in patients with advanced melanoma. e, Intratumoral B cell phenotypes included in d grouped by response. f, Quantification of B cell subtypes in e. Plots in df represent combined analyses of tumours ran simultaneously with the peripheral blood samples (n = 5 R and 3 NR) and include baseline and on-treatment samples as described in Supplementary Table 31. Statistical analyses including all samples are presented in Extended Data Fig. 10b.

Comment in

References

    1. Chen PL et al. Analysis of immune signatures in longitudinal tumor samples yields insight into biomarkers of response and mechanisms of resistance to immune checkpoint blockade. Cancer Discov. 6, 827–837 (2016). - PMC - PubMed
    1. Taube JM et al. Association of PD-1, PD-1 ligands, and other features of the tumor immune microenvironment with response to anti-PD-1 therapy. Clin. Cancer Res. 20, 5064–5074 (2014). - PMC - PubMed
    1. Cottrell TR. & Taube JM. PD-L1 and emerging biomarkers in immune checkpoint blockade therapy. Cancer J. 24, 41–46 (2018). - PMC - PubMed
    1. Yarchoan M, Hopkins A & Jaffee EM Tumor mutational burden and response rate to PD-1 inhibition. N. Engl. J. Med. 377, 2500–2501 (2017). - PMC - PubMed
    1. Ayers M et al. IFN-γ-related mRNA profile predicts clinical response to PD-1 blockade. J. Clin. Invest. 127, 2930–2940 (2017). - PMC - PubMed

Publication types

MeSH terms