Individual-Level Lesion-Network Mapping to Visualize the Effects of a Stroke Lesion on the Brain Network: Connectograms in Stroke Syndromes
- PMID: 31942767
- PMCID: PMC6974837
- DOI: 10.3988/jcn.2020.16.1.116
Individual-Level Lesion-Network Mapping to Visualize the Effects of a Stroke Lesion on the Brain Network: Connectograms in Stroke Syndromes
Abstract
Background and purpose: Similar-sized stroke lesions at similar locations can have different prognoses in clinical practice. Lesion-network mapping elucidates network-level effects of lesions that cause specific neurologic symptoms and signs, and also provides a group-level understanding. This study visualized the effects of stroke lesions on the functional brain networks of individual patients.
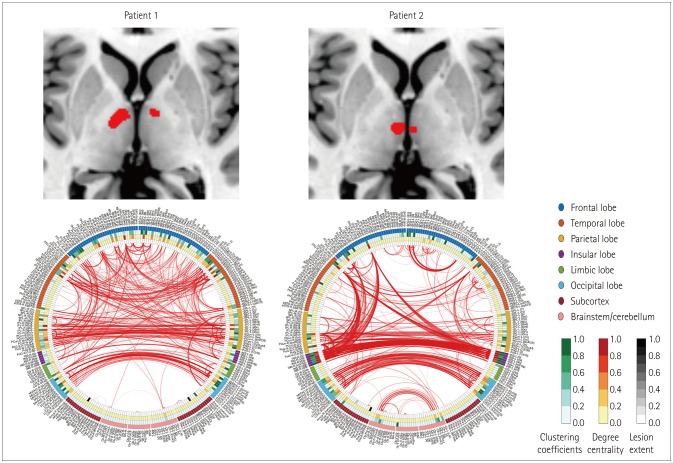
Methods: We enrolled patients with ischemic stroke who were hospitalized within 1 week of the stroke occurrence. Resting-state functional magnetic resonance imaging was performed 3 months after the index stroke. For image preprocessing, acute stroke lesions were visually delineated based on diffusion-weighted images obtained at admission, and the lesion mask was drawn using MRIcron software. Correlation matrices were calculated from 280 brain regions using the Brainnetome Atlas, and connectograms were visualized using in-house MATLAB code.
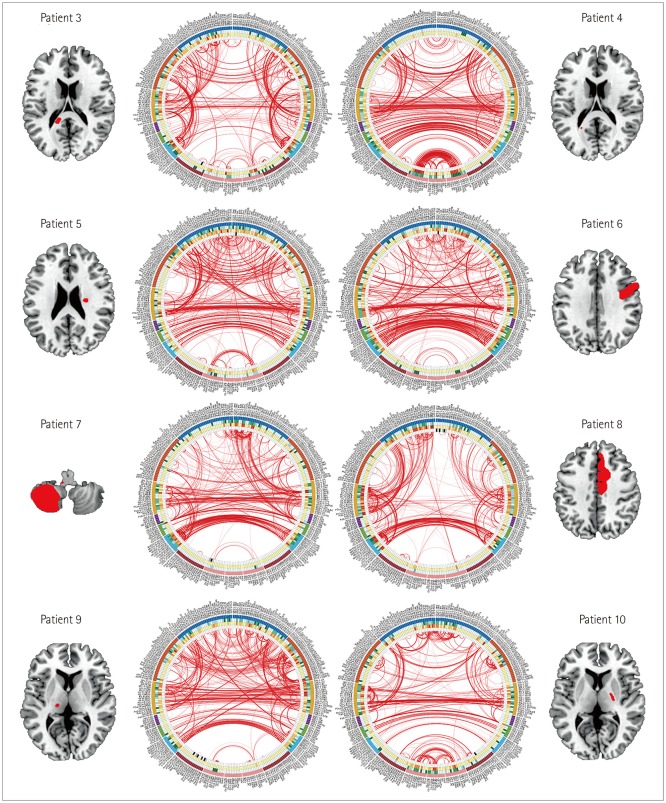
Results: We found characteristic differences in connectograms between pairs of patients who had comparable splenial, frontal cortical, cerebellar, and thalamocapsular lesions. Two representative patients with bilateral thalamic infarctions showed significant differences in their reconstructed connectograms. The cognitive function had recovered well at 3 months after stroke occurrence in patients with well-maintained interhemispheric and intrahemispheric connectivities.
Conclusions: This pilot study has visualized the effects of stroke lesions on the functional brain networks of individual patients. Consideration of the neurobiologic mechanisms underlying the differences between their connectograms has yielded new hypotheses about differences in the effects of stroke lesions.
Keywords: cerebral infarction; connectome; functional neuroimaging; magnetic resonance imaging.
Copyright © 2020 Korean Neurological Association.
Conflict of interest statement
The authors have no potential conflicts of interest to disclose.
Figures
References
-
- Wernicke C. The symptom-complex of aphasia. In: Church A, editor. Disease of the nervous system. New York: Appleton; 1908. pp. 265–324.
-
- Fox MD. Mapping symptoms to brain networks with the human connectome. N Engl J Med. 2018;379:2237–2245. - PubMed
-
- Margulies DS, Böttger J, Watanabe A, Gorgolewski KJ. Visualizing the human connectome. Neuroimage. 2013;80:445–461. - PubMed
Grants and funding
LinkOut - more resources
Full Text Sources