

Metabolic effects of RUBCN/Rubicon deficiency in kidney proximal tubular epithelial cells
- PMID: 31944172
- PMCID: PMC8386605
- DOI: 10.1080/15548627.2020.1712107
Metabolic effects of RUBCN/Rubicon deficiency in kidney proximal tubular epithelial cells
Abstract
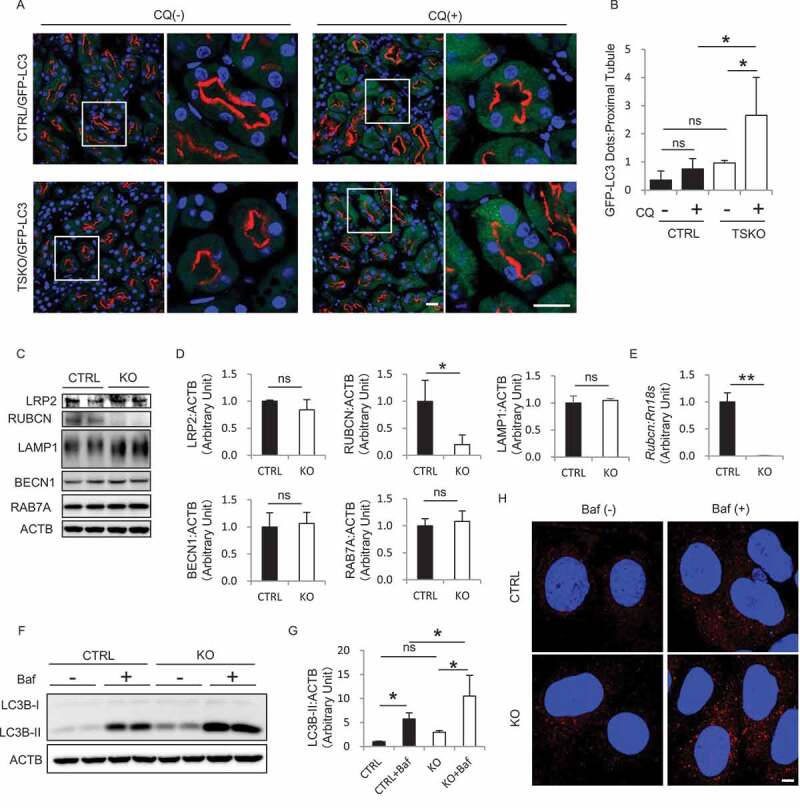
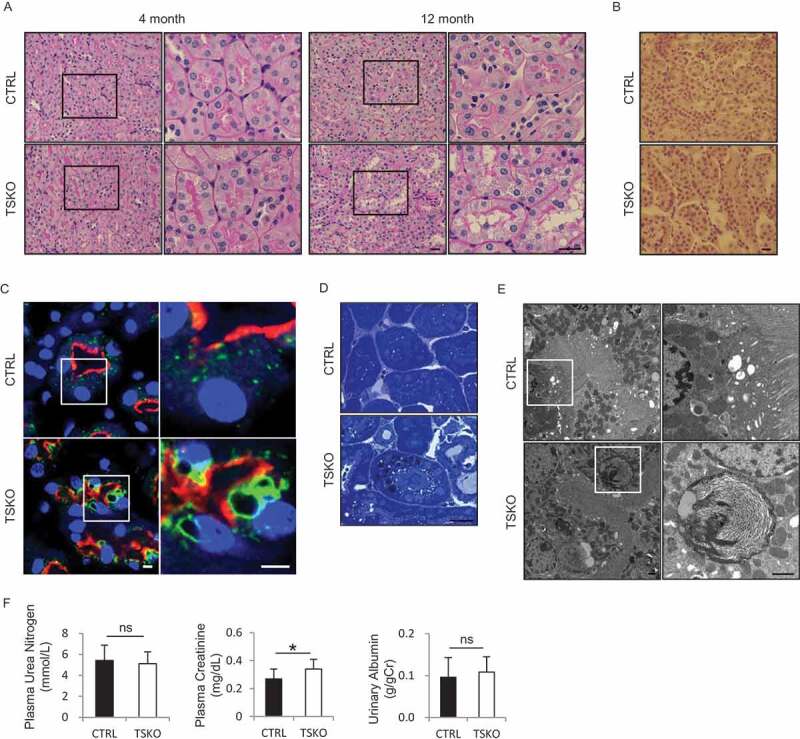
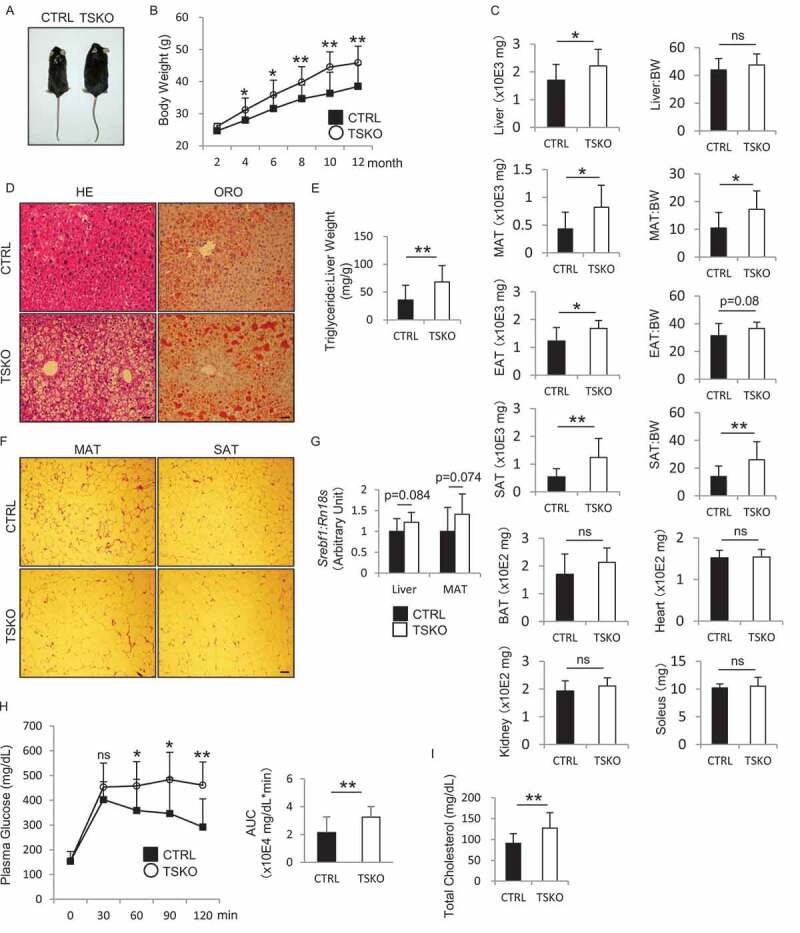
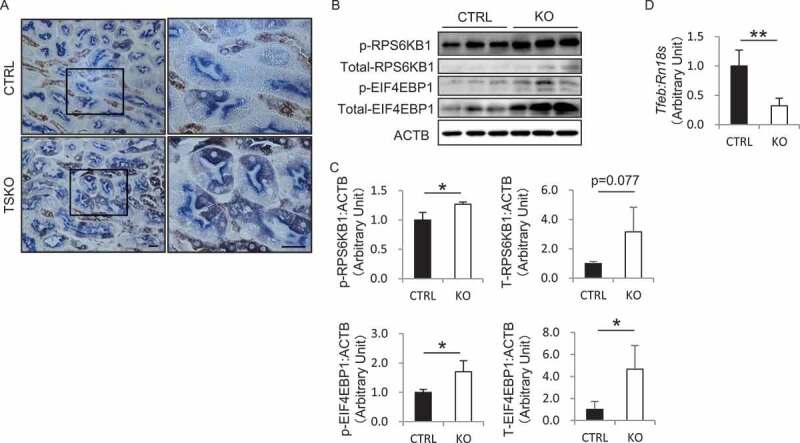
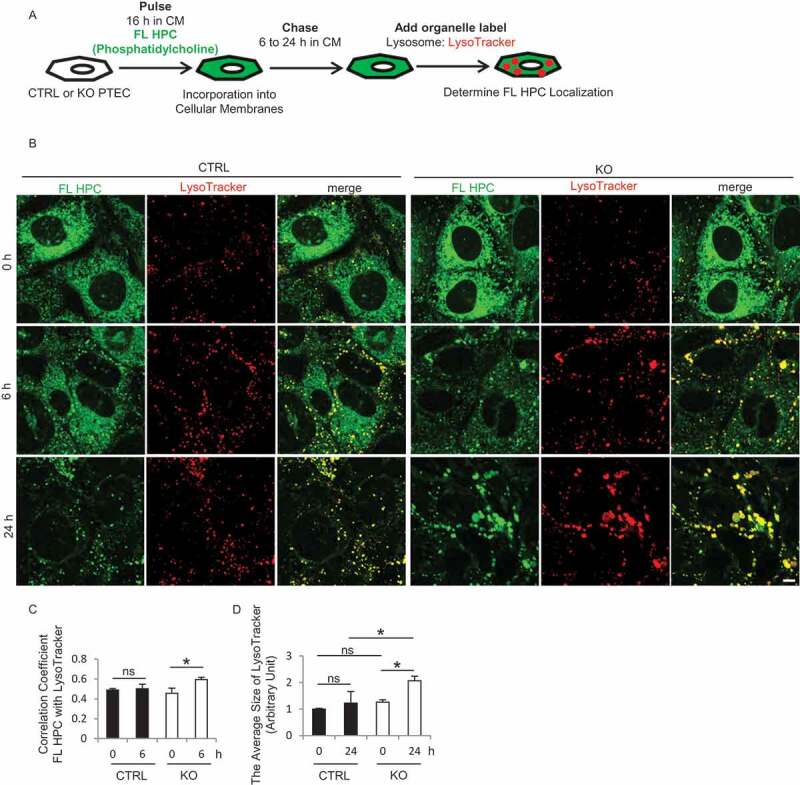
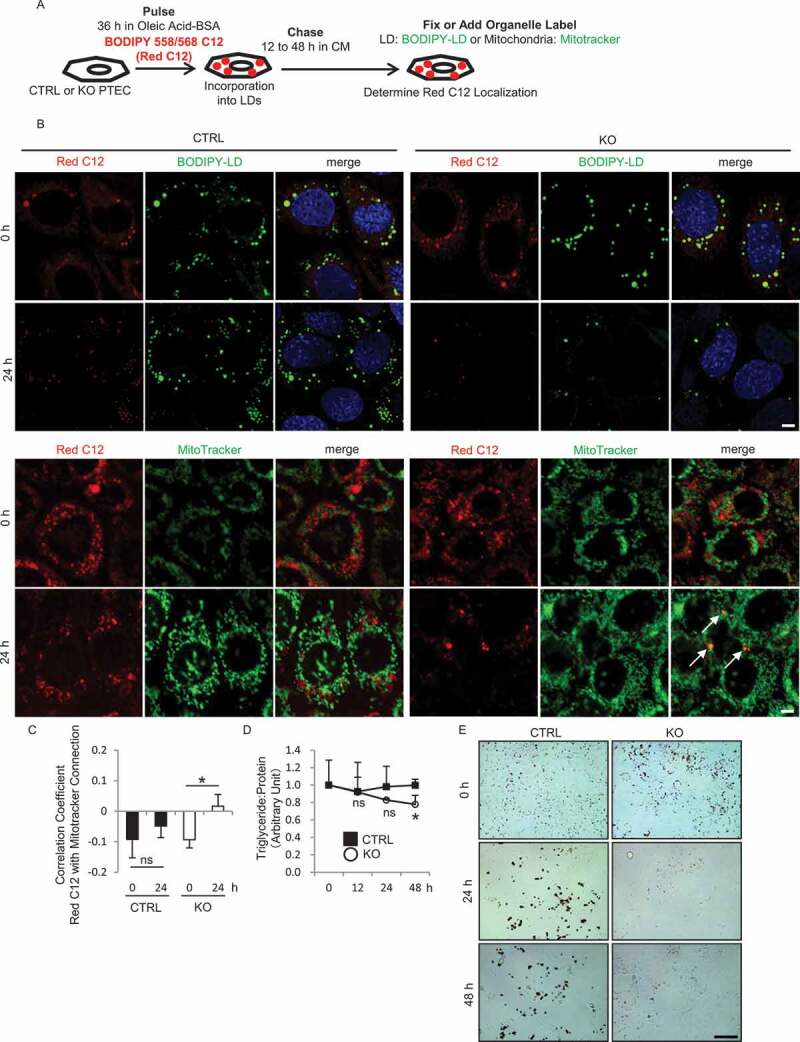
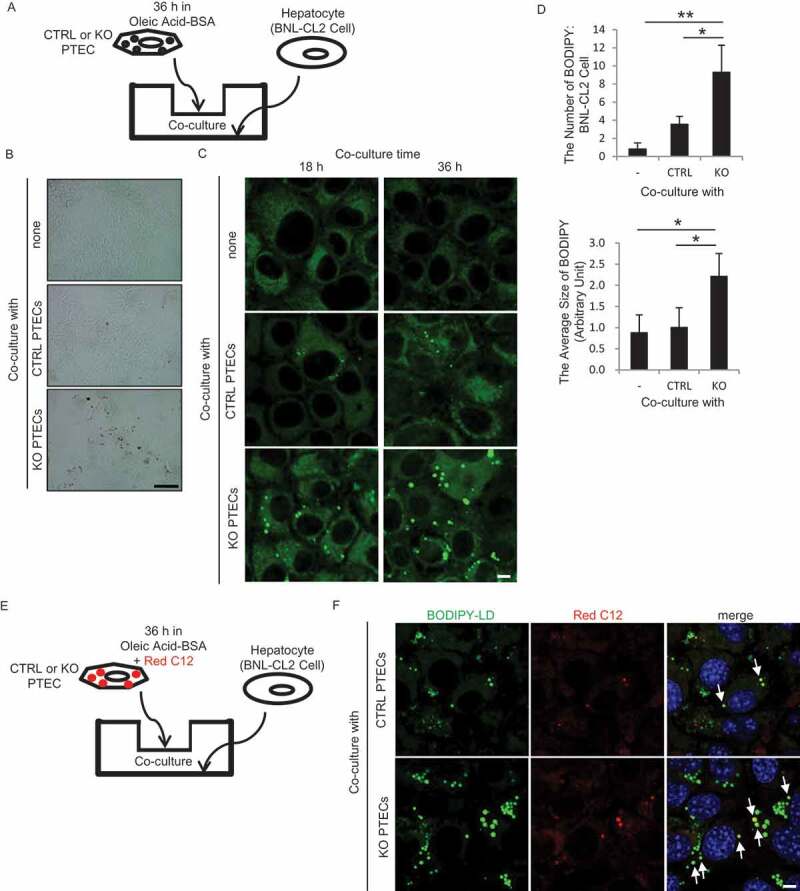
Macroautophagy/autophagy is a lysosomal degradation system which plays a protective role against kidney injury. RUBCN/Rubicon (RUN domain and cysteine-rich domain containing, Beclin 1-interacting protein) inhibits the fusion of autophagosomes and lysosomes. However, its physiological role in kidney proximal tubular epithelial cells (PTECs) remains uncertain. In the current study, we analyzed the phenotype of newly generated PTEC-specific rubcn-deficient (KO) mice. Additionally, we investigated the role of RUBCN in lipid metabolism using isolated rubcn-deficient PTECs. Although KO mice exhibited sustained high autophagic flux in PTECs, they were not protected from acute ischemic kidney injury. Unexpectedly, KO mice exhibited hallmark features of metabolic syndrome accompanied by expanded lysosomes containing multi-layered phospholipids in PTECs. RUBCN deficiency in cultured PTECs promoted the mobilization of phospholipids from cellular membranes to lysosomes via enhanced autophagy. Treatment of KO PTECs with oleic acid accelerated fatty acids transfer to mitochondria. Furthermore, KO PTECs promoted massive triglyceride accumulation in hepatocytes (BNL-CL2 cells) co-cultured in transwell, suggesting accelerated fatty acids efflux from the PTECs contributes to the metabolic syndrome in KO mice. This study shows that sustained high autophagic flux by RUBCN deficiency in PTECs leads to metabolic syndrome concomitantly with an accelerated mobilization of phospholipids from cellular membranes to lysosomes. Abbreviations: ABC: ATP binding cassette; ACADM: acyl-CoA dehydrogenase medium chain; ACTB: actin, beta; ATG: autophagy related; AUC: area under the curve; Baf: bafilomycin A1; BAT: brown adipose tissue; BODIPY: boron-dipyrromethene; BSA: bovine serum albumin; BW: body weight; CAT: chloramphenicol acetyltransferase; CM: complete medium; CPT1A: carnitine palmitoyltransferase 1a, liver; CQ: chloroquine; CTRL: control; EGFP: enhanced green fluorescent protein; CTSD: cathepsin D; EAT: epididymal adipose tissue; EGFR: epidermal growth factor receptor; EIF4EBP1: eukaryotic translation initiation factor 4E binding protein 1; FA: fatty acid; FBS: fetal bovine serum; GTT: glucose tolerance test; HE: hematoxylin and eosin; HFD: high-fat diet; I/R: ischemia-reperfusion; ITT: insulin tolerance test; KAP: kidney androgen regulated protein; KO: knockout; LAMP1: lysosomal associated membrane protein 1; LD: lipid droplet; LRP2: low density lipoprotein receptor related protein 2; MAP1LC3B: microtubule associated protein 1 light chain 3 beta; MAT: mesenteric adipose tissue; MS: mass spectrometry; MTOR: mechanistic target of rapamycin kinase; MTORC1: MTOR complex 1; NDRG1: N-myc downstream regulated 1; NDUFB5: NADH:ubiquinone oxidoreductase subunit B5; NEFA: non-esterified fatty acid; OA: oleic acid; OCT: optimal cutting temperature; ORO: Oil Red O; PAS: Periodic-acid Schiff; PFA: paraformaldehyde; PIK3C3: phosphatidylinositol 3-kinase catalytic subunit type 3; PPARA: peroxisome proliferator activated receptor alpha; PPARGC1A: PPARG coactivator 1 alpha; PTEC: proximal tubular epithelial cell; RAB7A: RAB7A, member RAS oncogene family; RPS6: ribosomal protein S6; RPS6KB1: ribosomal protein S6 kinase B1; RT: reverse transcription; RUBCN: rubicon autophagy regulator; SAT: subcutaneous adipose tissue; SFC: supercritical fluid chromatography; SQSTM1: sequestosome 1; SREBF1: sterol regulatory element binding transcription factor 1; SV-40: simian virus-40; TFEB: transcription factor EB; TG: triglyceride; TS: tissue specific; TUNEL: terminal deoxynucleotidyl transferase-mediated dUTP nick-end labeling; UN: urea nitrogen; UQCRB: ubiquinol-cytochrome c reductase binding protein; UVRAG: UV radiation resistance associated; VPS: vacuolar protein sorting; WAT: white adipose tissue.
Keywords: Autophagic flux; RUBCN/Rubicon; autophagy; lipid efflux; lysosome; metabolic syndrome.
Conflict of interest statement
No potential conflict of interest was reported by the authors.
Figures

Similar articles
-
Eicosapentaenoic acid attenuates renal lipotoxicity by restoring autophagic flux.Autophagy. 2021 Jul;17(7):1700-1713. doi: 10.1080/15548627.2020.1782034. Epub 2020 Jun 28. Autophagy. 2021. PMID: 32546086 Free PMC article.
-
AMPK protects proximal tubular epithelial cells from lysosomal dysfunction and dedifferentiation induced by lipotoxicity.Autophagy. 2025 Apr;21(4):860-880. doi: 10.1080/15548627.2024.2435238. Epub 2024 Dec 15. Autophagy. 2025. PMID: 39675352 Free PMC article.
-
TXNIP/VDUP1 attenuates steatohepatitis via autophagy and fatty acid oxidation.Autophagy. 2021 Sep;17(9):2549-2564. doi: 10.1080/15548627.2020.1834711. Epub 2020 Nov 16. Autophagy. 2021. PMID: 33190588 Free PMC article.
-
The ménage à trois of autophagy, lipid droplets and liver disease.Autophagy. 2022 Jan;18(1):50-72. doi: 10.1080/15548627.2021.1895658. Epub 2021 Apr 2. Autophagy. 2022. PMID: 33794741 Free PMC article. Review.
-
How autophagy controls the intestinal epithelial barrier.Autophagy. 2022 Jan;18(1):86-103. doi: 10.1080/15548627.2021.1909406. Epub 2021 Apr 27. Autophagy. 2022. PMID: 33906557 Free PMC article. Review.
Cited by
-
Age-related TFEB downregulation in proximal tubules causes systemic metabolic disorders and occasional apolipoprotein A4-related amyloidosis.JCI Insight. 2024 Dec 19;10(3):e184451. doi: 10.1172/jci.insight.184451. JCI Insight. 2024. PMID: 39699959 Free PMC article.
-
The AMPK-Sirtuin 1-YAP axis is regulated by fluid flow intensity and controls autophagy flux in kidney epithelial cells.Nat Commun. 2023 Dec 5;14(1):8056. doi: 10.1038/s41467-023-43775-1. Nat Commun. 2023. PMID: 38052799 Free PMC article.
-
Lipid Nanoparticle-Mediated Delivery of CRISPR-Cas9 Against Rubicon Ameliorates NAFLD by Modulating CD36 Along with Glycerophospholipid Metabolism.Adv Sci (Weinh). 2024 Aug;11(31):e2400493. doi: 10.1002/advs.202400493. Epub 2024 Jun 18. Adv Sci (Weinh). 2024. PMID: 38894572 Free PMC article.
-
Targeting Renal Proximal Tubule Cells in Obesity-Related Glomerulopathy.Pharmaceuticals (Basel). 2023 Sep 5;16(9):1256. doi: 10.3390/ph16091256. Pharmaceuticals (Basel). 2023. PMID: 37765062 Free PMC article. Review.
-
Lipid Droplet-Mitochondria Contacts in Health and Disease.Int J Mol Sci. 2024 Jun 22;25(13):6878. doi: 10.3390/ijms25136878. Int J Mol Sci. 2024. PMID: 38999988 Free PMC article. Review.
References
Publication types
MeSH terms
Substances
LinkOut - more resources
Full Text Sources
Other Literature Sources
Research Materials
Miscellaneous