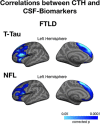
Contribution of CSF biomarkers to early-onset Alzheimer's disease and frontotemporal dementia neuroimaging signatures
- PMID: 31944489
- PMCID: PMC7267898
- DOI: 10.1002/hbm.24925
Contribution of CSF biomarkers to early-onset Alzheimer's disease and frontotemporal dementia neuroimaging signatures
Abstract
Prior studies have described distinct patterns of brain gray matter and white matter alterations in Alzheimer's disease (AD) and frontotemporal lobar degeneration (FTLD), as well as differences in their cerebrospinal fluid (CSF) biomarkers profiles. We aim to investigate the relationship between early-onset AD (EOAD) and FTLD structural alterations and CSF biomarker levels. We included 138 subjects (64 EOAD, 26 FTLD, and 48 controls), all of them with a 3T MRI brain scan and CSF biomarkers available (the 42 amino acid-long form of the amyloid-beta protein [Aβ42], total-tau protein [T-tau], neurofilament light chain [NfL], neurogranin [Ng], and 14-3-3 levels). We used FreeSurfer and FSL to obtain cortical thickness (CTh) and fraction anisotropy (FA) maps. We studied group differences in CTh and FA and described the "AD signature" and "FTLD signature." We tested multiple regression models to find which CSF-biomarkers better explained each disease neuroimaging signature. CTh and FA maps corresponding to the AD and FTLD signatures were in accordance with previous literature. Multiple regression analyses showed that the biomarkers that better explained CTh values within the AD signature were Aβ and 14-3-3; whereas NfL and 14-3-3 levels explained CTh values within the FTLD signature. Similarly, NfL levels explained FA values in the FTLD signature. Ng levels were not predictive in any of the models. Biochemical markers contribute differently to structural (CTh and FA) changes typical of AD and FTLD.
Keywords: Alzheimer's disease; Frontotemporal Dementia; biological markers; magnetic resonance imaging.
© 2020 The Authors. Human Brain Mapping published by Wiley Periodicals, Inc.
Conflict of interest statement
H.Z. has served at scientific advisory boards of Roche Diagnostics, Wave, Samumed and CogRx, has given lectures in symposia sponsored by Biogen and Alzecure, and is a cofounder of Brain Biomarker Solutions in Gothenburg AB, a GU Ventures‐based platform company at the University of Gothenburg (all outside the submitted work). K.B. has served as a consultant or at advisory boards for Alector, Biogen, CogRx, Lilly, MagQu, Novartis, and Roche Diagnostics, and is a cofounder of Brain Biomarker Solutions in Gothenburg AB, a GU Venture‐based platform company at the University of Gothenburg, all unrelated to the work presented in this article. The other authors have nothing to disclose.
Figures


References
-
- Albert, M. S. , DeKosky, S. T. , Dickson, D. , Dubois, B., Feldman H.H., Fox, N.C., Phelps, C.H., (2011). The diagnosis of mild cognitive impairment due to Alzheimer's disease: Recommendations from the National Institute on Aging‐Alzheimer's association workgroups on diagnostic guidelines for Alzheimer's disease. Alzheimers Dement, 7, 270–279. - PMC - PubMed
-
- Alcolea, D. , Vilaplana, E. , Suárez‐Calvet, M. , Illán‐Gala, I., Blesa, R., Clarimón, J., … Lleó, A. (2017). CSF sAPPβ, YKL‐40, and neurofilament light in frontotemporal lobar degeneration. Neurology, 89(2), 178–188. - PubMed
-
- Blennow, K. , Diaz‐Lucena, D. , Zetterberg, H. , Villar‐Pique, A., Karch, A., Vidal, E., … Llorens, F. (2019). CSF neurogranin as a neuronal damage marker in CJD: A comparative study with AD. Journal of Neurology, Neurosurgery, and Psychiatry, 90(8), 846–853. - PubMed
-
- Blennow, K. , & Zetterberg, H. (2018). Biomarkers for Alzheimer's disease: Current status and prospects for the future. Journal of Internal Medicine, 284(6), 643–663. - PubMed
-
- Burkhard, P. R. , Sanchez, J. C. , Landis, T. , Hochstrasser, D.S. (2001). CSF detection of the 14‐3‐3 protein in unselected patients with dementia. Neurology, 56(11), 1528–1533. - PubMed

