. 2020 Jun;39(6):2088-2099.
doi: 10.1109/TMI.2020.2964499. Epub 2020 Jan 6.

Explainable Anatomical Shape Analysis Through Deep Hierarchical Generative Models

Explainable Anatomical Shape Analysis Through Deep Hierarchical Generative Models

Carlo Biffi et al. IEEE Trans Med Imaging. 2020 Jun.

Abstract

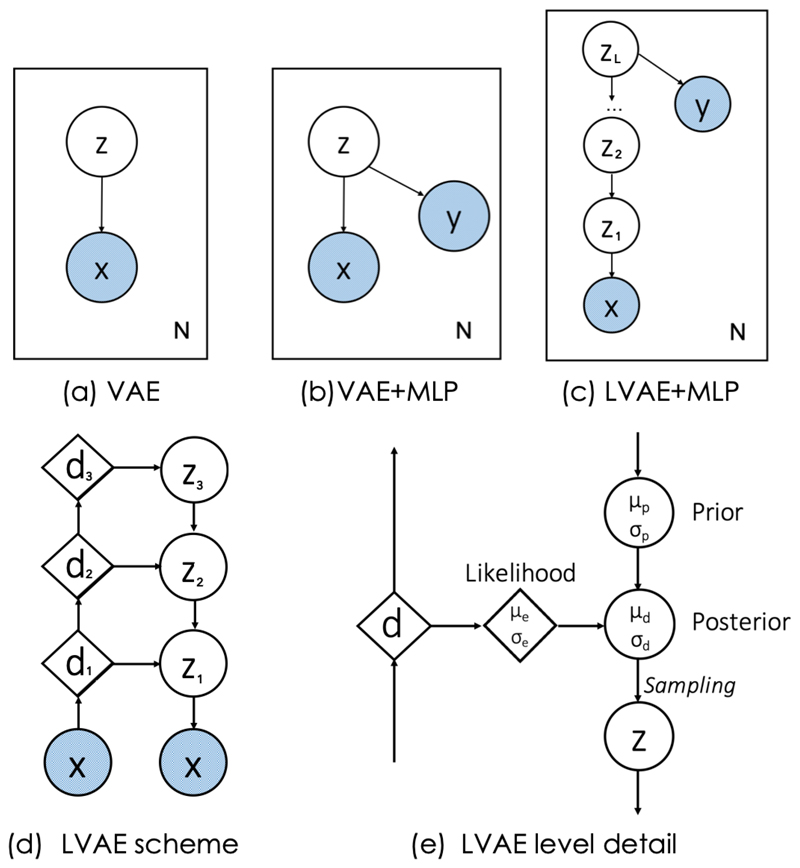
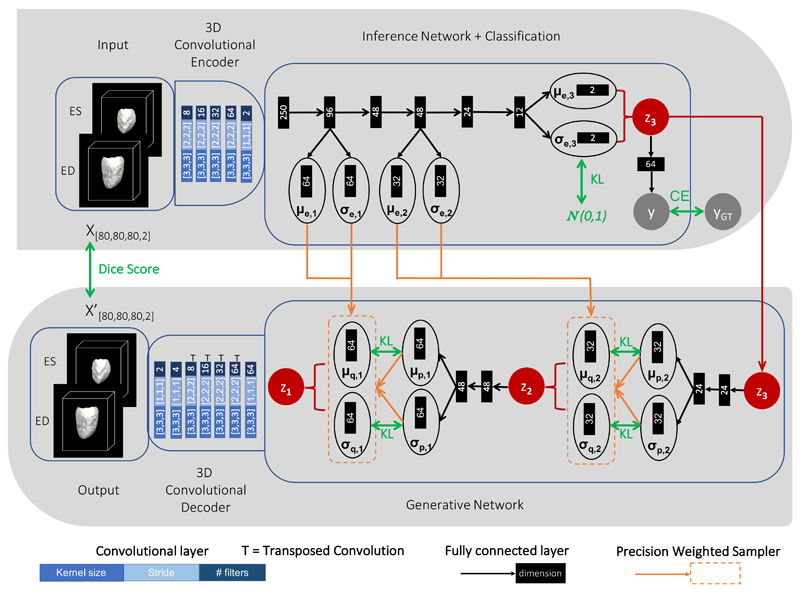
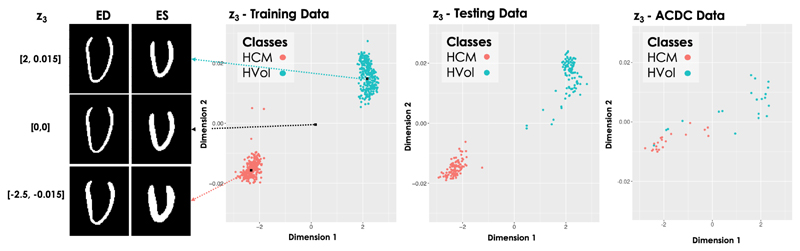
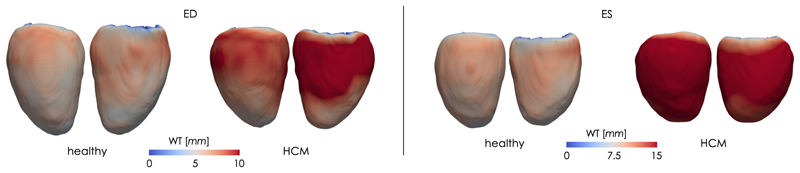
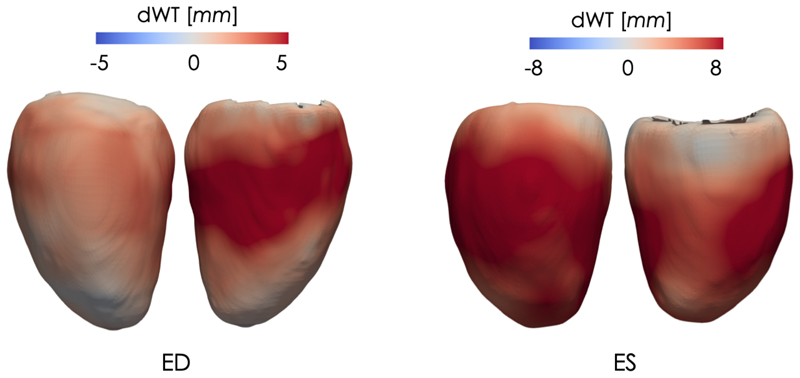
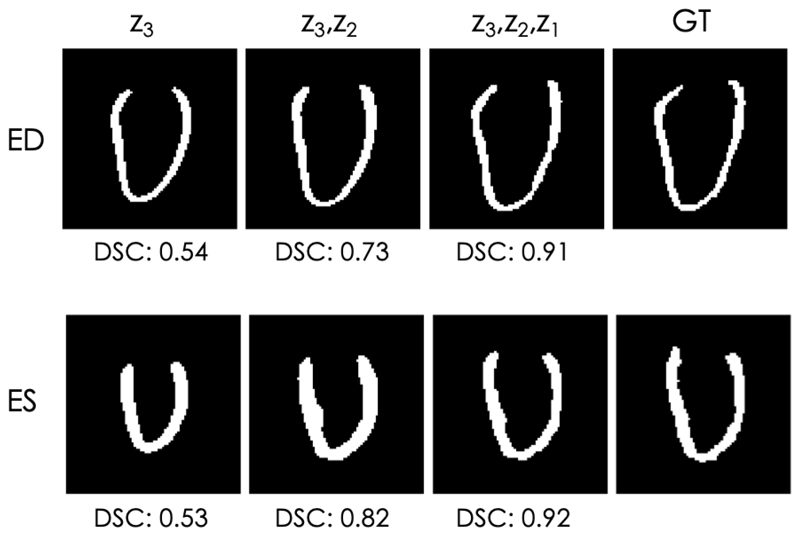
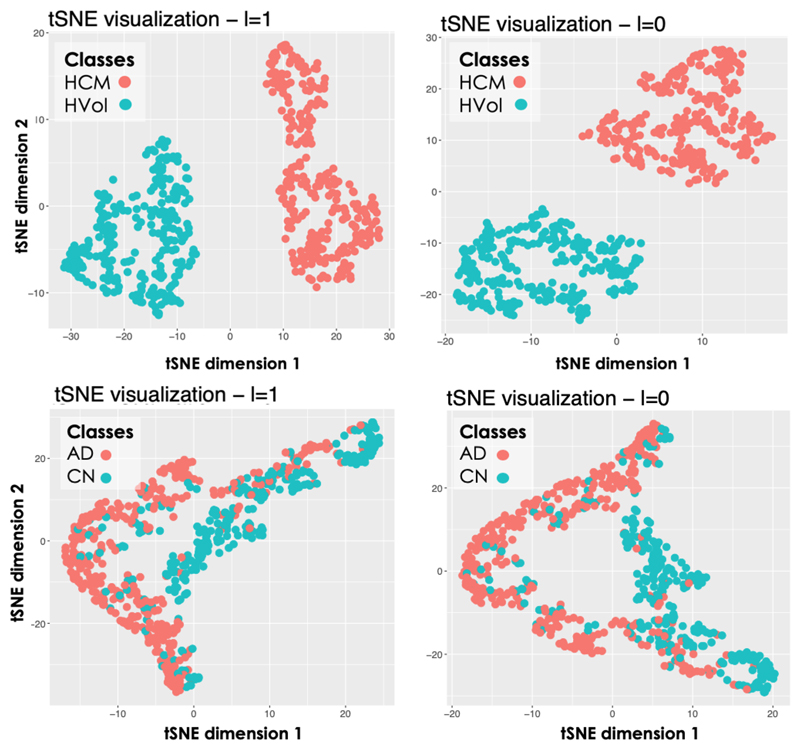
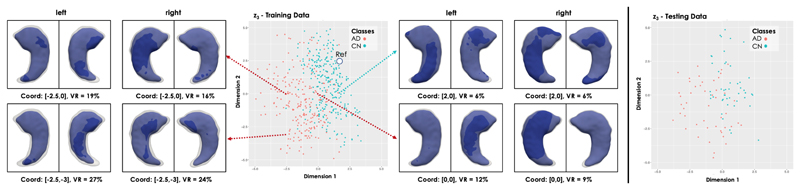
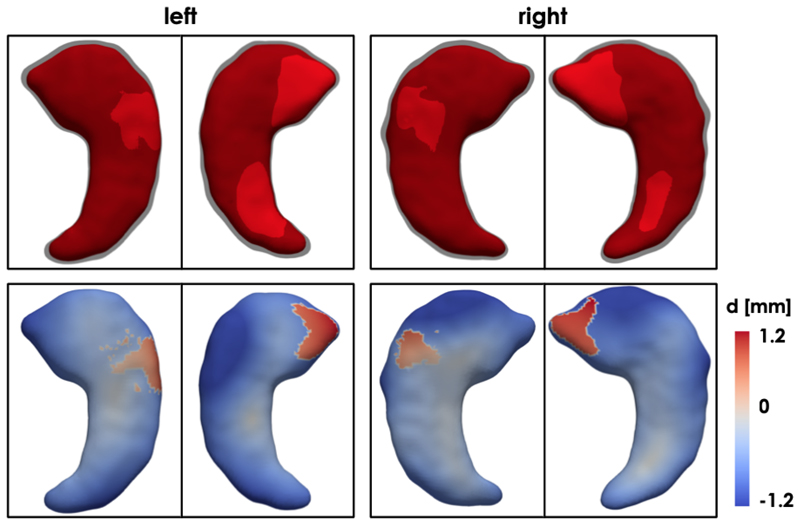
Quantification of anatomical shape changes currently relies on scalar global indexes which are largely insensitive to regional or asymmetric modifications. Accurate assessment of pathology-driven anatomical remodeling is a crucial step for the diagnosis and treatment of many conditions. Deep learning approaches have recently achieved wide success in the analysis of medical images, but they lack interpretability in the feature extraction and decision processes. In this work, we propose a new interpretable deep learning model for shape analysis. In particular, we exploit deep generative networks to model a population of anatomical segmentations through a hierarchy of conditional latent variables. At the highest level of this hierarchy, a two-dimensional latent space is simultaneously optimised to discriminate distinct clinical conditions, enabling the direct visualisation of the classification space. Moreover, the anatomical variability encoded by this discriminative latent space can be visualised in the segmentation space thanks to the generative properties of the model, making the classification task transparent. This approach yielded high accuracy in the categorisation of healthy and remodelled left ventricles when tested on unseen segmentations from our own multi-centre dataset as well as in an external validation set, and on hippocampi from healthy controls and patients with Alzheimer's disease when tested on ADNI data. More importantly, it enabled the visualisation in three-dimensions of both global and regional anatomical features which better discriminate between the conditions under exam. The proposed approach scales effectively to large populations, facilitating high-throughput analysis of normal anatomy and pathology in large-scale studies of volumetric imaging.


Figures

Fig. 1
Fig. 1
Graphical models of a standard VAE (a), of our previously proposed method [30] (b) and the new LVAE-based approach (c). x represents and anatomical segmentation, y the disease class label and z the latent variables to learn. Schematic representation of a three-level LVAE (d) and of the flow of information (e). Circles represent stochastic variables, diamonds represent deterministic variables. Variables in light blue represent the inputs of the network.
Fig. 2
Fig. 2
Detailed scheme of the LVAE+MLP architecture adopted in this work for the cardiac application. Top: encoder model; Bottom: decoder model. At testing, segmentations class scores y are computed with z3 = μe,3. The green arrows indicate the loss function terms used to train the network.
Fig. 3
Fig. 3
Latent space clusters in the highest latent space (l = 3) obtained by the proposed LVAE+MLP model on both the in-house training and testing datasets as well as on the ACDC dataset (entirely used as an additional testing dataset). Dimension 1 and 2 represent the two dimensions of μe,3. On the left, long-axis sections of the reconstructed 3D segmentations at ED and ES obtained by sampling from three points in z3 are shown.
Fig. 4
Fig. 4
Average healthy and HCM shapes at ED and ES sampled from the two clusters in the highest latent space of proposed LVAE+MLP model. The colormap encodes the vertex-wise wall thickness (WT), measured in mm.
Fig. 5
Fig. 5
Point-wise difference in wall thickness (dWT) at ED and ES between the healthy and the HCM average shapes of Fig. 4. Left - lateral wall; Right - septal wall.
Fig. 6
Fig. 6
Long-axis section of reconstructed segmentations at ED and ES by the LVAE+MLP model, using only z3 information (first column) or also using the posterior information of the other latent spaces (z2, z1). Last column: ground-truth (GT) segmentation. DSC = Dice Score between the segmentation at that column and the GT.
Fig. 7
Fig. 7
tSNE visualisation of the latent spaces z2 and z1. Top: cardiac application. Bottom: brain application.
Fig. 8
Fig. 8
Latent space clusters in the highest latent space (l = 3) obtained by the proposed LVAE+MLP model on the brain dataset. Left and right hippocampus shapes (in blue) at four points in the latent space have been reconstructed and showed together with a reference shape (in grey and opaque) sampled from the healthy control shapes (Ref, Coord: [2,2]). The first image is a view from the top, second image a view from the bottom.
Fig. 9
Fig. 9
First row: Average healthy (in grey and opaque) and AD (in red) left and right hippocampus shapes sampled from the two clusters in the highest latent space of proposed LVAE+MLP model. Second row: vertex-by-vertex L2 distance between the two mean shapes.

References

    1. Fonseca CG, et al. The Cardiac Atlas Project: an imaging database for computational modeling and statistical atlases of the heart. Bioinformatics. 2011;27(16):2288–2295. - PMC - PubMed
    1. Attar R, et al. Quantitative CMR Population imaging on 20,000 subjects of the UK Biobank imaging study: LV/RV quantification pipeline and its evaluation. Medical Image Analysis. 2019 - PubMed
    1. Mueller SG, et al. The alzheimer’s disease neuroimaging initiative. Neuroimaging Clinics. 2005;15(4):869–877. - PMC - PubMed
    1. Nogovitsyn N, et al. Testing a deep convolutional neural network for automated hippocampus segmentation in a longitudinal sample of healthy participants. NeuroImage. 2019;197:589–597. - PubMed
    1. Ledig C, Schuh A, Guerrero R, Heckemann RA, Rueckert D. Structural brain imaging in alzheimers disease and mild cognitive impairment: biomarker analysis and shared morphometry database. Scientific reports. 2018;8(1) 11258. - PMC - PubMed

Publication types