. 2020 Apr 1;130(4):2024-2040.
doi: 10.1172/JCI125771.

Profilin 1 delivery tunes cytoskeletal dynamics toward CNS axon regeneration

Affiliations

Profilin 1 delivery tunes cytoskeletal dynamics toward CNS axon regeneration

Rita Pinto-Costa et al. J Clin Invest. .

Abstract

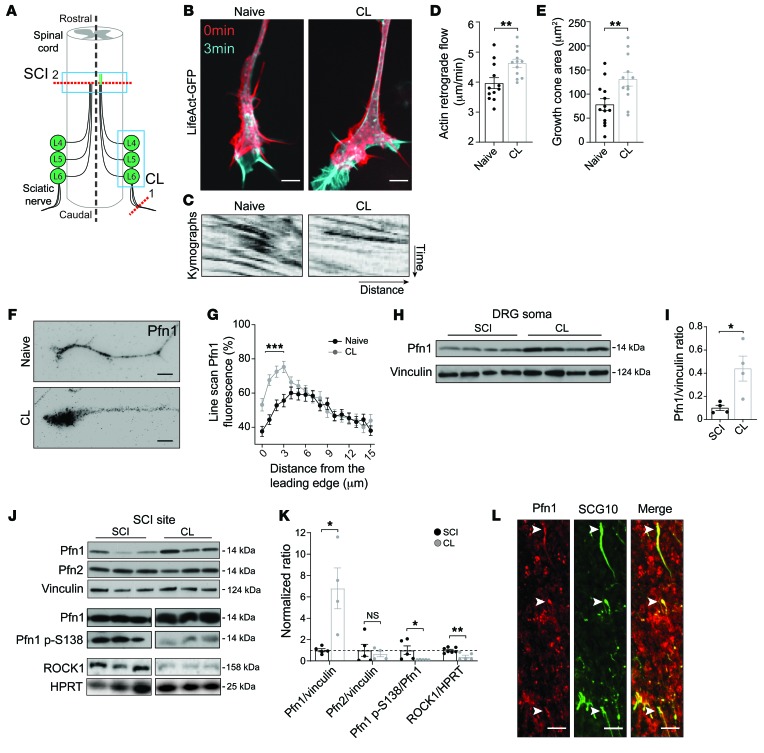
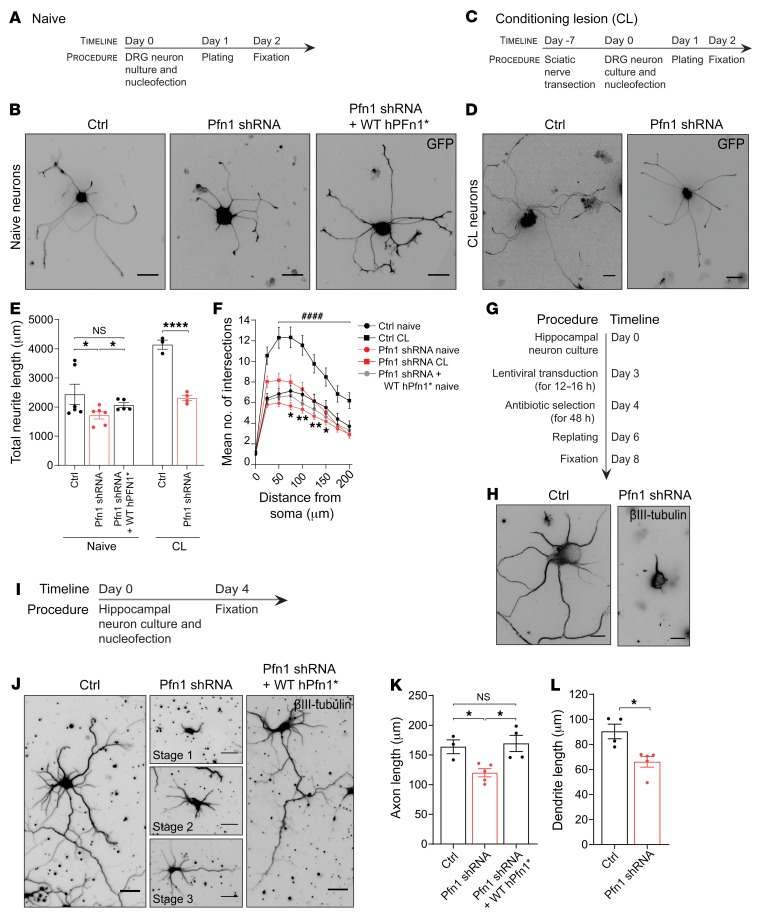
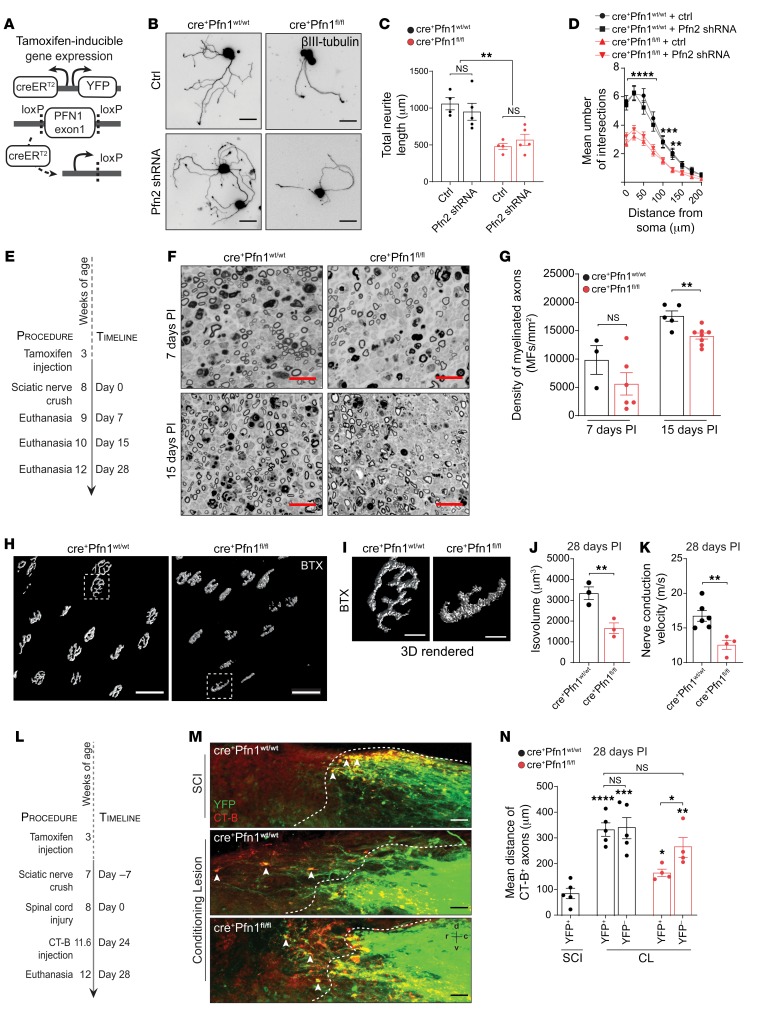
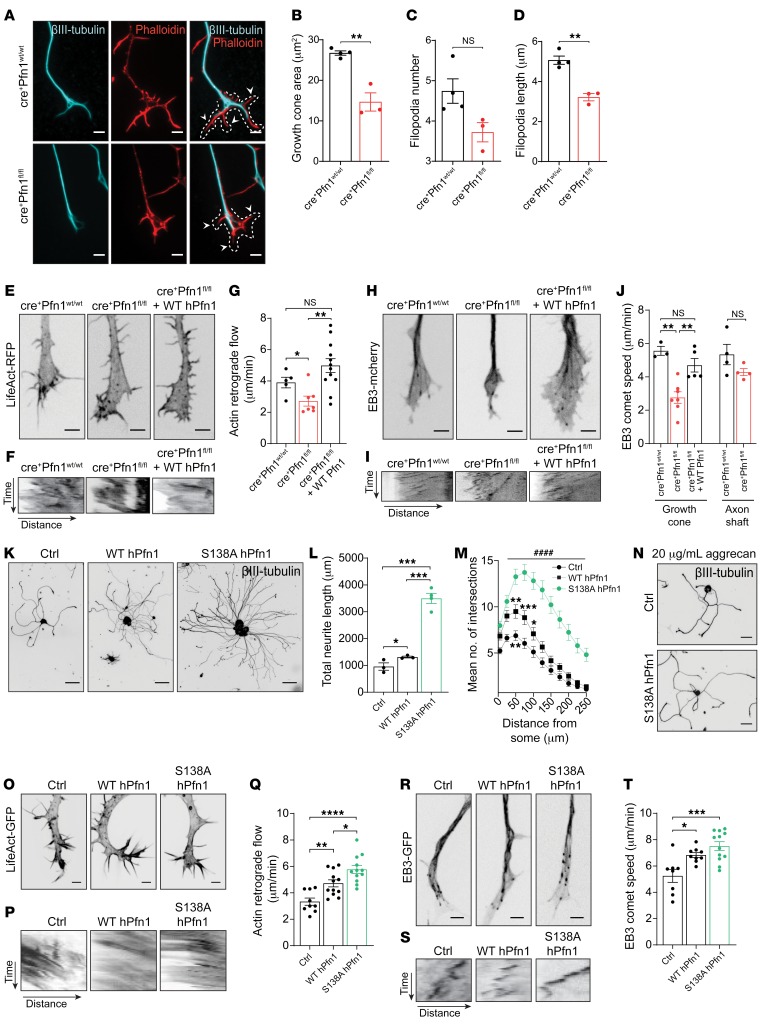
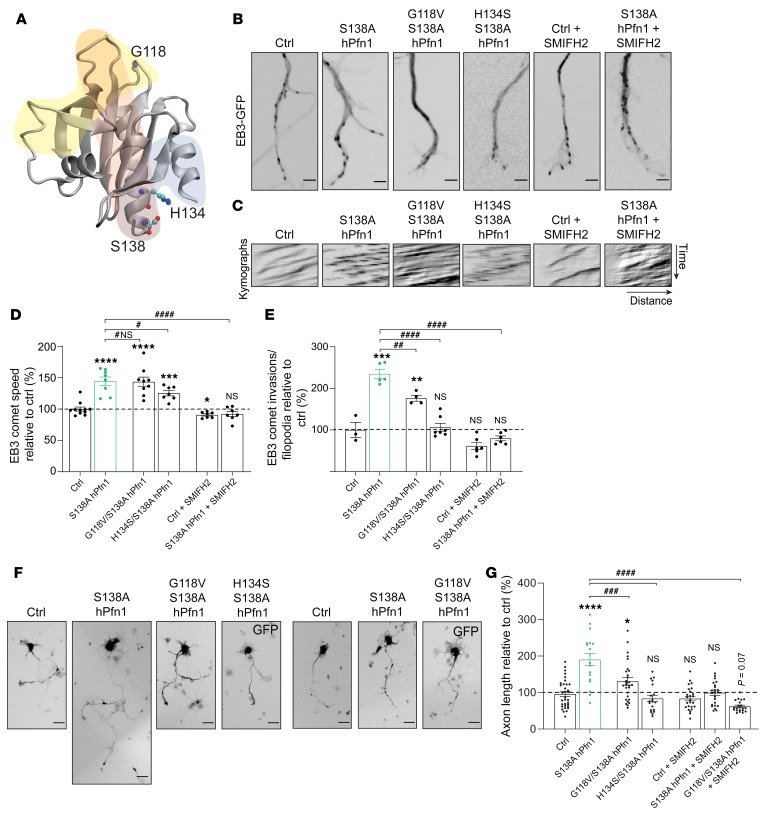
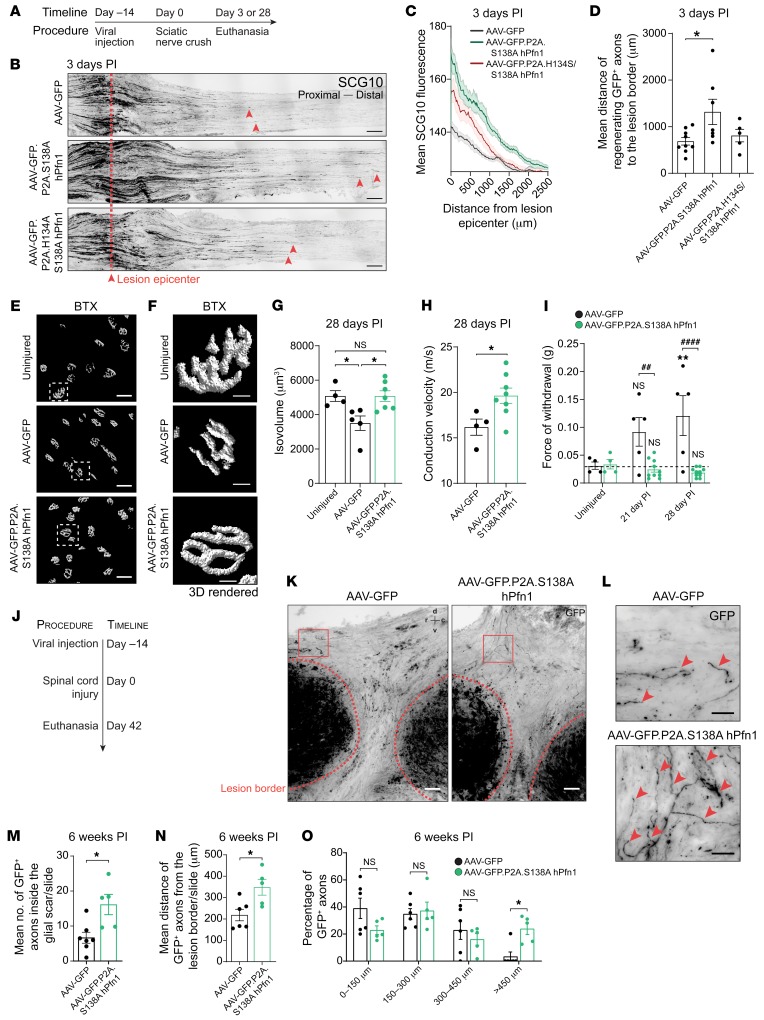
After trauma, regeneration of adult CNS axons is abortive, causing devastating neurologic deficits. Despite progress in rehabilitative care, there is no effective treatment that stimulates axonal growth following injury. Using models with different regenerative capacities, followed by gain- and loss-of-function analysis, we identified profilin 1 (Pfn1) as a coordinator of actin and microtubules (MTs), powering axonal growth and regeneration. In growth cones, Pfn1 increased actin retrograde flow, MT growth speed, and invasion of filopodia by MTs, orchestrating cytoskeletal dynamics toward axonal growth. In vitro, active Pfn1 promoted MT growth in a formin-dependent manner, whereas localization of MTs to growth cone filopodia was facilitated by direct MT binding and interaction with formins. In vivo, Pfn1 ablation limited regeneration of growth-competent axons after sciatic nerve and spinal cord injury. Adeno-associated viral (AAV) delivery of constitutively active Pfn1 to rodents promoted axonal regeneration, neuromuscular junction maturation, and functional recovery of injured sciatic nerves, and increased the ability of regenerating axons to penetrate the inhibitory spinal cord glial scar. Thus, we identify Pfn1 as an important regulator of axonal regeneration and suggest that AAV-mediated delivery of constitutively active Pfn1, together with the identification of modulators of Pfn1 activity, should be considered to treat the injured nervous system.

Keywords: Cell Biology; Cytoskeleton; Neuroscience.


Conflict of interest statement

Conflict of interest: The authors have declared that no conflict of interest exists.

Figures

Figure 1
Figure 1. Active Pfn1 is increased after conditioning lesion (CL).
(A) Representation of SCI and of the CL paradigm (left and right to dashed line, respectively). In CL, a sciatic nerve injury (1) is performed 1 week prior to SCI (2), potentiating regeneration of central DRG axons (right green line, rostral to SCI). Western blot analyses of the dorsal SCI site and of DRG (blue rectangles) were performed. (B) Live-cell imaging of LifeAct-GFP in growth cones of naive and conditioned adult DRG neurons. Scale bars: 4 μm. (C) Kymographs related to B. (D) Quantification of actin retrograde flow and (E) growth cone area related to B. Data represent mean ± SEM (n = 12–13 growth cones/condition). **P < 0.01 by Student’s t test. (F) Pfn1 staining in growth cones of cultured naive and conditioned DRG neurons. Scale bars: 5 μm. (G) Quantification of line scans of Pfn1 fluorescence in relation to distance from growth cone leading edge related to F. Data represent mean ± SEM (n = 48–57 neurons/condition). ***P < 0.001 by 2-way ANOVA with Sidak’s post hoc test. (H) Western blot and (I) respective quantification showing Pfn1 levels in DRG of rats with SCI or CL. Vinculin was used as control. Data represent mean ± SEM (n = 4 animals/condition). *P < 0.05 by Student’s t test. (J) Western blot and (K) respective quantification showing Pfn1, Pfn1 p-S138, ROCK1, and Pfn2 levels in samples from the dorsal SCI site (horizontal blue rectangle in A), 1 week after SCI or CL. HPRT and vinculin were used as controls. Data represent mean ± SEM (n = 4–7 animals/condition). *P < 0.05, **P < 0.01 by Student’s t test. NS, not significant. (L) Pfn1 immunofluorescence (red) in sensory SCG10-positive axons (green) in a CL spinal cord. Arrowheads highlight growth cones. Scale bars: 20 μm.
Figure 2
Figure 2. Pfn1 downregulation impairs axonal growth in vitro in different neuronal types and developmental stages.
(A) Timeline of naive DRG neuron cultures. (B) GFP-expressing naive adult DRG neurons transfected with control empty (Ctrl) or Pfn1 shRNA plasmid. (C) Timeline of conditioned DRG neuron cultures. (D) GFP-expressing conditioned DRG neurons transfected with Ctrl or Pfn1 shRNA plasmid. Scale bars in B and D: 70 μm. (E) Total neurite length related to B and D. Data represent mean ± SEM (n = 3–6 independent samples/condition; 6–36 neurons/sample). *P < 0.05; ****P < 0.0001; by Student’s t test. NS, not significant. (F) Branching analysis related to E. Data represent mean ± SEM. *P < 0.05, **P < 0.01 refers to Ctrl versus Pfn1 shRNA of naive DRG neurons; ####P < 0.0001 refers to Ctrl versus Pfn1 shRNA of CL DRG neurons; 2-way ANOVA with Tukey’s post hoc test. (G) Timeline for Pfn1 downregulation in DIV3 hippocampal neurons using lentiviral infection. (H) βIII-tubulin in hippocampal neurons after lentiviral expression of control empty (Ctrl) or Pfn1 shRNA plasmid. Scale bars: 10 μm. (I) Timeline for Pfn1 downregulation in DIV0 hippocampal neurons. (J) βIII-tubulin in DIV4 hippocampal neurons expressing a control empty (Ctrl) or a Pfn1 shRNA plasmid. Middle panels (Pfn1 shRNA) show representative images of stage 1 to 3 hippocampal neurons. Scale bars: 30 μm (Ctrl and Pfn1 shRNA + WT hPfn1*) and 20 μm (Pfn1 shRNA). (K) Axonal length related to J. Data represent mean ± SEM (n = 3–5 independent samples/condition; 11–26 neurons/sample). *P < 0.05 by 1-way ANOVA Tukey’s post hoc test. NS, not significant. (L) Dendritic length of DIV7 hippocampal neurons expressing control empty (Ctrl) or Pfn1 shRNA plasmid. Data represent mean ± SEM (n = 4–5 independent samples/condition; 3–25 neurons/sample). *P < 0.05 by Student’s t test. All rescue experiments were performed using shRNA-resistant WT Pfn1 (WT hPfn1*).
Figure 3
Figure 3. Pfn1 depletion in vivo decreases axonal regeneration and functional recovery.
(A) Neuronal Thy1 promoter drives Cre recombinase and YFP expression in cre+Pfn1 mice after tamoxifen administration, leading to Pfn1 exon1 excision. (B) βIII-tubulin staining of cre+Pfn1 adult DRG neurons in the presence or absence of a Pfn2 shRNA–expressing plasmid. Scale bars: 50 μm. (C) Total neurite length and (D) branching analysis related to B. Only YFP+ (Pfn1-KO) neurons were quantified. Data represent mean ± SEM (n = 4–5 independent samples/condition; 5–35 neurons/sample). **P < 0.01; ***P < 0.001; ****P < 0.0001 by 1-way ANOVA with Tukey’s post hoc test (C) or 2-way ANOVA with Tukey’s post hoc test (D). (E) Strategy to assess PNS regeneration. (F) PPD-stained sciatic nerves from cre+Pfn1 mice, 7 and 15 days postinjury (PI). Scale bars: 20 μm. (G) Myelinated axon density related to F. Data represent mean ± SEM (n = 3–8 animals/condition). **P < 0.01 by Student’s t test. MFs, myelinated fibers. (H) 3D surface–rendered reconstructions of NMJs fluorescently labeled with α-bungarotoxin (BTX). Scale bars: 50 μm. (I) Zoom-ins of H. Scale bars: 10 μm. (J) Volume quantification of NMJs (28 days PI). Data represent mean ± SEM (n = 3 animals/condition). **P < 0.01 by Student’s t test. (K) Motor nerve conduction velocity (28 days PI). Data represent mean ± SEM (n = 4–6 animals/condition). **P < 0.01 by Student’s t test. (L) Strategy to assess CNS regeneration. (M) YFP+ (green)/CT-B+ (red) axons (arrowheads) in spinal cord following SCI in cre+Pfn1wt/wt and CL in either cre+Pfn1wt/wt or cre+Pfn1fl/fl mice. Scale bars: 50 μm. Dashed line, lesion border; r, rostral; c, caudal; d, dorsal; v, ventral. (N) Quantification of mean growth distance of YFP+ (Pfn1-KO) and YFP ascending sensory axons (CT-B+ axons) from the rostral end of the injured dorsal column tract. Data represent mean ± SEM (n = 4–5 animals/condition). *P < 0.05; **P < 0.01; ***P < 0.001; ****P < 0.0001 by 1-way ANOVA with Tukey’s post hoc test. NS, not significant.
Figure 4
Figure 4. Pfn1 regulates actin and MT dynamics in growth cones.
(A) βIII-tubulin (cyan) and actin (red) in cre+Pfn1 DRG growth cones. Scale bars: 3 μm. Dashed line, cone area; arrowheads, filopodia. (B) Growth cone area, (C) filopodia number, and (D) length related to A. Data represent mean ± SEM (n = 32–40 neurons/animal, 3–4 animals/condition). **P < 0.01 by Student’s t test. (E) LifeAct-RFP in cre+Pfn1 DRG growth cones. Scale bars: 3 μm. (F) Kymographs and (G) actin flow quantification related to E. Data represent mean ± SEM (n = 5–12 filopodia/condition; representative of 3 to 4 growth cones/condition. *P < 0.05; **P < 0.01 by 1-way ANOVA with Tukey’s post hoc test. (H) EB3-mCherry in cre+Pfn1 DRG growth cones. (I) Kymographs and (J) EB3 speed quantification related to H in growth cones and shaft. Data represent mean ± SEM (n = 3–7 growth cones/condition). **P < 0.01 by 1-way ANOVA with Tukey’s post hoc test. (K) βIII-tubulin in WT and S138A hPfn1 DRG neurons. Scale bar: 80 μm. (L) Total neurite length and (M) branching related to K. For L and M, data represent mean ± SEM. (L) *P < 0.05 and ***P < 0.001, n = 3–4 independent samples/condition; 13–31 neurons/sample. (M) *P < 0.05, **P < 0.01, ***P < 0.001 refers to Ctrl versus WT hPfn1; ####P < 0.0001 refers to Ctrl versus S138A hPfn1; 2-way ANOVA with Tukey’s post hoc test. n = 100–113 neurons/condition. (N) βIII-tubulin in S138A hPfn1 DRG neurons cultured on aggrecan. Scale bars: 50 μm. (O) LifeAct-GFP, (P) kymographs, and (Q) actin flow quantification in growth cones related to K. (R) EB3-GFP, (S) kymographs, and (T) EB3 speed quantification in growth cones related to K. Scale bars (O and R): 3 μm. (Q and T) Data represent mean ± SEM (n = 8–12 growth cones/condition). *P < 0.05, **P < 0.01, ***P < 0.001, ****P < 0.0001 by 1-way ANOVA with Tukey’s post hoc test. NS, not significant.
Figure 5
Figure 5. S138A Pfn1 enhances MT dynamics via direct MT binding and formins.
(A) Crystal structure of hPfn1 (PDB code: 1cf0). Residues G118 (MT-binding), H134 (poly-proline-binding), and S138 (ROCK phosphorylation site, mediating inactivation of Pfn1-related functions) are highlighted. Actin-, poly-proline–, and PI(4,5)P2-binding regions of Pfn1 are shadowed in light yellow, gray, and red, respectively (adapted from ref. 66). (B) Live-cell imaging of EB3-GFP in hippocampal neurons transfected with EB3-GFP and either a control empty vector (Ctrl) or plasmids expressing S138A hPfn1 or S138A Pfn1 mutants (G118V/S138A or H134S/S138A hPfn1); Ctrl and S138A hPfn1 treated with SMIFH2 are also shown. Scale bars: 2 μm. (C) Kymographs related to B. (D) Analysis of MT growth speed and (E) EB3 comet invasion frequency per filopodia. In D and E, data represent mean ± SEM (n = 7–11 [D] and n= 3–7 [E] growth cones/condition). *P < 0.05, **P < 0.01, ***P < 0.001, ****P < 0.0001; NS, not significant in relation to Ctrl. #P < 0.05, ##P < 0.01, ####P < 0.0001; #NS, not significant in relation to S138A hPfn1. (F) GFP+ hippocampal neurons transfected with either a control empty vector (Ctrl) or plasmids expressing different hPfn1 mutants, either untreated or treated with SMIFH2, whenever indicated. Scale bars: 30 μm. (G) Quantification of axonal length related to F. Data represent mean ± SEM (n =18–33 neurons/condition; representative of 3–5 independent experiments/condition). *P < 0.05, ****P < 0.0001; NS, not significant in relation to Ctrl. ###P < 0.001 and ####P < 0.0001 in relation to S138A hPfn1; both by 1-way ANOVA with Tukey’s post hoc test.
Figure 6
Figure 6. In vivo delivery of S138A hPfn1 elicits regeneration of peripheral and CNS axons.
(A) Strategy to assess peripheral regeneration following viral delivery of S138A hPfn1. (B) SCG10 staining of longitudinal sciatic nerve sections at 3 days postinjury (PI); red dashed lines indicate the lesion epicenter, red arrowheads highlight regenerating axons. Scale bars: 200 μm. (C) SCG10 fluorescence versus distance to lesion epicenter. (D) Mean distance of GFP+ sciatic nerve axons regenerating distally to the lesion edge 3 days PI. Data represent mean ± SEM (n = 5–9 animals/condition). *P < 0.05 by 1-way ANOVA with Tukey’s post hoc test. (E) 3D surface–rendered reconstructions, (F) zoom-in of E, and (G) volume quantification of NMJs fluorescently labeled with α-bungarotoxin (BTX), 28 days PI. Scale bars: 50 μm (E) and 10 μm (F). (H) Motor nerve conduction velocity, 28 days PI. In G and H, data represent mean ± SEM (n = 4–8 animals/condition). *P < 0.05 by Student’s t test. NS, not significant. (I) von Frey hair test, 21 and 28 days PI. Data represent mean ± SEM (n = 5–10 animals/condition). **P < 0.01; NS, not significant related to AAV-GFP uninjured condition. ##P < 0.01, ####P < 0.0001 refers to AAV-GFP versus AAV-GFP.P2A.S138A hPfn1 animals; both by 2-way ANOVA with Sidak’s post hoc test. (J) Strategy to assess CNS regeneration following delivery of AAV-GFP and AAV-GFP.P2A.S138A hPfn1. (K) Injured spinal cords 6 weeks following transection. Scale bars: 100 μm. Red dashed line, lesion border; arrowheads, GFP+ axons within the lesion core; r, rostral; c, caudal; d, dorsal; v, ventral. (L) Zoom-ins of K. Scale bars: 40 μm. (M) Number of GFP+ axons regenerating within the glial scar. (N) Distance (rostral to caudal) of regenerating axons and (O) percentage of GFP+ axons at different distance ranges from the injury border. Data represent mean ± SEM (n = 5–7 animals/condition). *P < 0.05 by Student’s t test. NS, not significant.

References

    1. Mar FM, Bonni A, Sousa MM. Cell intrinsic control of axon regeneration. EMBO Rep. 2014;15(3):254–263. doi: 10.1002/embr.201337723. - DOI - PMC - PubMed
    1. Nascimento AI, Mar FM, Sousa MM. The intriguing nature of dorsal root ganglion neurons: Linking structure with polarity and function. Prog Neurobiol. 2018;168:86–103. doi: 10.1016/j.pneurobio.2018.05.002. - DOI - PubMed
    1. Neumann S, Woolf CJ. Regeneration of dorsal column fibers into and beyond the lesion site following adult spinal cord injury. Neuron. 1999;23(1):83–91. doi: 10.1016/S0896-6273(00)80755-2. - DOI - PubMed
    1. Blanquie O, Bradke F. Cytoskeleton dynamics in axon regeneration. Curr Opin Neurobiol. 2018;51:60–69. doi: 10.1016/j.conb.2018.02.024. - DOI - PubMed
    1. Gomez TM, Letourneau PC. Actin dynamics in growth cone motility and navigation. J Neurochem. 2014;129(2):221–234. doi: 10.1111/jnc.12506. - DOI - PMC - PubMed

Publication types