. 2020 Apr 1;130(4):2081-2096.
doi: 10.1172/JCI131335.

Transcription factor c-Maf is a checkpoint that programs macrophages in lung cancer

Affiliations

Transcription factor c-Maf is a checkpoint that programs macrophages in lung cancer

Min Liu et al. J Clin Invest. .

Abstract

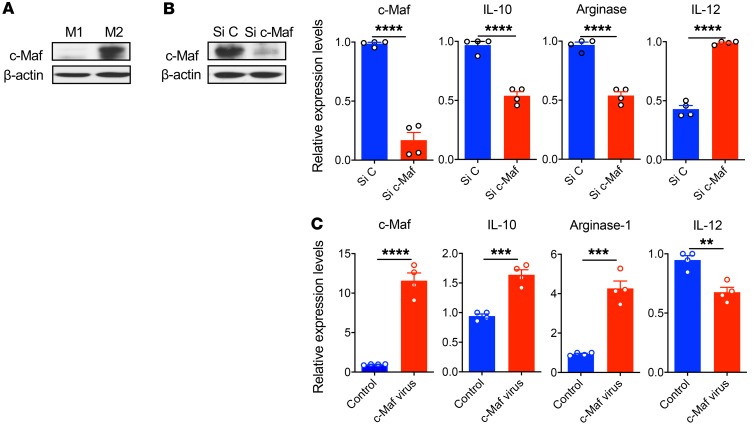
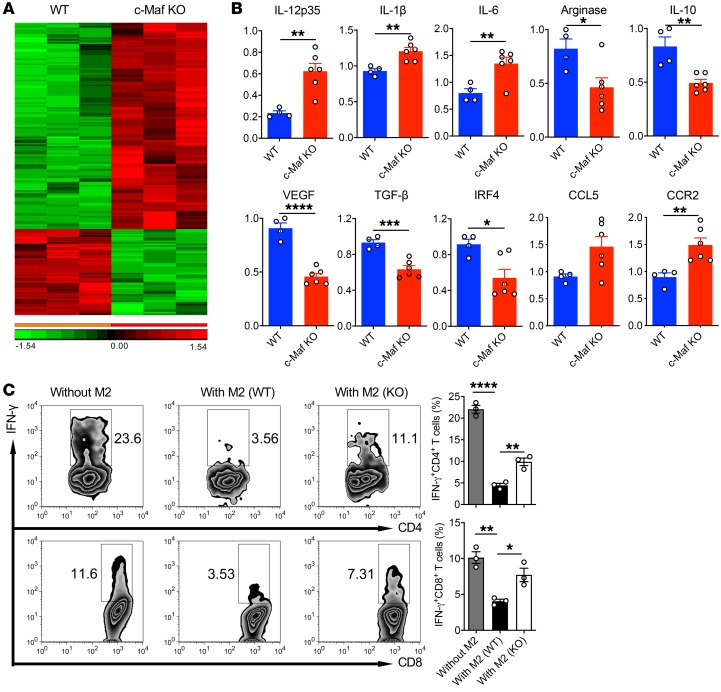
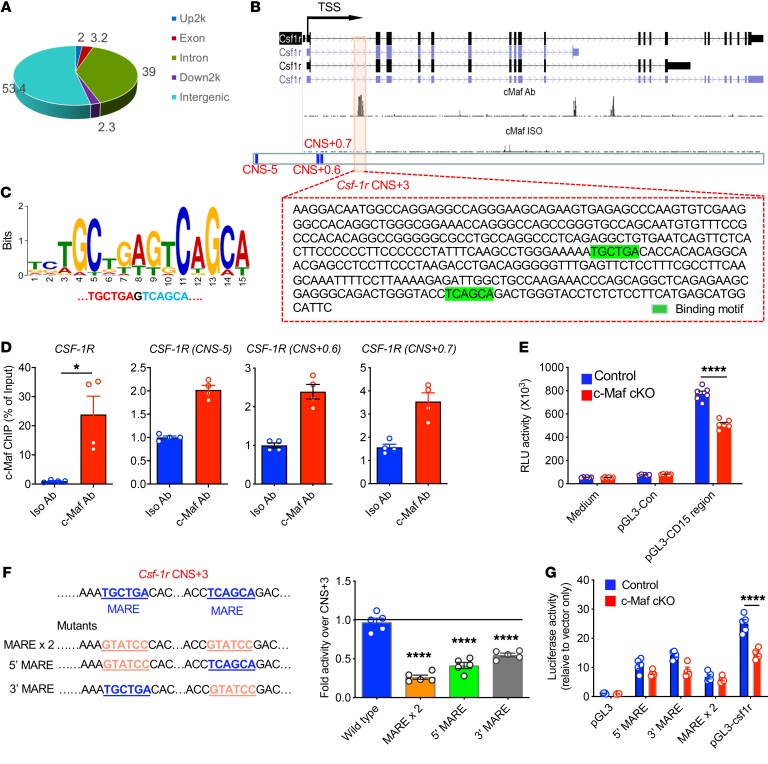
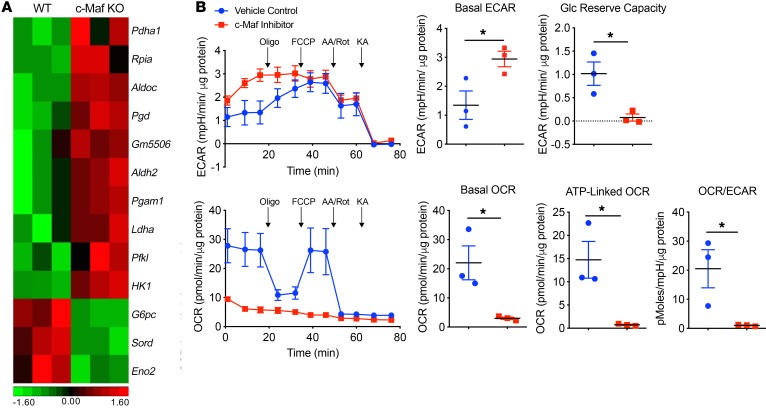
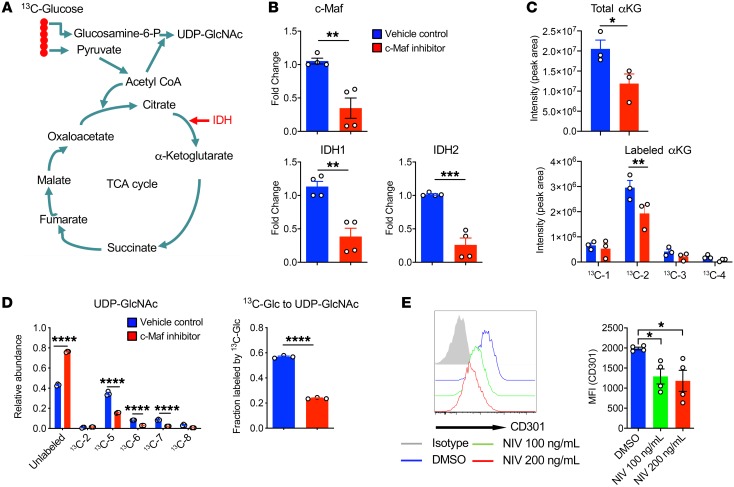
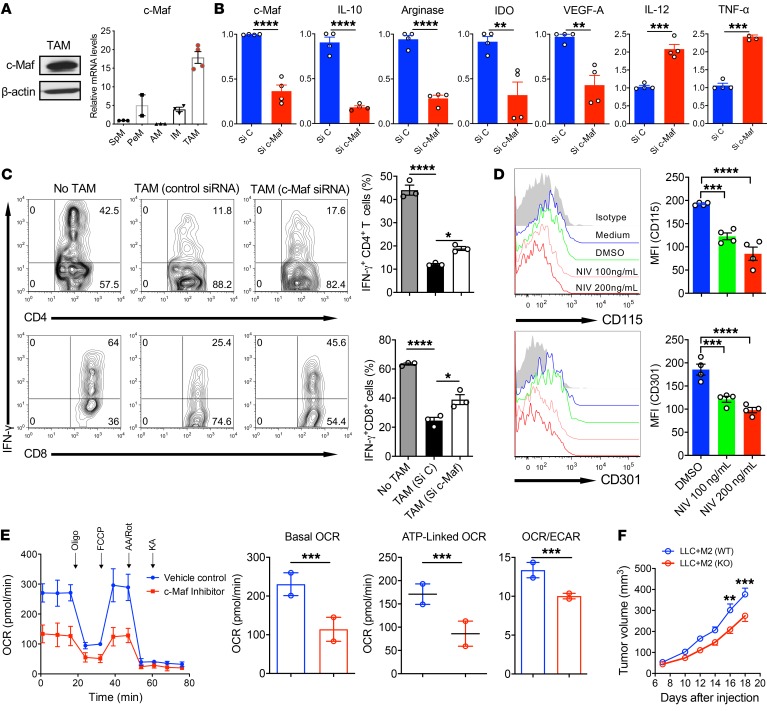
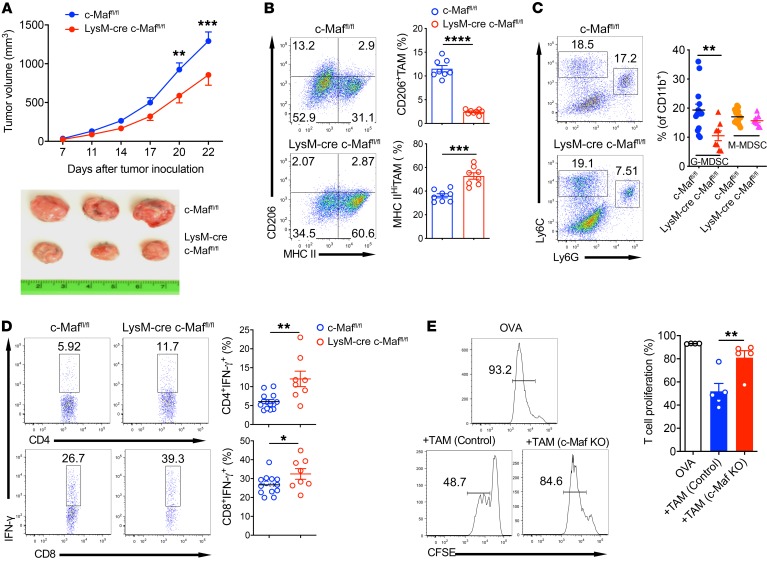
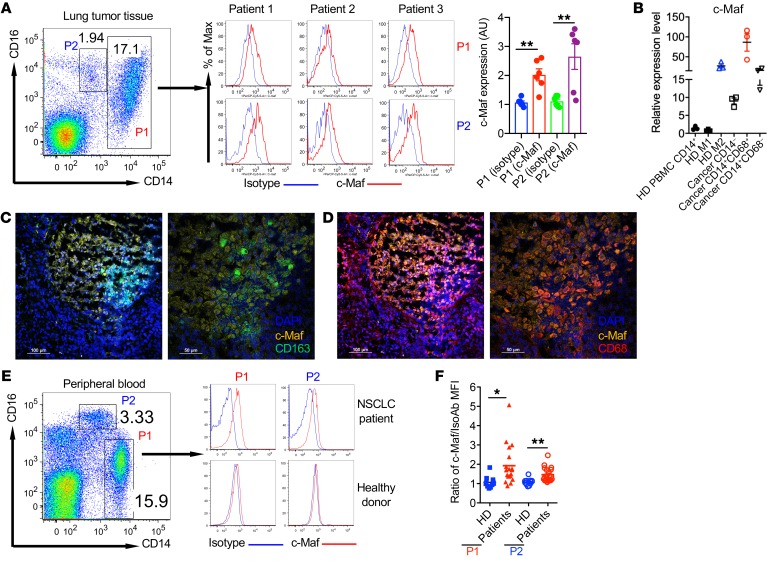
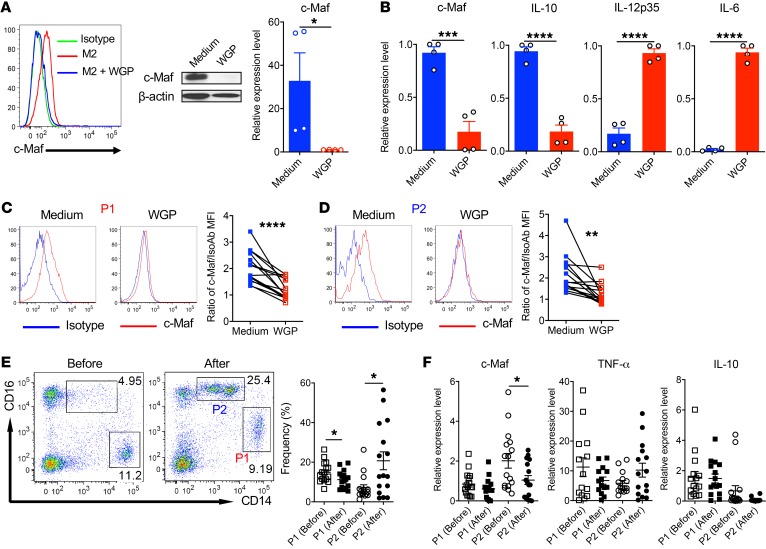
Macrophages have been linked to tumor initiation, progression, metastasis, and treatment resistance. However, the transcriptional regulation of macrophages driving the protumor function remains elusive. Here, we demonstrate that the transcription factor c-Maf is a critical controller for immunosuppressive macrophage polarization and function in cancer. c-Maf controls many M2-related genes and has direct binding sites within a conserved noncoding sequence of the Csf-1r gene and promotes M2-like macrophage-mediated T cell suppression and tumor progression. c-Maf also serves as a metabolic checkpoint regulating the TCA cycle and UDP-GlcNAc biosynthesis, thus promoting M2-like macrophage polarization and activation. Additionally, c-Maf is highly expressed in tumor-associated macrophages (TAMs) and regulates TAM immunosuppressive function. Deletion of c-Maf specifically in myeloid cells results in reduced tumor burden with enhanced antitumor T cell immunity. Inhibition of c-Maf partly overcomes resistance to anti-PD-1 therapy in a subcutaneous LLC tumor model. Similarly, c-Maf is expressed in human M2 and tumor-infiltrating macrophages/monocytes as well as circulating monocytes of human non-small cell lung carcinoma (NSCLC) patients and critically regulates their immunosuppressive activity. The natural compound β-glucan downregulates c-Maf expression on macrophages, leading to enhanced antitumor immunity in mice. These findings establish a paradigm for immunosuppressive macrophage polarization and transcriptional regulation by c-Maf and suggest that c-Maf is a potential target for effective tumor immunotherapy.

Keywords: Cancer; Immunology; Immunotherapy; Macrophages.


Conflict of interest statement

Conflict of interest: JY owns shares in Biothera.

Figures

Figure 1
Figure 1. c-Maf is predominantly expressed in M2 BMDMs.
(A) c-Maf expression in mouse M1 or M2 BMDMs assessed by WB. (B) M2 BMDMs were transfected with control (Si C) or c-Maf siRNA (Si c-Maf). c-Maf protein and mRNA expression was determined by WB and qPCR. The mRNA expression levels of Il10, Arg1, and Il12 were also determined by qPCR. (C) M1 BMDMs were infected with control or c-Maf lentivirus at a final concentration of 10 MOI. The mRNA expression levels of c-Maf, Il10, Arg1, and Il12 were determined by qPCR. Data are shown as mean ± SEM. The data are representative of at least 2 independent experiments with similar results. **P < 0.01; ***P < 0.001; ****P < 0.0001 by 2-tailed, unpaired t test.
Figure 2
Figure 2. c-Maf is an essential controller for M2 marker gene expression and function.
(A) RNA microarray analysis of polarized M2 BMDMs from c-Maf WT and KO chimeric mice (n = 3). Heatmap shows differentially expressed genes. (B) The mRNA expression levels of indicated genes were validated by qPCR analysis. *P < 0.05, **P < 0.01, ***P < 0.001, ****P < 0.0001 by 2-tailed, unpaired t test. (C) Polarized M2 BMDMs from WT or c-Maf–KO chimeric mice were cocultured with splenocytes from OT-1 or OT-II mice in the presence of OVA. IFN-γ–producing T cells were analyzed. Representative dot plots and summarized data are shown. Data are shown as mean ± SEM. *P < 0.05; **P < 0.01; ****P < 0.0001 by 1-way ANOVA with post hoc t test and Bonferroni’s correction.
Figure 3
Figure 3. c-Maf binds a Csf-1r conserved noncoding region and controls its expression in M2 BMDMs.
(A) In vitro–polarized M2 BMDMs were used for ChIP-seq study. The genomic distribution (%) of the identified c-Maf binding sites is shown in a pie chart. Up2k, 2000-bp sequence upstream of the Csf-1r locus; Down2k, 2000-bp sequence downstream of the Csf-1r locus. (B) Quantitative correlation of c-Maf at the Csf-1r locus. Motif analysis indicates that c-Maf has 2 binding sites (highlighted in green) in the Csf-1r conserved noncoding sequence (CNS + 3). (C) De novo–derived c-Maf chromatin binding motif. (D) Chromatin from M2 BMDMs precipitated with c-Maf Ab or isotype control Ab was analyzed by ChIP-qPCR for Csf-1r CNS + 3. Primers for Csf-1r nonbinding regions CNS-5, CNS + 0.6, and CNS + 0.7 were used as negative controls. Percentage of input was calculated using corresponding input as baseline. Data are shown as mean ± SEM. *P < 0.05 by 2-tailed, unpaired t test. (E) Luciferase reporter assay of promoter activity for Csf-1r CNS + 3 in M2 BMDMs from c-Maf control and cKO mice (n = 6). ****P < 0.0001 by 2-way ANOVA with Sidak’s multiple-comparisons test. (F) Luciferase reporter assay of promoter activity for Csf-1r CNS + 3 and mutated MAREs in M2 BMDMs. Mutations in sequences are underlined. ****P < 0.0001 by 1-way ANOVA with Dunnett’s multiple-comparisons test. (G) Luciferase reporter assay of promoter activity for Csf-1r CNS + 3 and mutated MAREs in M2 BMDMs from c-Maf control (n = 5) and cKO mice (n = 4). ****P < 0.0001 by 2-way ANOVA with Sidak’s multiple-comparisons test.
Figure 4
Figure 4. Inhibition of c-Maf promotes glycolysis pathway in M2 BMDMs.
(A) Heatmap of glycolysis-related gene expression in the M2 BMDMs from c-Maf WT and KO chimeric mice (n = 3). (B) M2 BMDMs were treated with c-Maf inhibitor (100 ng/mL) or vehicle control for 24 hours and then collected and seeded in a Seahorse XF24 analyzer. Real-time ECAR and OCR were determined during sequential treatments with oligomycin (oligo), FCCP, antimycin A and rotenone (AA/Rot), and koningic acid (KA). Basal levels of ECAR and OCR were measured and the OCR/ECAR ratios are shown. Glycolytic reserve capacity and the ATP-linked OCR were calculated. Each symbol represents 1 independent experiment with 5 wells per group in each experiment. Data are shown as mean ± SEM. *P < 0.05 by 2-tailed, unpaired t test. mpH, milli-pH units.
Figure 5
Figure 5. Inhibition of c-Maf in M2 BMDMs partially interrupts TCA cycle and UDP-GlcNAc activity.
(A) Schema of TCA cycle and UDP-GlcNAc pathway. (B) M2 BMDMs were treated with c-Maf inhibitor or vehicle control and the mRNA levels of c-Maf, IDH1, and IDH2 are shown. **P < 0.01, ***P < 0.001 by 2-tailed, unpaired t test. (C) M2 BMDMs (n = 3) treated with vehicle or c-Maf inhibitor were labeled with 13C-labeled glucose for 24 hours. Cell extracts were analyzed by mass spectrometry. The data show that the abundance of total αKG and carbon labeling is reduced in M2 BMDMs treated with c-Maf inhibitor. *P < 0.05 by 2-tailed, unpaired t test (top); **P < 0.01 by 2-way ANOVA with Sidak’s multiple-comparisons test (bottom). (D) Inhibition of c-Maf significantly decreases UDP-GlcNAc labeling from 13C-glucose. ****P < 0.0001 by 2-way ANOVA with Sidak’s multiple-comparisons test (left) or by 2-tailed, unpaired t test (right). (E) CD301 expression on M2 BMDMs treated with vehicle or the c-Maf inhibitor Nivalenol (NIV) for 24 hours determined by flow cytometry. MFI, mean fluorescence intensity. Data are shown as mean ± SEM. *P < 0.05 by 1-way ANOVA with Dunnett’s multiple-comparisons test.
Figure 6
Figure 6. c-Maf is highly expressed in TAMs and knockdown or deficiency of c-Maf reduces TAM immunosuppressive function and tumor-promoting activity.
(A) c-Maf expression in TAMs was determined by WB (left). Macrophages from different tissues of naive mice and TAMs were assayed for c-Maf mRNA expression by qPCR analysis (right). SpM, Splenic macrophages; PeM, Peritoneal macrophages; AM, alveolar macrophages; IM, Interstitial macrophages. (B) TAMs transfected with c-Maf siRNA (Si c-Maf) or control siRNA (Si C) were assayed for the specific gene mRNA expression. **P < 0.01, ***P < 0.001, ****P < 0.0001 by 2-tailed, unpaired t test. (C) c-Maf– or control siRNA–transfected TAMs were cocultured with splenocytes from OVA-Tg OT-I or OT-II mice in the presence of OVA. IFN-γ–producing T cells were analyzed. Cells were gated on CD4+ or CD8+ cells. Representative dot plots and summarized data are shown (n = 3). *P < 0.05; ****P < 0.0001 by 1-way ANOVA with post hoc t test and Bonferroni’s correction. (D) TAMs were treated with the c-Maf inhibitor Nivalenol (NIV) or vehicle control for 24 hours and the expression of CD115 and CD301 was determined by flow cytometry. Representative histograms and summarized data are shown. ***P < 0.001; ****P < 0.0001 by 1-way ANOVA with Dunnett’s multiple-comparisons test. (E) TAMs were treated with c-Maf inhibitor (100 ng/mL) or vehicle control for 24 hours and then collected and seeded in a Seahorse XF24 analyzer. Real-time OCR, basal and ATP-linked OCR, as well as the OCR/ECAR ratio were determined as described above. Each symbol represents 1 independent experiment with 5 replicates per group in each experiment. Data shown are combined from 2 independent experiments. ***P < 0.001 by 2-tailed, unpaired t test. (F) LLC cells mixed with M2 BMDMs from WT or c-Maf–KO chimeric mice in Matrigel were injected into mice (n = 8) and tumor progression was monitored. **P < 0.01, ***P < 0.001 by 2-way repeated-measures ANOVA with Sidak’s multiple-comparisons test.
Figure 7
Figure 7. Deletion of c-Maf in myeloid cells suppresses tumor growth with enhanced antitumor T cell responses.
(A) c-Maffl/fl control (n = 14) and LysM-cre c-Maffl/fl mice (n = 8) were inoculated with LLC cells s.c., and tumor growth was monitored (upper). Representative tumor pictures are shown (lower). **P < 0.01, ***P < 0.001 by 2-way repeated-measures ANOVA with Sidak’s multiple-comparisons test. (B) TAMs were stained for CD206 and MHC II expression. Cells were gated on CD11b+Gr-1F4/80+ viable cells. Representative dot plots and summarized percentages of cells are shown. (C) Representative MDSC populations by flow cytometry and summarized frequencies are shown. Cells were gated on CD11b+ viable cells. (D) Single-cell suspensions from tumors were stimulated with PMA plus ionomycin and intracellular IFN-γ staining was performed. Representative dot plots and summarized data are shown. Cells were gated on CD4+ or CD8+ T cells. (E) TAMs from control and c-Maf–KO mice were cocultured with CFSE-labeled splenocytes from OVA-Tg OT-I mice in the presence of OVA. T cell proliferation was analyzed. Cells were gated on CD8+ cells. Representative histograms and percentage of proliferated cells are shown. Data are shown as mean ± SEM. *P < 0.05; **P < 0.01; ***P < 0.001; ****P < 0.0001 by 2-tailed, unpaired t test (BD); **P < 0.01 by 1-way ANOVA with post hoc t test and Bonferroni’s correction (E).
Figure 8
Figure 8. c-Maf is expressed in tumor-infiltrating monocytes/macrophages and circulating monocytes of NSCLC patients.
(A) c-Maf expression in human NSCLC monocytes/macrophages. Single-cell suspensions from lung tumor tissues of NSCLC patients (n = 6) were stained for CD45, CD3, CD19, CD14, CD16, and c-Maf. Histograms from 3 patients are shown. Cells were gated on CD45+CD19CD3CD14hiCD16+/lo (P1) or CD45+CD19CD3CD14dimCD16+ (P2). c-Maf expression is shown as arbitrary units (AU), calculated using MFI from 1 patient sample stained with isotype control as the denominator. **P < 0.01 by 2-tailed, unpaired t test. (B) CD14+ cells were sorted from healthy donor peripheral blood and CD14+CD68+, CD14+CD68, or CD14CD45+ cells were sorted from human NSCLC tissues. The c-Maf mRNA expression levels were measured by qPCR analysis. (C and D) Immunofluorescent staining of cryostat slides from NSCLC with anti-CD163 (C) or anti-CD68 (D), c-Maf, and DAPI. (E and F) c-Maf expression in peripheral blood monocytes from NSCLC patients (n = 16) and healthy donors (n = 11). Representative histograms (E) and summarized data (F) are shown. HD, healthy donors. Data are shown as mean ± SEM. *P < 0.05, **P < 0.01 by 2-tailed, unpaired t test.
Figure 9
Figure 9. WGP treatment downregulates c-Maf expression in human M2-like macrophages and circulating monocytes from NSCLC patients.
(A) Polarized human M2-like macrophages from heathy donor monocytes were treated with yeast whole β-glucan particles (WGP, 150 μg/mL) for 24 hours and c-Maf expression was determined by flow cytometry and WB analysis. The c-Maf mRNA expression levels in polarized M2-like macrophages (n = 4 donors) treated with WGP for 24 hours were also determined by qPCR analysis. *P < 0.05 by 2-tailed, unpaired t test. (B) Polarized human M2-like macrophages were treated with WGP (150 μg/mL) for 24 hours and the mRNA expression levels of indicated genes were determined by qPCR analysis. *P < 0.05, ***P < 0.001, ****P < 0.0001 by 2-tailed, unpaired t test. (C and D) PBMCs from NSCLC patients (n = 15) were treated with WGP in vitro for 24 hours. Representative histogram of c-Maf expression and summarized data for both CD14hiCD16+/lo (P1, C) and CD14dimCD16+ (P2, D) populations are shown. **P < 0.01; ****P < 0.0001 by 2-tailed, paired t test. IsoAb, isotype antibody. (E) PBMCs from NSCLC patients (n = 16) before or after oral WGP administration were stained for CD14 and CD16. Representative dot plots and summarized frequencies of CD14hiCD16+/lo (P1) and CD14dimCD16+ (P2) populations are shown. *P < 0.05 by 2-tailed, paired t test. (F) CD14hiCD16+/lo (P1) and CD14dimCD16+ (P2) populations from PBMCs of NSCLC patients treated before and after WGP were sorted. The mRNA expression levels of c-MAF, TNFA, and IL10 were determined by qPCR analysis. Data are shown as mean ± SEM. *P < 0.05 by 2-tailed, paired t test.

Comment in

References

    1. Bray F, Ferlay J, Soerjomataram I, Siegel RL, Torre LA, Jemal A. Global cancer statistics 2018: GLOBOCAN estimates of incidence and mortality worldwide for 36 cancers in 185 countries. CA Cancer J Clin. 2018;68(6):394–424. doi: 10.3322/caac.21492. - DOI - PubMed
    1. Garon EB, et al. Pembrolizumab for the treatment of non-small-cell lung cancer. N Engl J Med. 2015;372(21):2018–2028. doi: 10.1056/NEJMoa1501824. - DOI - PubMed
    1. Gettinger SN, et al. Overall survival and long-term safety of Nivolumab (anti-programmed death 1 antibody, BMS-936558, ONO-4538) in patients with previously treated advanced non-small-cell lung cancer. J Clin Oncol. 2015;33(18):2004–2012. doi: 10.1200/JCO.2014.58.3708. - DOI - PMC - PubMed
    1. Rizvi NA, et al. Cancer immunology. Mutational landscape determines sensitivity to PD-1 blockade in non-small cell lung cancer. Science. 2015;348(6230):124–128. doi: 10.1126/science.aaa1348. - DOI - PMC - PubMed
    1. Neubert NJ, et al. T cell-induced CSF1 promotes melanoma resistance to PD1 blockade. Sci Transl Med. 2018;10(436):eaan3311. doi: 10.1126/scitranslmed.aan3311. - DOI - PMC - PubMed

Publication types

MeSH terms

Substances