Comparative Study
. 2020 Jan 16;15(1):e0227434.
doi: 10.1371/journal.pone.0227434. eCollection 2020.

Comparing bioinformatic pipelines for microbial 16S rRNA amplicon sequencing

Affiliations
Comparative Study

Comparing bioinformatic pipelines for microbial 16S rRNA amplicon sequencing

Andrei Prodan et al. PLoS One. .

Abstract

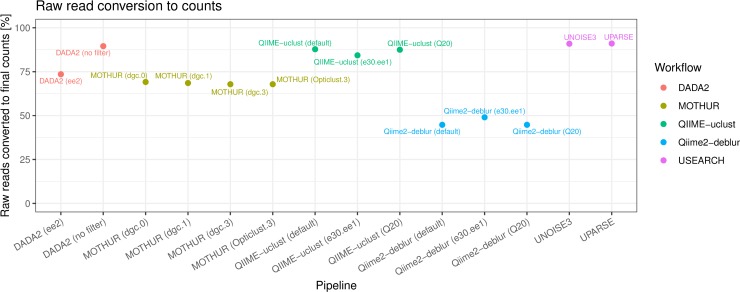
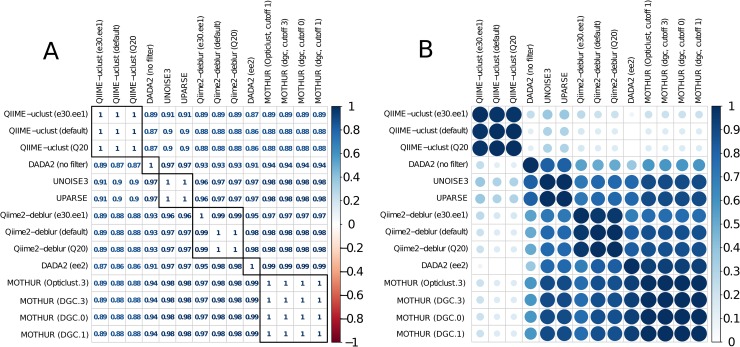
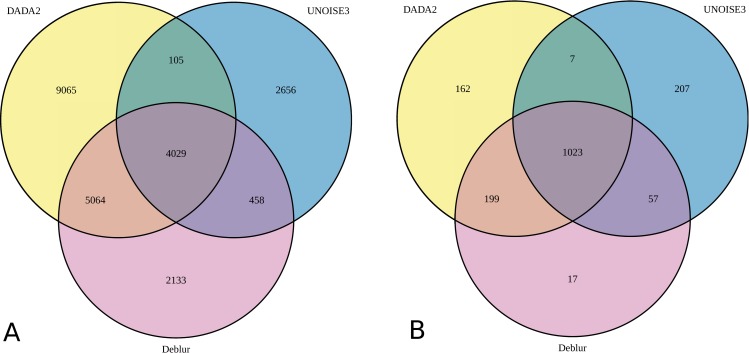
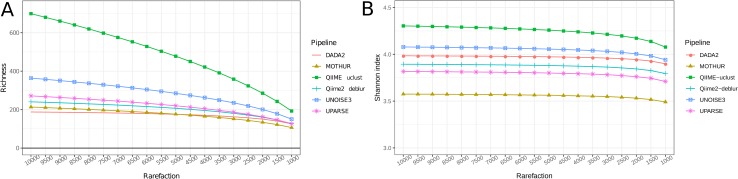
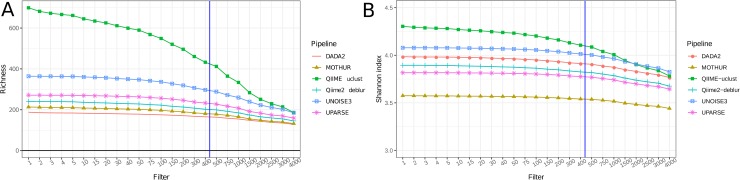
Microbial amplicon sequencing studies are an important tool in biological and biomedical research. Widespread 16S rRNA gene microbial surveys have shed light on the structure of many ecosystems inhabited by bacteria, including the human body. However, specialized software and algorithms are needed to convert raw sequencing data into biologically meaningful information (i.e. tables of bacterial counts). While different bioinformatic pipelines are available in a rapidly changing and improving field, users are often unaware of limitations and biases associated with individual pipelines and there is a lack of agreement regarding best practices. Here, we compared six bioinformatic pipelines for the analysis of amplicon sequence data: three OTU-level flows (QIIME-uclust, MOTHUR, and USEARCH-UPARSE) and three ASV-level (DADA2, Qiime2-Deblur, and USEARCH-UNOISE3). We tested workflows with different quality control options, clustering algorithms, and cutoff parameters on a mock community as well as on a large (N = 2170) recently published fecal sample dataset from the multi-ethnic HELIUS study. We assessed the sensitivity, specificity, and degree of consensus of the different outputs. DADA2 offered the best sensitivity, at the expense of decreased specificity compared to USEARCH-UNOISE3 and Qiime2-Deblur. USEARCH-UNOISE3 showed the best balance between resolution and specificity. OTU-level USEARCH-UPARSE and MOTHUR performed well, but with lower specificity than ASV-level pipelines. QIIME-uclust produced large number of spurious OTUs as well as inflated alpha-diversity measures and should be avoided in future studies. This study provides guidance for researchers using amplicon sequencing to gain biological insights.


Conflict of interest statement

E.L is employed by Horaizon BV. Horaizon BV did not play any role in the study design, data collection and analysis, decision to publish, or preparation of the manuscript and only provided financial support in the form of authors' salaries.This does not alter our adherence to PLOS ONE policies on sharing data and materials.

Figures

Fig 1
Fig 1. Effect of different USEARCH paired-end read merging parameters (“maxdiffs”).
Fig 2
Fig 2. Hamming distance (no. of base differences) from each ASV/OTU sequence to the closest true sequence present in the mock community.
Fig 3
Fig 3. Hamming distance from each ASV/OTU sequence to the closest other ASV/OTU sequence.
Dashed line marks the Hamming distance = 7 threshold, corresponding to the 97% identity threshold for OTUs in V4 16S rRNA gene amplicons. Blue ellipses highlight ASVs that are only 1 Hamming distance away from each other.
Fig 4
Fig 4. Inferred mock community composition.
A) Comparison of QIIME-uclust vs. other pipelines. B) Comparison of DADA (no filter) vs. DADA2 (ee2). OTUs/ASVs whose abundance was under-estimated are indicated with arrows.
Fig 5
Fig 5. Raw reads conversion to final counts.
Fig 6
Fig 6. Spearman's rho correlation averaged across all samples of the HELIUS fecal sample dataset (N = 2170).
A) Actual values. B) Values scaled to range between 0 and 1. Hierarchical clustering was applied to both rows and columns in order to group pipelines based on the degree of correlation of their outputs.
Fig 7
Fig 7. Venn diagram showing the overlap between the ASVs produced by three denoising pipelines from the HELIUS fecal sample data (N = 2170).
Workflows shown are DADA2 (no filter), Qiime2-Deblur (e30.ee1), and USEARCH-UNOISE3. A) ASVs remaining after rarefaction to 10 000 counts. B) Filtered ASVs (mean relative abundance of at least 0.002% of rarefied counts).
Fig 8
Fig 8. Alpha-diversity measures at different rarefaction levels.
Values shown are averages across all samples in the HELIUS fecal sample dataset. A) Sample richness (no. of OTUs/ASVs per individual sample). B) Shannon index. Only one workflow from each pipeline is shown: DADA2 (no filter), QIIME-uclust (e30.ee1), Qiime2-Deblur (e30.ee1) and MOTHUR (DGC.1).
Fig 9
Fig 9. Alpha-diversity measures after downstream filtering of very low-abundance OTUs/ASVs.
X-axis shows the no. of counts that an OTU/ASV must reach (in the entire dataset) in order to be retained. All OTU/ASV tables rarefied to 10000 counts / sample prior to filtering. Values shown are averaged across all samples in the HELIUS fecal sample dataset. A) Sample richness. B) Shannon index. The blue vertical bar marks the filter threshold corresponding to 0.002% of rarefied counts.

References

    1. Baird DJ, HajibabeiI M. Biomonitoring 2.0: a new paradigm in ecosystem assessment made possible by next-generation DNA sequencing. Mol Ecol. 2012;21:2039–2044. 10.1111/j.1365-294x.2012.05519.x - DOI - PubMed
    1. Lynch S V., Pedersen O. The Human Intestinal Microbiome in Health and Disease. Phimister EG, editor. N Engl J Med. 2016;375:2369–2379. 10.1056/NEJMra1600266 - DOI - PubMed
    1. van Dijk EL, Jaszczyszyn Y, Naquin D, Thermes C. The Third Revolution in Sequencing Technology. Trends Genet. 2018;34:666–681. 10.1016/j.tig.2018.05.008 - DOI - PubMed
    1. Schloss PD, Westcott SL, Ryabin T, Hall JR, Hartmann M, Hollister EB, et al. Introducing mothur: open-source, platform-independent, community-supported software for describing and comparing microbial communities. Appl Environ Microbiol. 2009;75:7537–41. 10.1128/AEM.01541-09 - DOI - PMC - PubMed
    1. Edgar RC. Search and clustering orders of magnitude faster than BLAST. Bioinformatics. 2010;26:2460–2461. 10.1093/bioinformatics/btq461 - DOI - PubMed

Publication types