. 2020 Jan 16;15(1):e0228028.
doi: 10.1371/journal.pone.0228028. eCollection 2020.

Cytoplasmic factories, virus assembly, and DNA replication kinetics collectively constrain the formation of poxvirus recombinants

Affiliations

Cytoplasmic factories, virus assembly, and DNA replication kinetics collectively constrain the formation of poxvirus recombinants

Quinten Kieser et al. PLoS One. .

Abstract

Poxviruses replicate in cytoplasmic structures called factories and each factory begins as a single infecting particle. Sixty-years ago Cairns predicted that this might have effects on vaccinia virus (VACV) recombination because the factories would have to collide and mix their contents to permit recombination. We've since shown that factories collide irregularly and that even then the viroplasm mixes poorly. We've also observed that while intragenic recombination occurs frequently early in infection, intergenic recombination is less efficient and happens late in infection. Something inhibits factory fusion and viroplasm mixing but what is unclear. To study this, we've used optical and electron microscopy to track factory movement in co-infected cells and correlate these observations with virus development and recombinant formation. While the technical complexity of the experiments limited the number of cells that are amenable to extensive statistical analysis, these studies do show that intergenic recombination coincides with virion assembly and when VACV replication has declined to ≤10% of earlier levels. Along the boundaries between colliding factories, one sees ER membrane remnants and other cell constituents like mitochondria. These collisions don't always cause factory fusion, but when factories do fuse, they still entrain cell constituents like mitochondria and ER-wrapped microtubules. However, these materials wouldn't seem to pose much of a further barrier to DNA mixing and so it's likely that the viroplasm also presents an omnipresent impediment to DNA mixing. Late packaging reactions might help to disrupt the viroplasm, but packaging would sequester the DNA just as the replication and recombination machinery goes into decline and further reduce recombinant yields. Many factors thus appear to conspire to limit recombination between co-infecting poxviruses.


Conflict of interest statement

The authors have declared that no competing interests exist.

Figures
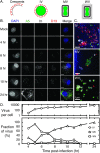
Fig 1
Fig 1. Timing of virus development.
BSC40 cells were infected with VACV-A5-YFP at a MOI = 5, fixed at the indicated times, and stained with DAPI and antibodies to D13 and B5. (A) Schematic showing the different developmental forms of VACV. Virus assembly begins with formation of viral crescents that eventually form IV. During maturation, the scaffold that gives shape to both crescents and IV is cleaved and the brick-shaped MV is formed. A fraction of MV migrate towards the trans-Golgi network where they obtain additional membranes (white) and incorporate other unique proteins. (B) Representative images showing the timing of the appearance of each viral form. The YFP-A5 tag detects all three types of virus (MV, IV, and WV), which can be further differentiated using antibodies that detect the D13 scaffolding protein (IV) and the outer envelope protein B5 (WV). Bar = 10μm. (C) An inset of selected regions imaged at 10 hr post-infection. The ring structures formed by D13 (red) and B5 (white) are seen associated with the A5 cores (green). MV tend to aggregate in clusters at later times in infection. Bar = 1μm. (D) Distribution of virus forms at different times post-infection and total numbers of virus particles analyzed. The figure shows data consolidated from 3 independent experiments and reports a number-weighted average of the distribution of morphogenic forms using a total of 10 cells per time point. We measured an average of 1100 virus/cell (range 9–3900 at 4 and 24 hr, respectively).
Fig 2
Fig 2. DNA replication through the VACV life cycle.
BSC40 cells were infected with VACV strain WR at a MOI = 5 and pulsed with EdU for 15 min prior to fixation at the indicated time points. The EdU was coupled to AlexaFluor 647 dye and the bulk DNA labelled with DAPI. (A) Fluorescence micrographs showing the sites of EdU incorporation throughout the viral life cycle. Nascent factories can be labelled brightly with EdU early in infection, the rate of incorporation declines with time as the factories mature and adopt a more diffuse appearance. Images represent a projection of all z-stacks. Bar = 10μm. (B) Quantification of EdU incorporation. The fluorescence from the AlexaFluor-tagged EdU was normalized relative to the amount of DNA detected using DAPI fluorescence. The figure shows data acquired from three replicate experiments, averaging all signals acquired from 13–19 cells per time point. The error bars show standard deviations.
Fig 3
Fig 3. DNA replication associated with inter-viral recombination.
BSC40-eGFP-cro cells were infected with VACV-pE/L-mCherry(t) and VACV-pmCherry-cro at a MOI = 2.5 for each virus. The cells were pulse-labelled for 35 min with EdU starting at 6 hr post-infection and fixed a few minutes after the last time point. The EdU was coupled to AlexaFluor 647 dye and the bulk DNA labelled with DAPI. These experiments were completed a total of three times and this figure highlights the results of a single experiment. (A) Still images acquired during the live-cell portion of the experiment. Traces of the recombinant mCherry-cro reporter protein were first seen at 5:20 hr post-infection, but only became obviously visible at 6 hr (arrow). (B) The cell that was tracked during the live-cell portion of the experiment was reimaged after processing to detect any incorporated EdU. Both EdU and recombinant mCherry-cro molecules seem to be distributed throughout the factories. Bar = 10 μm.
Fig 4
Fig 4. Arrangement of virus factories in a VACV-infected cell.
BSC40 cells were infected with VACV strain WR at a MOI = 5 and labelled for 15 min with EdU beginning at 5:45 post-infection. At 6 hr the cells were fixed and processed to detect the EdU label, bulk DNA (DAPI), and the ER marker calreticulin. The top row shows the infected cell at lower magnification and combines all of the z-stacks in a projected image. The bottom row shows a projection of 7x125 nm z-stacks, located in the approximate middle of the cell. In these more highly magnified images one sees calreticulin-labelled channels separating at least four EdU- and DAPI-labelled factories.
Fig 5
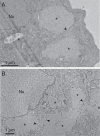
Fig 5. Structures surrounding the edges of virus factories.
BSC40 cells were infected with VACV at a MOI = 5 for 3.5 hr (A) or 4 hr (B) and processed for transmission electron microscopy (TEM). At 3.5 hr post-infection the viroplasm (*) presents a uniform pattern of staining and the factories are beginning to lose their once spherical appearance. Membranes, some double layered (arrows), and mitochondria are commonly seen along the edges of these factories. At 4 hr post-infection (B) some factories have migrated to a position adjacent to the nucleus (Nu) and membrane fragments are sometimes also seen surrounding and within the factory.
Fig 6
Fig 6. Correlative light and transmission electron microscopy (example 1).
(A) BSC40-eGFP-cro cells were infected with VACV at a MOI = 5 and the factory development tracked until a region of collision was identified, between two different factories (“1” and “2”, arrows). A projected image is shown. The cells were fixed and processed for TEM at 4:40 post-infection. (B) Image correlation. The last fluorescence image (left) is shown at the same magnification as an image obtained by TEM (centre). The light and electron micrographs could be well aligned using the different factories as fiduciary markers (right) although it is not possible to perfectly align the images due to slight differences in the optical and TEM image planes. (C) Magnified view of the region surrounding the point of collision between two factories. A variety of cell structures are seen still separating the two factories including membranous debris and many clusters of mitochondria. Also seen in these images are a few crescent structures and IV characteristic of this time point.
Fig 7
Fig 7. Correlative light and scanning electron microscopy (example 2).
BSC40-eGFP-cro cells were infected with VACV at a MOI = 5 and factory development tracked as described. After identifying a site of factory collision, the cells were fixed and processed for SEM. (A) Stills from the live-cell portion of the experiment. Each captures data compiled over 101 z-stacks. A collision between two factories is indicated (arrows) in the image captured at 4:35 post-infection. (B) CLEM analysis of the collision event showing the alignment of the optical and electron images (top row) and an enlargement of the region surrounding the two factories of interest (bottom row). The optical image comes from one z-stack still. By this point one sees little evidence of any contiguous structures separating the viroplasm from the cytoplasm in the SEM image, but remnants of cytoplasmic components are still seen in the space between the two factories. Virus crescents and IV are also beginning to appear.
Fig 8
Fig 8. Structure of a fused factory.
BSC40-eGFP-cro cells were infected with VACV, tracked, fixed, and processed for SEM as described (Figs 6 and 7). (A) The white arrows mark two factories that collided at 4:31 post infection and then fused to form an ovoid structure that persisted until the reaction was stopped and the cells processed soon after the 5:43 time point. Asterisks highlight two other factories that appeared to have escaped collisions (see text). (B) Three reconstructed 3D volumes showing how the two factories at upper right (white arrow) were oriented relative to each other at the time of collision (4:31). The image showing the XY plane presents the same orientation as the image of these factories in Panel A. (C) CLEM reconstructions showing an alignment of the optical and electron images at two different magnifications. A band of material bisects the factory in this 50 μm thick specimen, along a line roughly tangential to where the two faces collided. The slight misalignment between the optical and electron images in Panel C reflects difficulties perfectly matching the optical and serial sections.
Fig 9
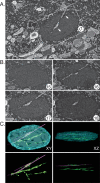
Fig 9. Three-dimensional model of a fused factory assembled from serial sections.
(A) SEM image showing the cell matrix surrounding one of the factories. This factory was produced by a single collision event that happened about 80 min before stopping and fixing the cells (Fig 8). This example shows one of 44 serial sections obtained from this cell. The arrows highlight places where doubled membranes, like ER, are visible (B) Four consecutive serial sections encompassing the middle of this factory. The band of material extends only partway from one 50 nm section to the next. Close inspection of section #16 shows that the membranous material tracks along a thin (~25 nm) filament resembling a microtubule. (C) Three-dimensional reconstruction showing the factory boundaries plus the enclosed structures. The boundary between the viroplasm and cytoplasm has been cyan coloured, the bands of infiltrating material are light green, and the 25 nm structures are marked in magenta. A view from the top (XY) and from a longer side (XZ) are displayed with and without the factory boundaries.
Fig 10
Fig 10. Factories entrain microtubules.
BSC40 cells were mock-infected (Panel A) or infected (Panel (B) with VACV at MOI = 1 and then fixed and processed for imaging at 6 hr post-infection. The projections encompass only the image planes spanning the viroplasm. Panel C provides a 3D reconstruction of the region surrounding the virus factory shown in panel B, plus two images produced by consecutive 45˚ rotations of the model around the x-axis. At least two threads of microtubules appear to pass through the body of the factory. To preserve and detect the microtubule structures the cells were fixed at 37˚ in 4% PFA and 0.2% glutaraldehyde, treated with 0.2% sodium borohydride for 10 min and then stained with a mouse anti-tubulin primary antibody plus goat-anti-mouse secondary antibody. Bar = 15 μm.
Fig 11
Fig 11. Other entrained structures.
(A) A magnified view of the live-cell image in Fig 8A showing a partial collision between two factories (yellow arrows). (B) Four consecutive serial sections through the factory fixed shortly after the 5:46 hr time point. (C) A three-dimensional reconstruction extending through the entirety of the lower factory and up to the boundary with upper one. The boundaries between the viroplasm and cytoplasm have been cyan coloured, the mitochondria yellow, the bands of infiltrating material light green, and the 25 nm structures are marked in magenta. A view from the top (XY) and from a longer side (XZ) are displayed along with a projection along an intermediate rotation axis.

References

    1. Yang Z, Cao S, Martens CA, Porcella SF, Xie Z, Ma M, et al. Deciphering poxvirus gene expression by RNA sequencing and ribosome profiling. J Virol. 2015;89(13):6874–86. 10.1128/JVI.00528-15 - DOI - PMC - PubMed
    1. Yang Z, Reynolds SE, Martens CA, Bruno DP, Porcella SF, Moss B. Expression profiling of the intermediate and late stages of poxvirus replication. J Virol. 2011;85(19):9899–908. 10.1128/JVI.05446-11 - DOI - PMC - PubMed
    1. Teale A, Campbell S, Van Buuren N, Magee WC, Watmough K, Couturier B, et al. Orthopoxviruses require a functional ubiquitin-proteasome system for productive replication. J Virol. 2009;83(5):2099–108. 10.1128/JVI.01753-08 - DOI - PMC - PubMed
    1. Mercer J, Snijder B, Sacher R, Burkard C, Bleck CK, Stahlberg H, et al. RNAi screening reveals proteasome- and Cullin3-dependent stages in vaccinia virus infection. Cell Rep. 2012;2(4):1036–47. 10.1016/j.celrep.2012.09.003 - DOI - PubMed
    1. Liu B, Panda D, Mendez-Rios JD, Ganesan S, Wyatt LS, Moss B. Identification of Poxvirus Genome Uncoating and DNA Replication Factors with Mutually Redundant Roles. J Virol. 2018;92(7). - PMC - PubMed

Publication types

Grants and funding