. 2020 Jan 14;9(1):209.
doi: 10.3390/cells9010209.

Methylglyoxal-Dependent Glycative Stress and Deregulation of SIRT1 Functional Network in the Ovary of PCOS Mice

Affiliations

Methylglyoxal-Dependent Glycative Stress and Deregulation of SIRT1 Functional Network in the Ovary of PCOS Mice

Giovanna Di Emidio et al. Cells. .

Abstract

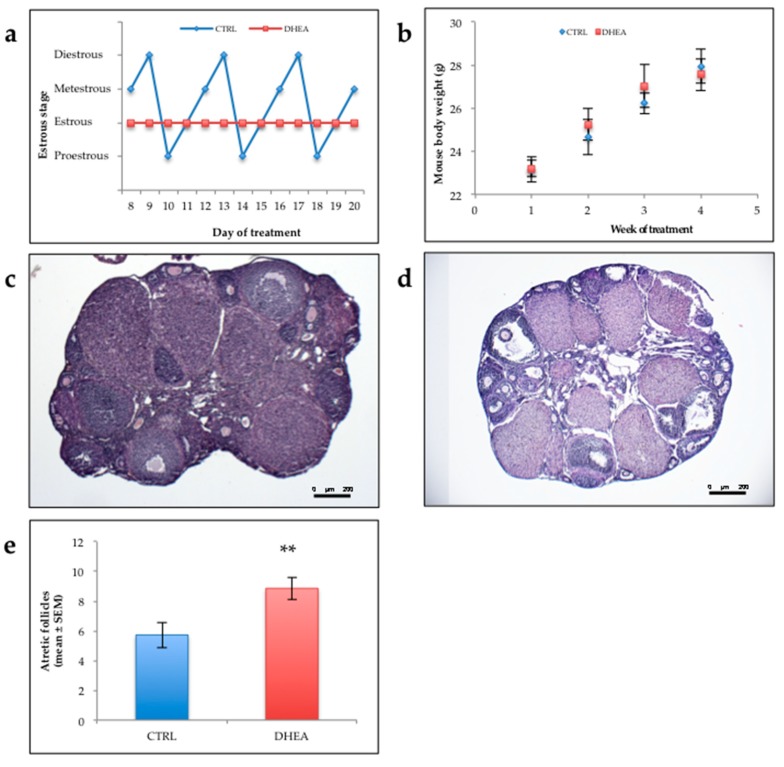
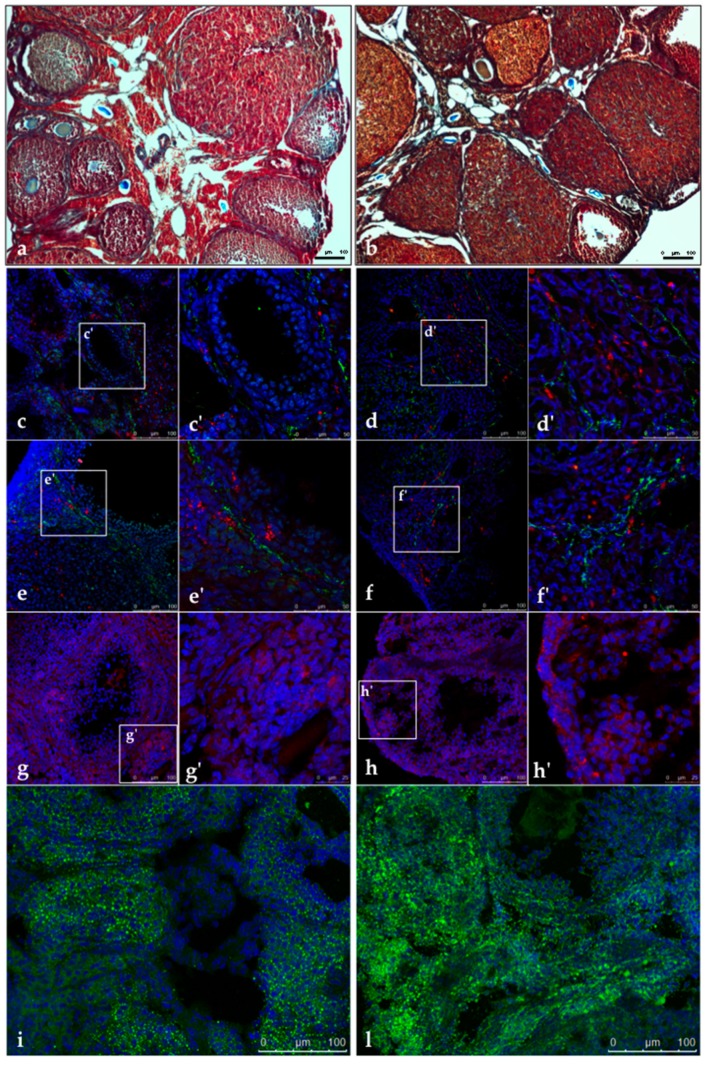
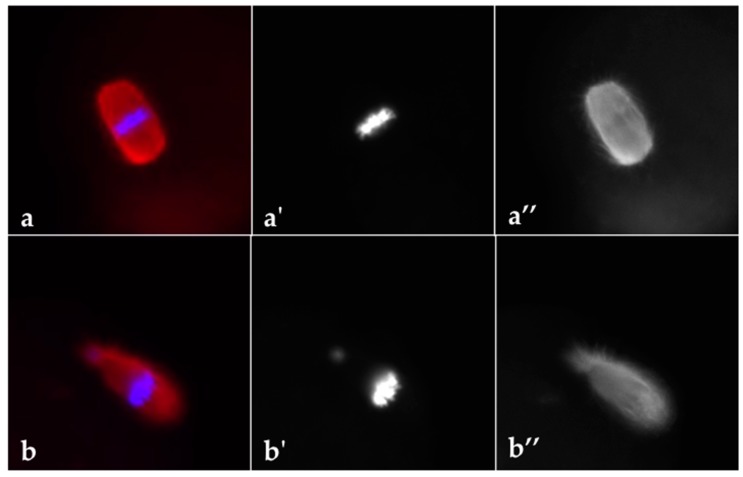
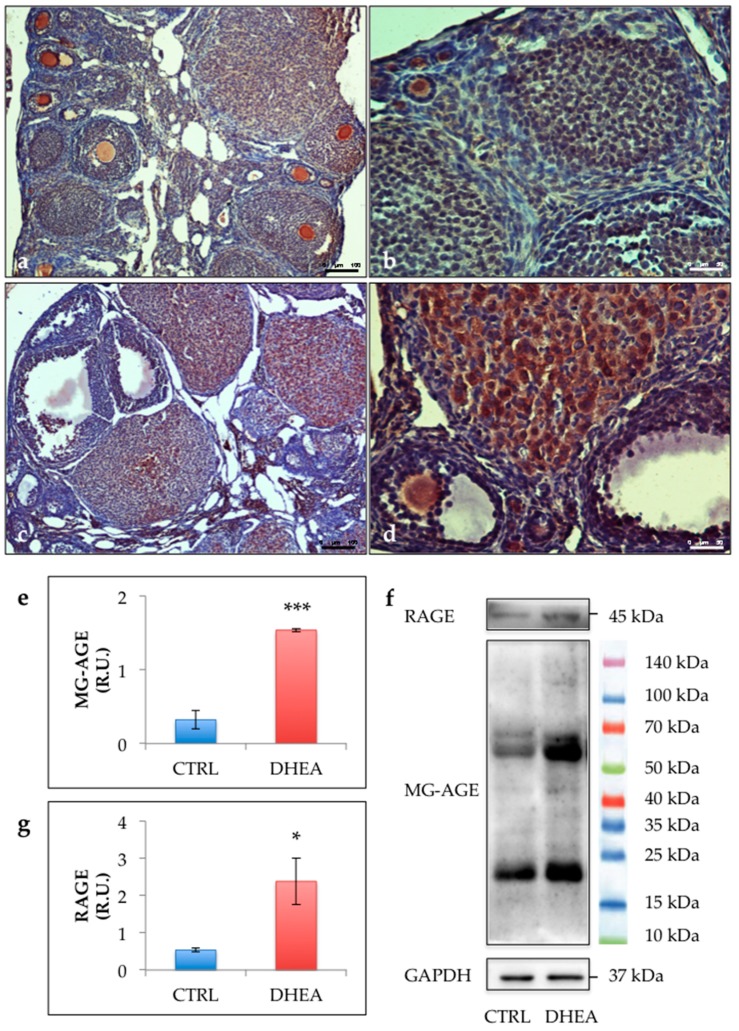
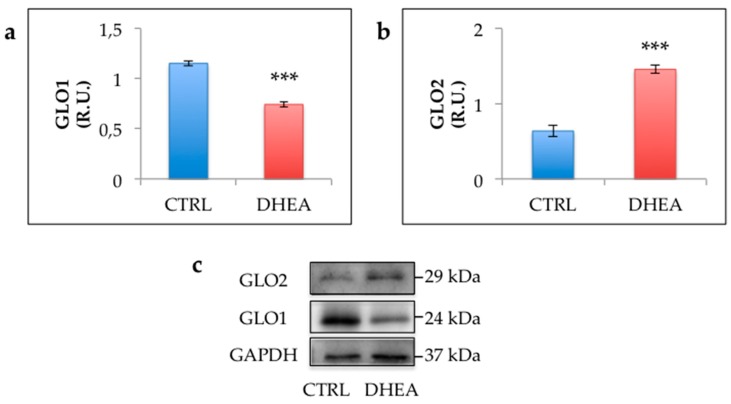
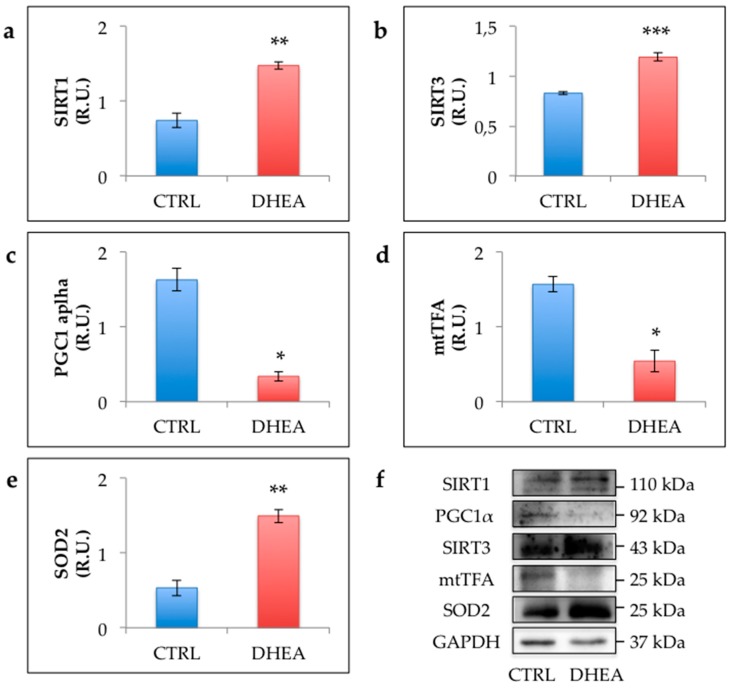
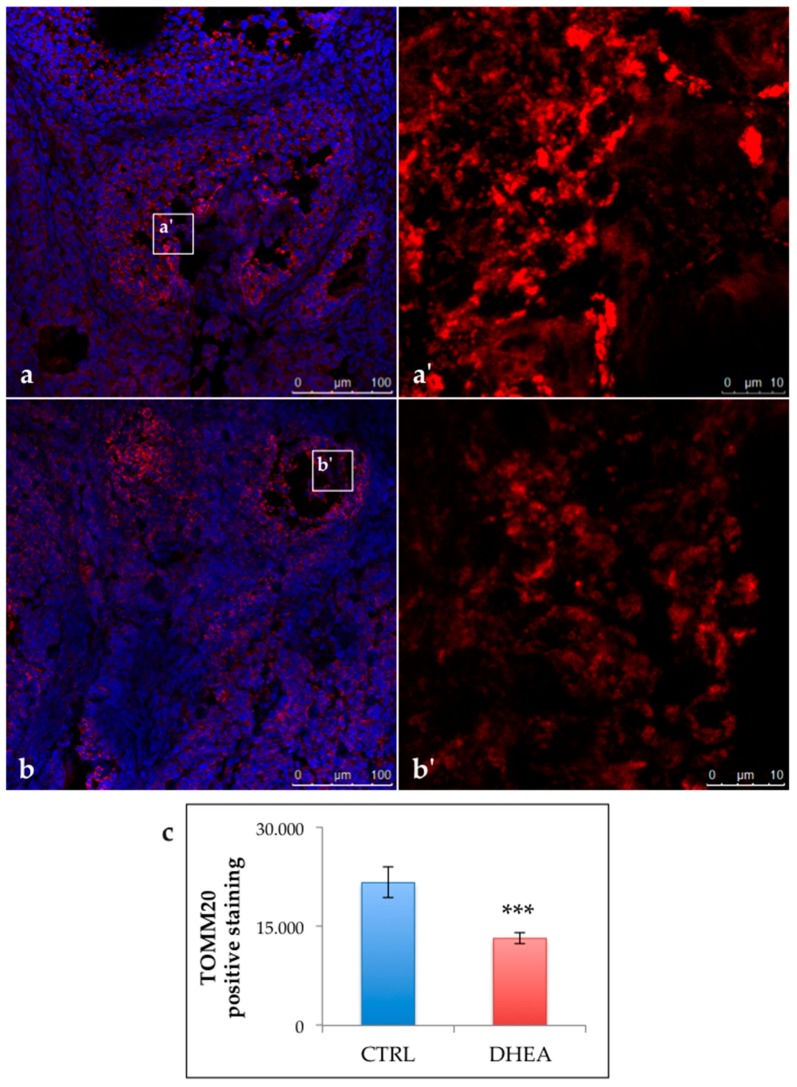
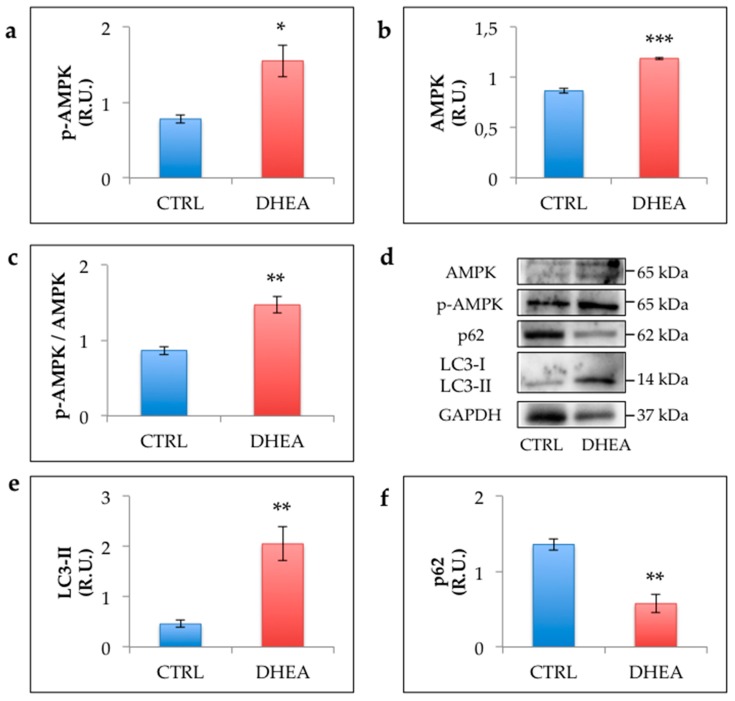
Advanced glycation end-products (AGEs) are involved in the pathogenesis and consequences of polycystic ovary syndrome (PCOS), a complex metabolic disorder associated with female infertility. The most powerful AGE precursor is methylglyoxal (MG), a byproduct of glycolysis, that is detoxified by the glyoxalase system. By using a PCOS mouse model induced by administration of dehydroepiandrosterone (DHEA), we investigated whether MG-dependent glycative stress contributes to ovarian PCOS phenotype and explored changes in the Sirtuin 1 (SIRT1) functional network regulating mitochondrial functions and cell survival. In addition to anovulation and reduced oocyte quality, DHEA ovaries revealed altered collagen deposition, increased vascularization, lipid droplets accumulation and altered steroidogenesis. Here we observed increased intraovarian MG-AGE levels in association with enhanced expression of receptor for AGEs (RAGEs) and deregulation of the glyoxalase system, hallmarks of glycative stress. Moreover, DHEA mice exhibited enhanced ovarian expression of SIRT1 along with increased protein levels of SIRT3 and superoxide dismutase 2 (SOD2), and decreased peroxisome proliferator-activated receptor gamma co-activator 1 alpha (PGC1α), mitochondrial transcriptional factor A (mtTFA) and translocase of outer mitochondrial membrane 20 (TOMM20). Finally, the presence of autophagy protein markers and increased AMP-activated protein kinase (AMPK) suggested the involvement of SIRT1/AMPK axis in autophagy activation. Overall, present findings demonstrate that MG-dependent glycative stress is involved in ovarian dysfunctions associated to PCOS and support the hypothesis of a SIRT1-dependent adaptive response.

Keywords: PCOS; SIRT1; SIRT3; advanced glycation end-products; glycative stress; glyoxalases; methylglyoxal; mitochondria; oocyte quality; oxidative stress.


Conflict of interest statement

The authors declare no conflict of interest.

Figures

Figure 1
Figure 1
Estrous cycle, body weight, ovarian morphology in the mice. (a) Representative estrous cycle of one mouse from control and dehydroepiandrosterone (DHEA) group. (b) Body weight. Ten mice per experimental group were employed. (c,d) representative Haematoxylin and Eosin (H&E) staining of ovarian sections of CTRL (c) and DHEA (d) mice. (e) Atretic follicle. Three mice per experimental group were employed. Experiments were done in triplicate. **, p < 0.001, t-test.
Figure 2
Figure 2
Representative images of trichrome staining in CTRL (a) and DHEA (b) mice. (cf) Immunolocalization of Von Willebrand Factor (vWF) (green) and alpha smooth muscle actin (α-SMA) (red) in control (c,c’ and e,e’) and DHEA (d,d’ and f,f’) ovarian sections. (gh) Immunolocalization of 17 beta-hydroxysteroid dehydrogenase type 4 (17β-HSD4) (red) in control (g) and DHEA (h) ovarian sections. Staining of lipid droplets by BODIPY 493/503 (green) in control (i) and DHEA (l) ovarian section. (cl) DNA is stained by DAPI (blue). Three mice per experimental group were employed. Experiments were done in triplicate.
Figure 3
Figure 3
Representative images of MII plate observed in oocytes from control (a–a’’) and DHEA (b–b’’) mice following induction of ovulation. Spindle is stained by α-tubulin (red) and chromosomes are stained by Hoechst 33342 (blue). Five mice per experimental group were employed. Experiments were done in triplicate.
Figure 4
Figure 4
Representative images of immunolocalization of methylglyoxal (MG)-advanced glycation end-product (AGE) in control (a,b) and DHEA (c,d) ovaries. Western blot analysis of MG-AGE (e) and receptor for AGE (RAGE) (g) and representative images (f). Data are presented as means ± SEM of densitometric analysis of immunoreactive bands normalized to internal reference protein (glyceraldehyde-3-phosphate dehydrogenase, GAPDH). Three mice per experimental group were employed. Experiments were done in triplicate.*, p < 0.05; ***, p < 0.001, t-test.
Figure 5
Figure 5
Western blot analysis of glyoxalase 1 (GLO1) (a) and GLO2 (b) and representative images of immunoreactive bands (c). Data are presented as means ± SEM of densitometric analysis of immunoreactive bands normalized to internal reference protein (glyceraldehyde-3-phosphate dehydrogenase, GAPDH). Three mice per experimental group were employed. Experiments were done in triplicate. ***, p < 0.001, t-test.
Figure 6
Figure 6
Western blot analysis of Sirtuin 1 (SIRT1) (a), SIRT3 (b), peroxisome proliferator-activated receptor gamma co-activator 1 alpha (PGC1α) (c), mitochondrial transcriptional factor A (mtTFA) (d) and superoxide dismutase 2 (SOD2) (e) and representative images of immunoreactive bands (f). Data are presented as means ± SEM of densitometric analysis of immunoreactive bands normalized to internal reference protein (glyceraldehyde-3-phosphate dehydrogenase, GAPDH). Three mice per experimental group were employed. Experiments were done in triplicate. *, p < 0.05, **, p < 0.01, ***, p < 0.001, t-test.
Figure 7
Figure 7
Immunolocalization and quantification of translocase of outer mitochondrial membrane 20 (TOMM20) positive staining (red). DNA is stained by DAPI (blue). Representative images of TOMM20 in CTRL (a,a’) and DHEA (b,b’) mice. Quantification of TOMM20 positive staining in the experimental groups (c). Data are presented as means ± SEM of mean pixel intensity of red fluorescence. Three mice per experimental group were employed. Experiments were done in triplicate. ***, p < 0.001, t-test.
Figure 8
Figure 8
Western blot analysis of p-AMP-activated protein kinase (AMPK) (a), AMPK (b), p-AMPK/AMPK ratio (c), microtubule-associated protein light chain 3 (LC3)-II (e) and p62 (f) and representative images of immunoreactive bands (d). Data are presented as means ± SEM of densitometric analysis of immunoreactive bands normalized to internal reference protein (glyceraldehyde-3-phosphate dehydrogenase, GAPDH). Three mice per experimental group were employed. Experiments were done in triplicate. *, p < 0.05, **, p < 0.01, ***, p < 0.001, t-test.

References

    1. Trikudanathan S. Polycystic ovarian syndrome. Med. Clin. N. Am. 2015;99:221–235. doi: 10.1016/j.mcna.2014.09.003. - DOI - PubMed
    1. Azziz R., Carmina E., Chen Z., Dunaif A., Laven J.S., Legro R.S., Lizneva D., Natterson-Horowtiz B., Teede H.J., Yildiz B.O. Polycystic ovary syndrome. Nat. Rev. Dis. Primers. 2016;2:16057. doi: 10.1038/nrdp.2016.57. - DOI - PubMed
    1. Sirmans S.M., Pate K.A. Epidemiology, diagnosis, and management of polycystic ovary syndrome. Clin. Epidemiol. 2013;6:1–13. doi: 10.2147/CLEP.S37559. - DOI - PMC - PubMed
    1. Papalou O., Victor V.M., Diamanti-Kandarakis E. Oxidative Stress in Polycystic Ovary Syndrome. Curr. Pharm. Des. 2016;22:2709–2722. doi: 10.2174/1381612822666160216151852. - DOI - PubMed
    1. Mohammadi M. Oxidative Stress and Polycystic Ovary Syndrome: A Brief Review. Int. J. Prev. Med. 2019;10:86. doi: 10.4103/ijpvm.IJPVM_576_17. - DOI - PMC - PubMed

Publication types