. 2020 Jan 3;20(1):273.
doi: 10.3390/s20010273.

Near-Infrared Transmittance Spectral Imaging for Nondestructive Measurement of Internal Disorder in Korean Ginseng

Affiliations

Near-Infrared Transmittance Spectral Imaging for Nondestructive Measurement of Internal Disorder in Korean Ginseng

Lalit Mohan Kandpal et al. Sensors (Basel). .

Abstract

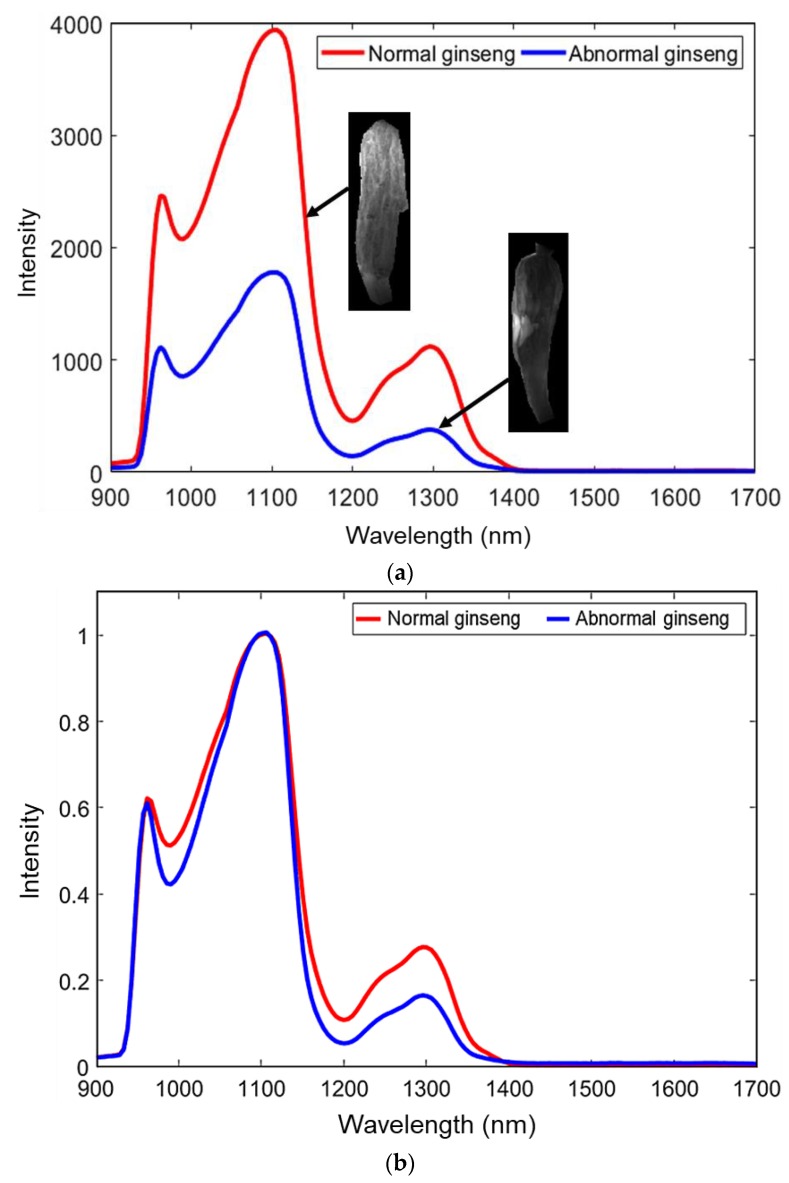
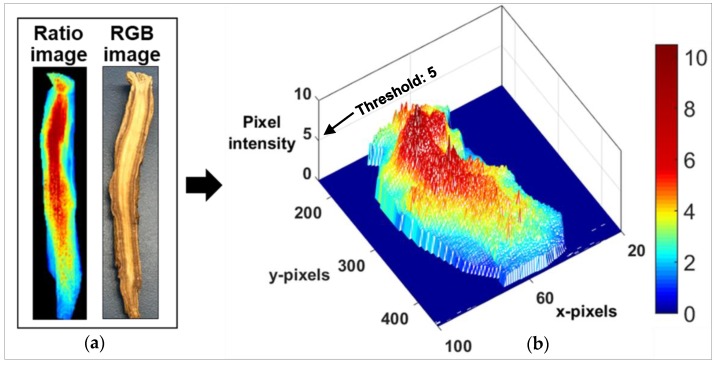
The grading of ginseng (Panax ginseng) including the evaluation of internal quality attributes is essential in the ginseng industry for quality control. Assessment for inner whitening, a major internal disorder, must be conducted when identifying high quality ginseng. Conventional methods for detecting inner whitening in ginseng root samples use manual inspection, which is time-consuming and inaccurate. This study develops an internal quality measurement technique using near-infrared transmittance spectral imaging to evaluate inner whitening in ginseng samples. Principle component analysis (PCA) was used on ginseng hypercube data to evaluate the developed technique. The transmittance spectra and spectral images of ginseng samples exhibiting inner whitening showed weak intensity characteristics compared to normal ginseng in the region of 900-1050 nm and 1150-1400 nm respectively, owing to the presence of whitish internal tissues that have higher optical density. On the basis of the multivariate analysis method, even a simple waveband ratio image has the great potential to quickly detect inner whitening in ginseng samples, since these ratio images show a significant difference between whitened and non-whitened regions. Therefore, it is possible to develop an efficient and rapid spectral imaging system for the real-time detection of inner whitening in ginseng using minimal spectral wavebands. This novel strategy for the rapid, cost-effective, non-destructive detection of ginseng's inner quality can be a key component for the automation of ginseng grading.

Keywords: food quality; ginseng; internal disorder; near-infrared transmittance imaging; nondestructive measurement; spectral analysis.


Conflict of interest statement

The authors declare no conflicts of interest.

Figures

Figure 1
Figure 1
Example of an abnormal and normal ginseng sample. (a) Intact and sliced abnormal ginseng with whitening in center; (b) intact and sliced normal ginseng without whitening.
Figure 2
Figure 2
Schematic of near-infrared hyperspectral imaging system used for transmittance imaging of ginseng.
Figure 3
Figure 3
An illustration of hyperspectral image processing sequences used for whitening detection in ginseng.
Figure 4
Figure 4
(a) Raw spectrum and corresponding hyperspectral images of normal and abnormal ginseng samples; (b) normalized spectrum of normal and abnormal ginseng samples.
Figure 5
Figure 5
(a) Second principal component (PC2) loading of ginseng showing the characteristic wavebands; (b) PC2 score image of ginseng based on the characteristic wavebands.
Figure 6
Figure 6
(a) RGB images of sliced abnormal ginseng samples (S1: 48.18% whitening, S3: 53.14% whitening, and S4: 37.66% whitening); (b) ratio image visualizing the whitening region (red pixels) in abnormal ginseng samples; (c) binary image of detected whitening region in abnormal ginseng samples; (d) RGB images of sliced normal ginseng samples. (e) Ratio images of normal ginseng samples. Coloration map has been added to the ginseng and the whitened region, to enhance visual discrimination.
Figure 7
Figure 7
(a) Ratio and RGB images of an abnormal ginseng sample used for mash plot development. (b) 3D mash plot showing ginseng pixel intensity; the x and y-axis represent the pixel identities, whereas, the z-axis represents the pixel intensity. The red region in the plot belongs to the whitening region. Threshold value of 5 was used to detect the whitening pixels, as the larger proportion of whitening pixels lies above this threshold value.
Figure 8
Figure 8
(a) Nondestructive ratio image visualizing the whitening region (red pixels) in abnormal ginseng samples; (b) binary image of detected whitening region; (c) color images of sliced abnormal ginseng samples for comparison.

References

    1. Chen C.F., Chiou W.F., Zhang J.T. Comparison of the pharmacological effects of Panax ginseng and Panax quinquefolium. Acta Pharmacol. Sin. 2008;29:1103–1108. doi: 10.1111/j.1745-7254.2008.00868.x. - DOI - PubMed
    1. Cho C.-W., Kim Y.-C., Rhee Y.K., Lee Y.-C., Kim K.-T., Hong H.-D. Chemical composition characteristics of Korean straight ginseng products. J. Ethn. Foods. 2015;1:24–28. doi: 10.1016/j.jef.2014.11.007. - DOI
    1. Lee S.M., Bae B.S., Park H.W., Ahn N.G., Cho B.G., Cho Y.L., Kwak Y.S. Characterization of Korean red ginseng (Panax ginseng Meyer): History, preparation method, and chemical composition. J. Ginseng Res. 2015;39:384–391. doi: 10.1016/j.jgr.2015.04.009. - DOI - PMC - PubMed
    1. Lee B.J., Kim H.Y., Lim S.R., Huang L., Choi H.K. Discrimination and prediction of cultivation age and parts of Panax ginseng by Fourier-transform infrared spectroscopy combined with multivariate statistical analysis. PLoS ONE. 2017;12:e0186664. doi: 10.1371/journal.pone.0186664. - DOI - PMC - PubMed
    1. Ren G., Chen F. Simultaneous quantification of ginsenosides in American ginseng (Panax quinquefolium) root powder by visible/near-infrared reflectance spectroscopy. J. Agric. Food Chem. 1999;47:2771–2775. doi: 10.1021/jf9812477. - DOI - PubMed

LinkOut - more resources