. 2020 Jan 5;21(1):351.
doi: 10.3390/ijms21010351.

Systematic Analysis of the Maize OSCA Genes Revealing ZmOSCA Family Members Involved in Osmotic Stress and ZmOSCA2.4 Confers Enhanced Drought Tolerance in Transgenic Arabidopsis

Affiliations

Systematic Analysis of the Maize OSCA Genes Revealing ZmOSCA Family Members Involved in Osmotic Stress and ZmOSCA2.4 Confers Enhanced Drought Tolerance in Transgenic Arabidopsis

Liru Cao et al. Int J Mol Sci. .

Abstract

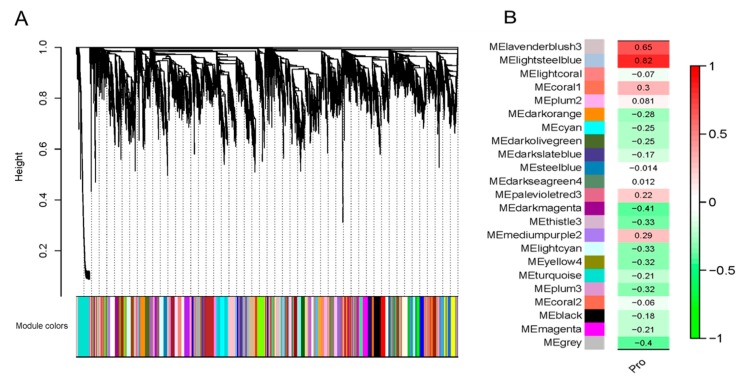
OSCAs are hyperosmolality-gated calcium-permeable channel proteins. In this study, two co-expression modules, which are strongly associated with maize proline content, were screened by weighted correlation network analysis, including three ZmOSCA family members. Phylogenetic and protein domain analyses revealed that 12 ZmOSCA members were classified into four classes, which all contained DUF221 domain. The promoter region contained multiple core elements responsive to abiotic stresses and hormones. Colinear analysis revealed that ZmOSCAs had diversified prior to maize divergence. Most ZmOSCAs responded positively to ABA, PEG, and NaCl treatments. ZmOSCA2.3 and ZmOSCA2.4 were up-regulated by more than 200-fold under the three stresses, and showed significant positive correlations with proline content. Yeast two-hybrid and bimolecular fluorescence complementation indicated that ZmOSCA2.3 and ZmOSCA2.4 proteins interacted with ZmEREB198. Over-expression of ZmOSCA2.4 in Arabidopsis remarkably improved drought resistance. Moreover, over-expression of ZmOSCA2.4 enhanced the expression of drought tolerance-associated genes and reduced the expression of senescence-associated genes. We also found that perhaps ZmOSCA2.4 was regulated by miR5054.The results provide a high-quality molecular resource for selecting resistant breeding, and lay a foundation for elucidating regulatory mechanism of ZmOSCA under abiotic stresses.

Keywords: DUF221 domain; OSCAs; abiotic stresses; co-expression modules; drought resistance; interaction; proline content.


Conflict of interest statement

The authors declare no conflict of interest.

Figures

Figure 1
Figure 1
Weighted gene co-expression network analysis (WGCNA) gene expression module of drought stress and rewatering transcriptome sequencing and correlation analysis between module and proline content. (A) Each color represents a module. (B) The number represents the correlation coefficient between proline content and each module, and the green to red indicates the maximum negative correlation to the maximum positive correlation. Pro stands for proline content.
Figure 2
Figure 2
Complex phylogenetic tree of OSCAs in Arabidopsis, sorghum, rice, and maize. An unrooted tree is generated with the MEGA5.2 software using the amino acid sequences of the OSCA proteins by the neighbor-joining (NJ) method, with 1000 bootstrap replicates. The tree shows four major phylogenetic classes (I to IV) indicated with different colored backgrounds.
Figure 3
Figure 3
Distribution of functional domains and conserved motifs in ZmOSCA proteins. (A) The phytozome website queries the functional domain of the protein encoded by the ZmOSCA genes. PF14703, PF13967, and PF02714 represent the Cytosolic domain, late exocytosis, and Calcium-dependent channel domains, respectively. Gray lines represent amino acid sequences, and each rectangle length represents the amino acid length of the domain; (B) all motifs were identified by MEME using the complete amino acid sequences of ZmOSCA proteins. Different motifs are indicated by different colors boxes numbered 1–10, and the length of each box in the proteins does not represent the actual motif size. The annotation of each motif is listed on the right. The regular expression sequences of the motifs 1–10 are listed in Table S2.
Figure 4
Figure 4
Collinearity relationships of OSCA genes among Maize, Sorghum, rice, and Arabidopsis. Zm, Sb, Os, and At stand for chromosomes in maize, sorghum, rice, and Arabidopsis, respectively. Each pair of OSCA homologous genes is connected by a red line. The yellow, blue, brown, and green boxes represent homologous regions in the genomes of maize, sorghum, rice, and Arabidopsis.
Figure 5
Figure 5
Expression patterns of ZmOSCA genes in response to PEG, ABA, and NaCl treatments. The relative expression level of 12 ZmOSCA genes was examined by the qRT-PCR. (A) Relative expression of 12 ZmOSCA genes under PEG treatment at 0, 4, 12, 24, and 36 h; (B) relative expression of 12 ZmOSCA genes under NaCl treatment at 0, 4, 12, 24, and 36 h; (C) relative expression of 12 ZmOSCA genes under ABA treatment at 0, 4, 12, 24, and 36 h; the error bars represent standard deviations (SD); t-test was p < 0.05, and the different letters represented a significant difference in the relative expression between samples. The y-axes are scales of relative expression level and x-axes are the time course of treatments for each condition.
Figure 6
Figure 6
The relationship between ZmOSCAs gene and proline content. (A) Correlation between gene expression and proline content under PEG treatment. (B) Correlation between gene expression and proline content under ABA treatment. (C) Correlation between gene expression and proline content under NaCl treatment. The yellow, red, blue, and green circles represent the class I, II, III, and IV members, respectively. The y-axis is the absolute value of the coefficient of correlation between gene expression and proline content, and the x-axis represents the number of genes.
Figure 7
Figure 7
The yeast two-hybrid analysis for interactions between ZmOSCA2.3, ZmOSCA2.4, and ZmEREB198, EREB134 proteins. Negative control (pGADT7-T + pGBKT7-Lam); positive control (pGADT7-T + pGBKT7-53); KT7 and DT7 represent pGBKT7 and pGADT7 vectors, respectively. The blue spots in the figure represent an interaction between the two proteins.
Figure 8
Figure 8
Over-expression of ZmOSCA2.4 in Arabidopsis enhances plant tolerance to drought stress. (A) Quantitative RT-PCR analysis of ZmOSCA2.4 expression in transgenic Arabidopsis.Col-0 is wild type, and L1–L4 are ZmOSCA2.4 transgenic lines; (B) one-week-old seedlings were transferred and grew for 3 days on MS medium supplemented with 300 mM Mannitol; (C) the relative fresh weight of ZmOSCA2.4 transgenic Arabidopsis and Col-0 under 300 mM Mannitol. Fresh weight in the picture represents three plants of each material; (D) O-OSCA represents ZmOSCA2.4 transgenic Arabidopsis containing L1–L4. Col-0 and O-OSCA plants were exposed for a period of six to eight days of drought (DOD). The plants were then rewatered for three days (R3D) and photographed; (E) statistical analysis of chlorophyll content of leaves of wild-type (Col-0) and transgenic lines (O-OSCA2.4) treated with drought for six days, eight days, and rewatering for 3 days; (F) measurement of proline content in leaves of wild-type (Col-0) and transgenic lines (O-OSCA) treated with drought for six days, eight days, and rewatering for three days. Mean values and standard errors were shown from three independent experiments. T tests for equality of means demonstrated that there was very significant difference between wild type (Col-0) and transgenic lines (** p value < 0.01).
Figure 9
Figure 9
Analysis of drought tolerance-associated and senescence-associated genes expression. (A) Levels of MYB44 (At5g67300), DREB2A (At5g05410) and NCED3 (At3g14440) mRNA were determined relative to ACTIN2 (At3g18780) using qRT-PCR. These genes are associated with drought stress; (B) levels of SAG12 (At5g45890), WRKY6 (At1g62300), and BFN1 (At1g11190) mRNA were determined relative to ACTIN2 (At3g18780) using qRT-PCR. Those are senescence-associated genes. Data represent at least three independent experiments using RNA extracted from leaves of Col-0 and ZmOSCA2.4 transgenic Arabidopsis (L1–L4) subjected to eight days of drought. Statistically significant differences (* p < 0.05) are represented by an asterisk.
Figure 10
Figure 10
ZmOSCA2.4 was regulated by miR5054 under drought stress and rewatering. (A) ZmOSCA2.4 and miR5072 expression patterns in transcriptome and small RNA sequencing. The leaves of the three-leaf stage were stressed for 60 h and 96 h by PEG, and rewatering for 3 days denoted as T60, T96, and TR3d, and the control groups were named CK60, CK96, and CK3d, respectively. Quantification of ZmOSCA2.4 and miR5072-3p expression levels were estimated using FPKM and TPM values, respectively. The FC in log2FC.CK60 vs. T60 is a fold change, which is the ratio of the expression between the CK60 sample and T60. It is log2FC after taking the base 2 logarithm; the same as log2FC.CK96 vs. T96 and log2FC.CK3d vs. TR3d; (B) relative expression of ZmOSCA2.4 and miR5072 under PEG treatment at 0 h, 4 h, 12 h, 24 h, and 36 h. Data represent at least three independent experiments using RNA extracted from leaves of PEG treatment at 0 h, 4 h, 12 h, 24 h, and 36 h.

References

    1. Aceved O.E., Hsiao T.C., Henderson D.W. Immediate and subsequent growth responses of maize leaves to changes in water status. Plant Physiol. 1971;48:631–636. doi: 10.1104/pp.48.5.631. - DOI - PMC - PubMed
    1. Lang K., Lang P., Bauer C., Duranton C., Wieder T., Huber S. Mechanisms of Suicidal Erythrocyte Death. Cell. Physiol. Biochem. 2005;15:195–202. doi: 10.1159/000086406. - DOI - PubMed
    1. Dornhorst A.C. Review of Medical Physiology. Anesthesiology. 2001;52:959–960.
    1. Neuhofer W., Beck F. Survival in Hostile Environments: Strategies of Renal Medullary Cells. Physiology. 2006;21:171–180. doi: 10.1152/physiol.00003.2006. - DOI - PubMed
    1. Arakawa T., Timasheff S.N. The stabilization of proteins by osmolytes. Biophys. J. 1985;47:411–414. doi: 10.1016/S0006-3495(85)83932-1. - DOI - PMC - PubMed

MeSH terms

LinkOut - more resources