. 2020 Jan 5;10(1):29.
doi: 10.3390/brainsci10010029.

The Use of Hyperscanning to Investigate the Role of Social, Affective, and Informative Gestures in Non-Verbal Communication. Electrophysiological (EEG) and Inter-Brain Connectivity Evidence

Affiliations

The Use of Hyperscanning to Investigate the Role of Social, Affective, and Informative Gestures in Non-Verbal Communication. Electrophysiological (EEG) and Inter-Brain Connectivity Evidence

Michela Balconi et al. Brain Sci. .

Abstract

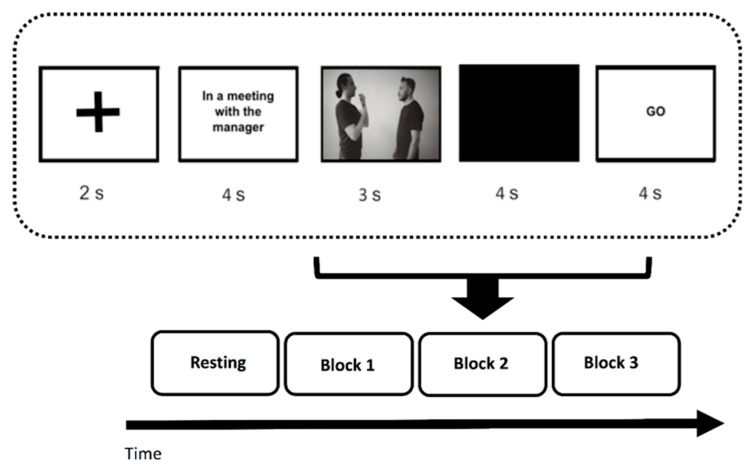
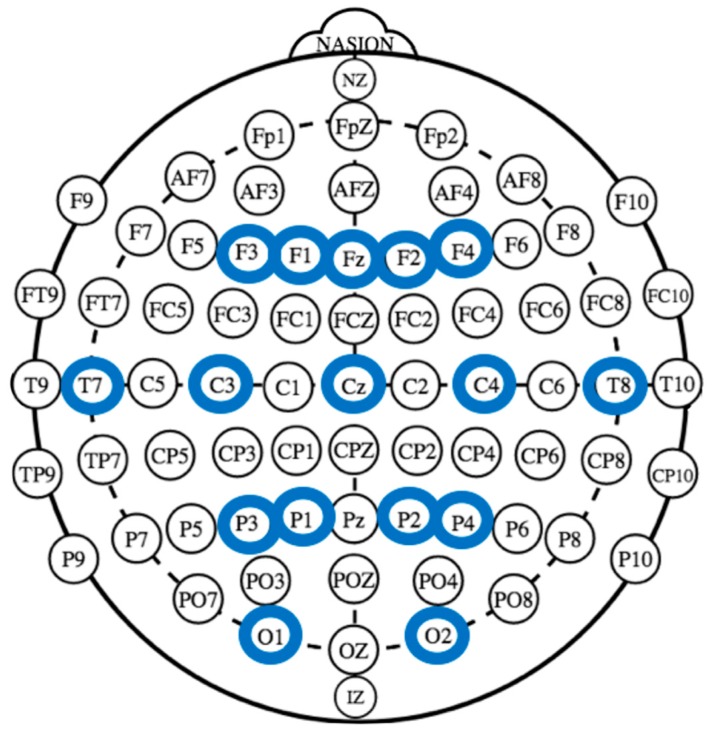
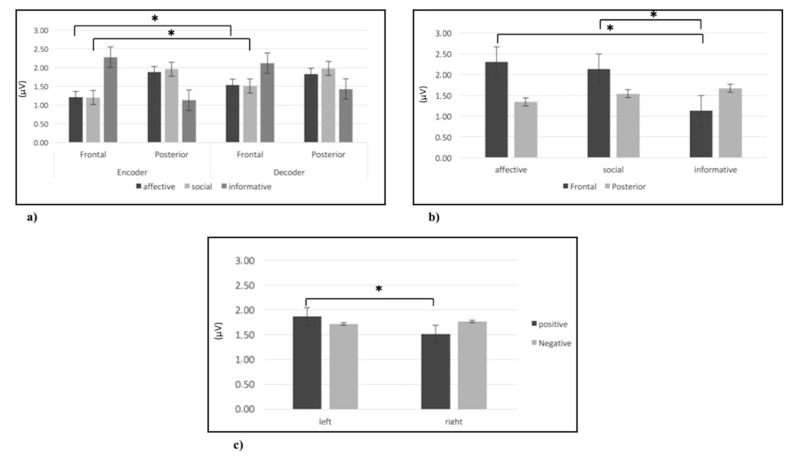
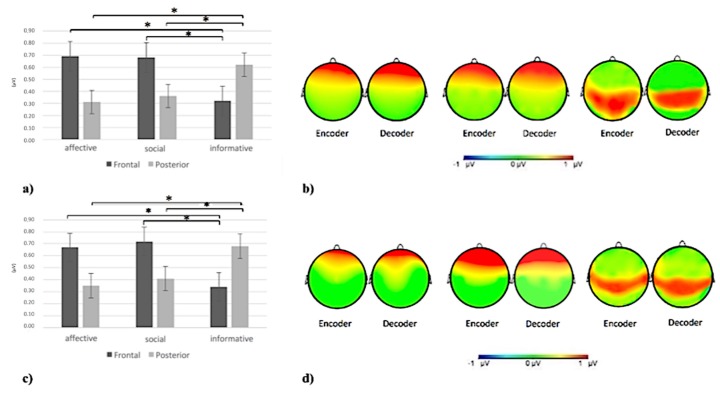
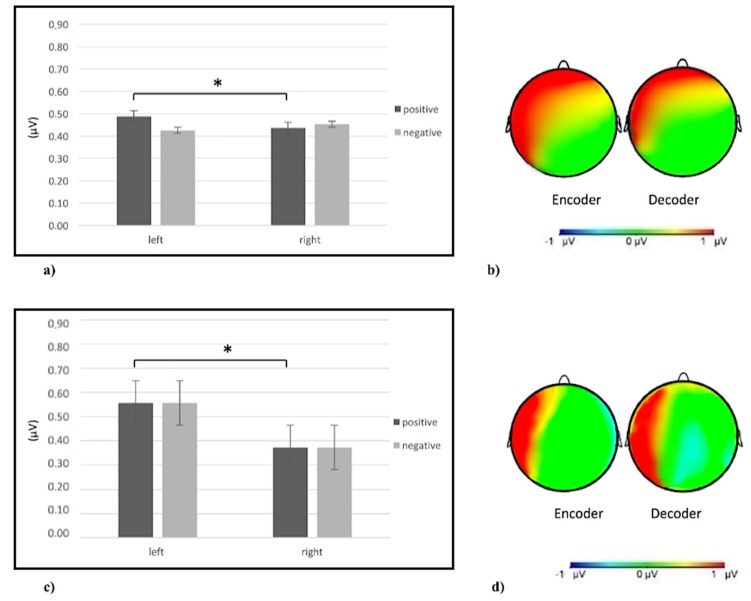
Communication can be considered as a joint action that involves two or more individuals transmitting different information. In particular, non-verbal communication involves body movements used to communicate different information, characterized by the use of specific gestures. The present study aims to investigate the electrophysiological (EEG) correlates underlying the use of affective, social, and informative gestures during a non-verbal interaction between an encoder and decoder. From the results of the single brain and inter-brain analyses, an increase of frontal alpha, delta, and theta brain responsiveness and inter-brain connectivity emerged for affective and social gestures; while, for informative gestures, an increase of parietal alpha brain responsiveness and alpha, delta, and theta inter-brain connectivity was observed. Regarding the inter-agents' role, an increase of frontal alpha activity was observed in the encoder compared to the decoder for social and affective gestures. Finally, regarding gesture valence, an increase of theta brain responsiveness and theta and beta inter-brain connectivity was observed for positive gestures on the left side compared to the right one. This study, therefore, revealed the function of the gesture type and valence in influencing individuals' brain responsiveness and inter-brain connectivity, showing the presence of resonance mechanisms underlying gesture execution and observation.

Keywords: gestures; hyperscanning; inter-brain connectivity.


Conflict of interest statement

The authors declare no conflict of interest.

Figures

Figure 1
Figure 1
The figure shows the experimental procedure for the task administration.
Figure 2
Figure 2
The figure shows the EEG channels location in the following positions: F3, F1, Fz, F2, F4, T7, C3, Cz, C4, T8, P3, P1, P2, P4, O1, and O2.
Figure 3
Figure 3
(a) Histogram of alpha brain activity for affective, social, and informative gestures in the frontal and posterior (temporo-parietal) areas in the encoder and decoder. The histogram shows an increase of brain activity (decrease of alpha power) in the frontal area for social and affective gestures in the encoder compared to the decoder. Bars represent ∓1SE. Stars mark statistically significant (p < 0.05) pairwise comparisons. (b) Histogram of delta brain activity for affective, social, and informative gestures in the frontal and posterior (temporo-parietal) areas. The histogram shows an increase of delta activity in the frontal area for affective and social gestures compared to informative gestures. Bars represent ∓1SE. Stars mark statistically significant (p < 0.05) pairwise comparisons. (c) Histogram of theta brain activity for positive and negative gestures in frontal left and right side. The histogram shows an increase of theta activity for positive gestures in the left side. Bars represent ∓1SE. Stars mark statistically significant (p < 0.05) pairwise comparisons.
Figure 4
Figure 4
(a) Histogram of delta inter-brain connectivity for affective, social, and informative gestures in the frontal and posterior (temporo-parietal) areas. The histogram shows an increase of delta inter-brain connectivity in the frontal area for affective and social gestures and in the posterior (temporo-parietal) area for informative gestures. Bars represent ∓1SE. Stars mark statistically significant (p < 0.05) pairwise comparisons. (b) Delta inter-brain connectivity representation, from left to right, for affective, social, and informative gestures in the encoder and decoder. The red area represents the increase of delta inter-brain connectivity. (c) Histogram of alpha inter-brain connectivity for affective, social, and informative gestures in the frontal and posterior (temporo-parietal) areas. The histogram shows an increase of alpha inter-brain connectivity in the frontal area for affective and social gestures and in the temporo-parietal area for informative gestures. Bars represent ∓1SE. Stars mark statistically significant (p < 0.05) pairwise comparisons. (d) Alpha inter-brain connectivity representation, from left to right, for affective, social, and informative gestures in the encoder and decoder. The red area represents the increase of alpha inter-brain connectivity.
Figure 5
Figure 5
(a) Histogram of theta brain activity for positive and negative gestures in the left and right side. The figure shows an increase of theta power for positive gestures in the left side compared to the right one. Bars represent ∓1SE. Stars mark statistically significant (p < 0.05) pairwise comparisons. (b) Theta inter-brain connectivity representation, from left to right, for positive gestures in the encoder and decoder. The red area represents an increase of theta inter-brain connectivity. (c) Histogram of beta brain activity for positive and negative gestures for the left and right side. The figure shows an increase of beta power for positive gestures for the left side compared to the right one. Bars represent ∓1SE. Stars mark statistically significant (p < 0.05) pairwise comparisons. (d) Beta inter-brain connectivity representation, from left to right, for positive gestures in the encoder and decoder. The red area represents the increase of beta inter-brain connectivity.

Similar articles

Cited by

References

    1. Salzmann Z., Duranti A., Goodwin C. Rethinking Context: Language as an Interactive Phenomenon. Cambridge University Press; New York, NY, USA: 1992.
    1. Streeck J., Hartge U. Previews: Gestures at the transition place. In: Auer P., Luzio A.D., editors. The Contextualization of Language. John Benjamins Publishing Company; Amsterdam, The Netherlands: 1992. pp. 135–157.
    1. Streeck J., Knapp M.L. The Interaction of Visual and Verbal Features in Human Communication. In: Poyatos F., editor. Advances in Nonverbal Communication. Volume 10. John Benjamins Publishing Company; Amsterdam, The Netherlands: 1992. pp. 3–23.
    1. Kendon A. Some Considerations for a Theory of Language Origins. Man. 1991;26:199–221. doi: 10.2307/2803829. - DOI
    1. McNeill D. Hand Mind What Gestures Reveal about Thought. University of Chicago Press; Chicago, IL, USA: 1992. Guide to Gesture Classification, Transcription and Distribution.

LinkOut - more resources