. 2020 Jan 16;21(1):21.
doi: 10.1186/s12859-019-3324-1.

Lag penalized weighted correlation for time series clustering

Affiliations

Lag penalized weighted correlation for time series clustering

Thevaa Chandereng et al. BMC Bioinformatics. .

Abstract

Background: The similarity or distance measure used for clustering can generate intuitive and interpretable clusters when it is tailored to the unique characteristics of the data. In time series datasets generated with high-throughput biological assays, measurements such as gene expression levels or protein phosphorylation intensities are collected sequentially over time, and the similarity score should capture this special temporal structure.

Results: We propose a clustering similarity measure called Lag Penalized Weighted Correlation (LPWC) to group pairs of time series that exhibit closely-related behaviors over time, even if the timing is not perfectly synchronized. LPWC aligns time series profiles to identify common temporal patterns. It down-weights aligned profiles based on the length of the temporal lags that are introduced. We demonstrate the advantages of LPWC versus existing time series and general clustering algorithms. In a simulated dataset based on the biologically-motivated impulse model, LPWC is the only method to recover the true clusters for almost all simulated genes. LPWC also identifies clusters with distinct temporal patterns in our yeast osmotic stress response and axolotl limb regeneration case studies.

Conclusions: LPWC achieves both of its time series clustering goals. It groups time series with correlated changes over time, even if those patterns occur earlier or later in some of the time series. In addition, it refrains from introducing large shifts in time when searching for temporal patterns by applying a lag penalty. The LPWC R package is available at https://github.com/gitter-lab/LPWC and CRAN under a MIT license.

Keywords: Hierarchical clustering; Temporal alignment; Unsupervised learning.


Conflict of interest statement

The authors declare that they have no competing interests.

Figures

Fig. 1
Fig. 1
A simple artificial clustering task with four genes and timepoints at 0, 5, 15, 30, 45, 60, 75, and 90 min. Each of the genes has a sharp rise and fall in expression, which occurs at a different timepoint. Genes 1 and 2 both have late spikes and intuitively should be clustered together. Genes 3 and 4 are both early. Several widely used clustering methods group the genes into two clusters, but only LPWC groups the early and late genes correctly. The colored dots in the table represent the different genes
Fig. 2
Fig. 2
An example of the four patterns simulated using ImpulseDE [21] with low variance. Each model has different characteristics (expression increases and decreases over time) and contains 50 simulated genes
Fig. 3
Fig. 3
ARI scores with different clustering methods for the low variance simulated impulse data over 100 different simulations
Fig. 4
Fig. 4
Example lLPWC clusters for the low variance simulated impulse model. The red lines represent the mean intensity values
Fig. 5
Fig. 5
Clusters for the yeast data using the lLPWC algorithm. The y-axis shows the log2 salt/control ratio after subtracting the 0s log2 ratio from all values so all temporal profiles start at 0. The red lines represent the mean adjusted log2 ratios
Fig. 6
Fig. 6
Clusters for the axolotl data using the hLPWC algorithm. The log2 ratio is with respect to the 0 day timepoint. The red lines represent the mean log2 ratios
Fig. 7
Fig. 7
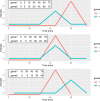
An example of the effects of applying different lags to genes 1 and 2. The three panels show aligned expression vectors Y1 and Y2 and aligned timepoint vectors T1 and T2. The lagged timepoint vector indices involving NA values are dropped from the tables. Top: with no lags, X1=0 and X2=0, the temporal profiles of genes 1 and 2 are not aligned so the gene pair will have a low LPWC similarity score. Middle: with lags X1=−1 and X2=0, the patterns are aligned, and the LPWC similarity score will be high. Bottom: with X1=−1 and X2=1, the temporal shapes are once again not aligned, and the LPWC similarity score will be even lower than in the top row because the penalty for introducing lags is applied

References

    1. Bar-Joseph Z, Gitter A, Simon I. Studying and modelling dynamic biological processes using time-series gene expression data. Nat Rev Genet. 2012;13(8):552–64. - PubMed
    1. Spies D, Ciaudo C. Dynamics in Transcriptomics: Advancements in RNA-seq Time Course and Downstream Analysis. Comput Struct Biotechnol J. 2015;13:469–77. - PMC - PubMed
    1. Liang Y, Kelemen A. Dynamic modeling and network approaches for omics time course data: overview of computational approaches and applications. Brief Bioinform. 2017. 10.1093/bib/bbx036. - PubMed
    1. Gibbons FD, Roth FP. Judging the quality of gene expression-based clustering methods using gene annotation. Genome Res. 2002;12(10):1574–81. - PMC - PubMed
    1. Jaskowiak PA, Campello RJ, Costa IG. On the selection of appropriate distances for gene expression data clustering. BMC Bioinformatics. 2014;15(Suppl 2):2. - PMC - PubMed

LinkOut - more resources