. 2020 Mar 4;105(5):921-933.e5.
doi: 10.1016/j.neuron.2019.12.006. Epub 2020 Jan 13.

Opposing Contributions of GABAergic and Glutamatergic Ventral Pallidal Neurons to Motivational Behaviors

Affiliations

Opposing Contributions of GABAergic and Glutamatergic Ventral Pallidal Neurons to Motivational Behaviors

Marcus Stephenson-Jones et al. Neuron. .

Abstract

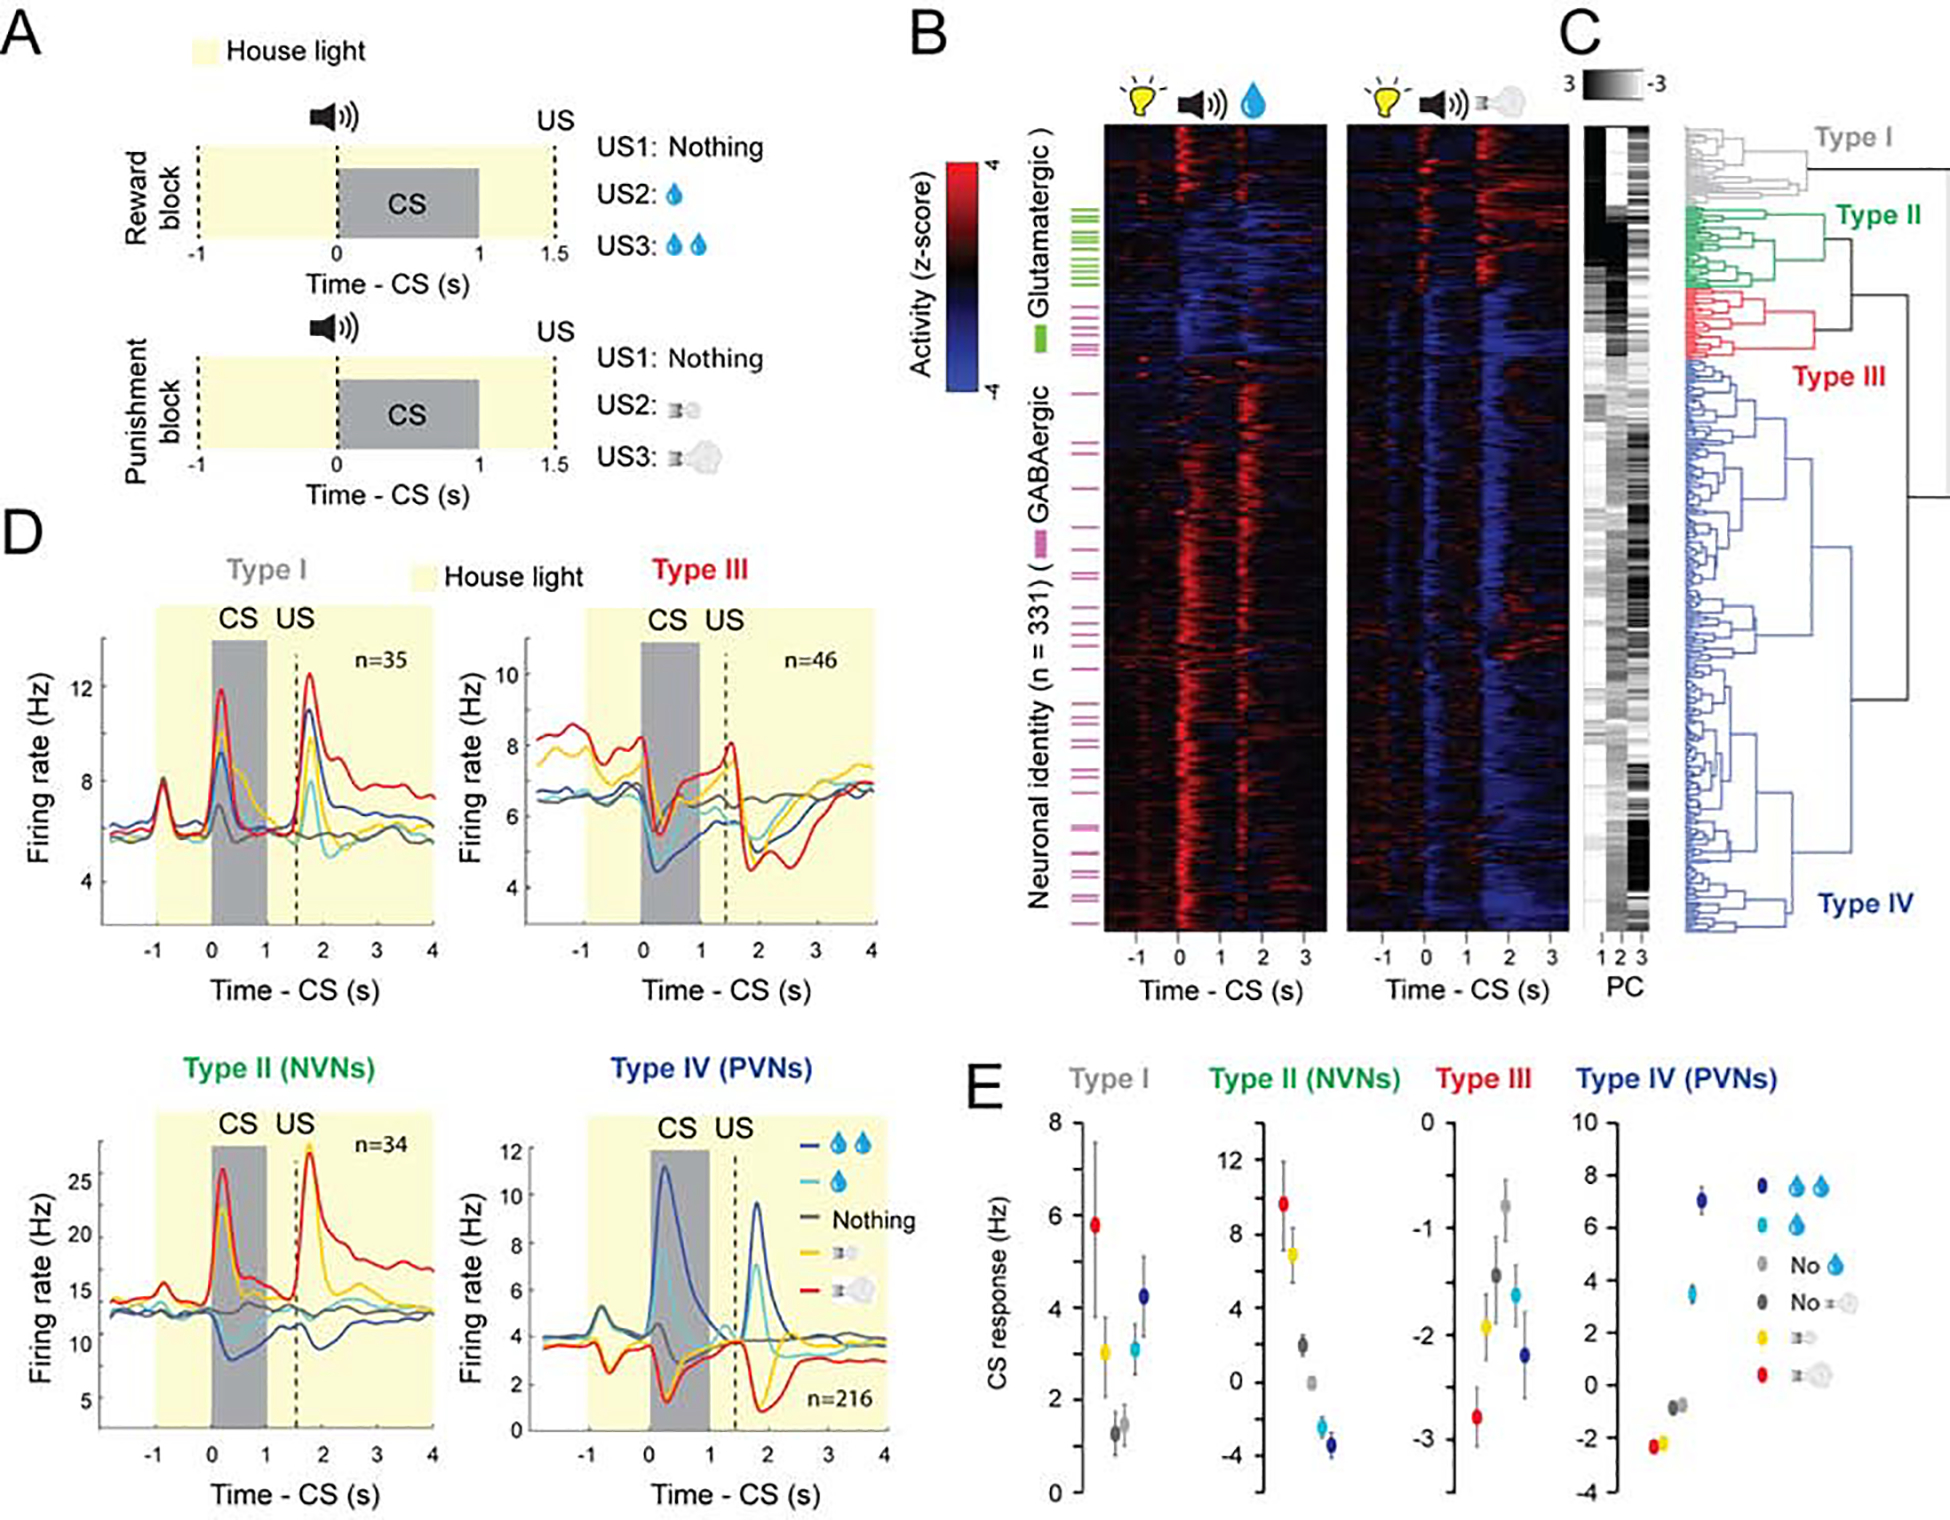
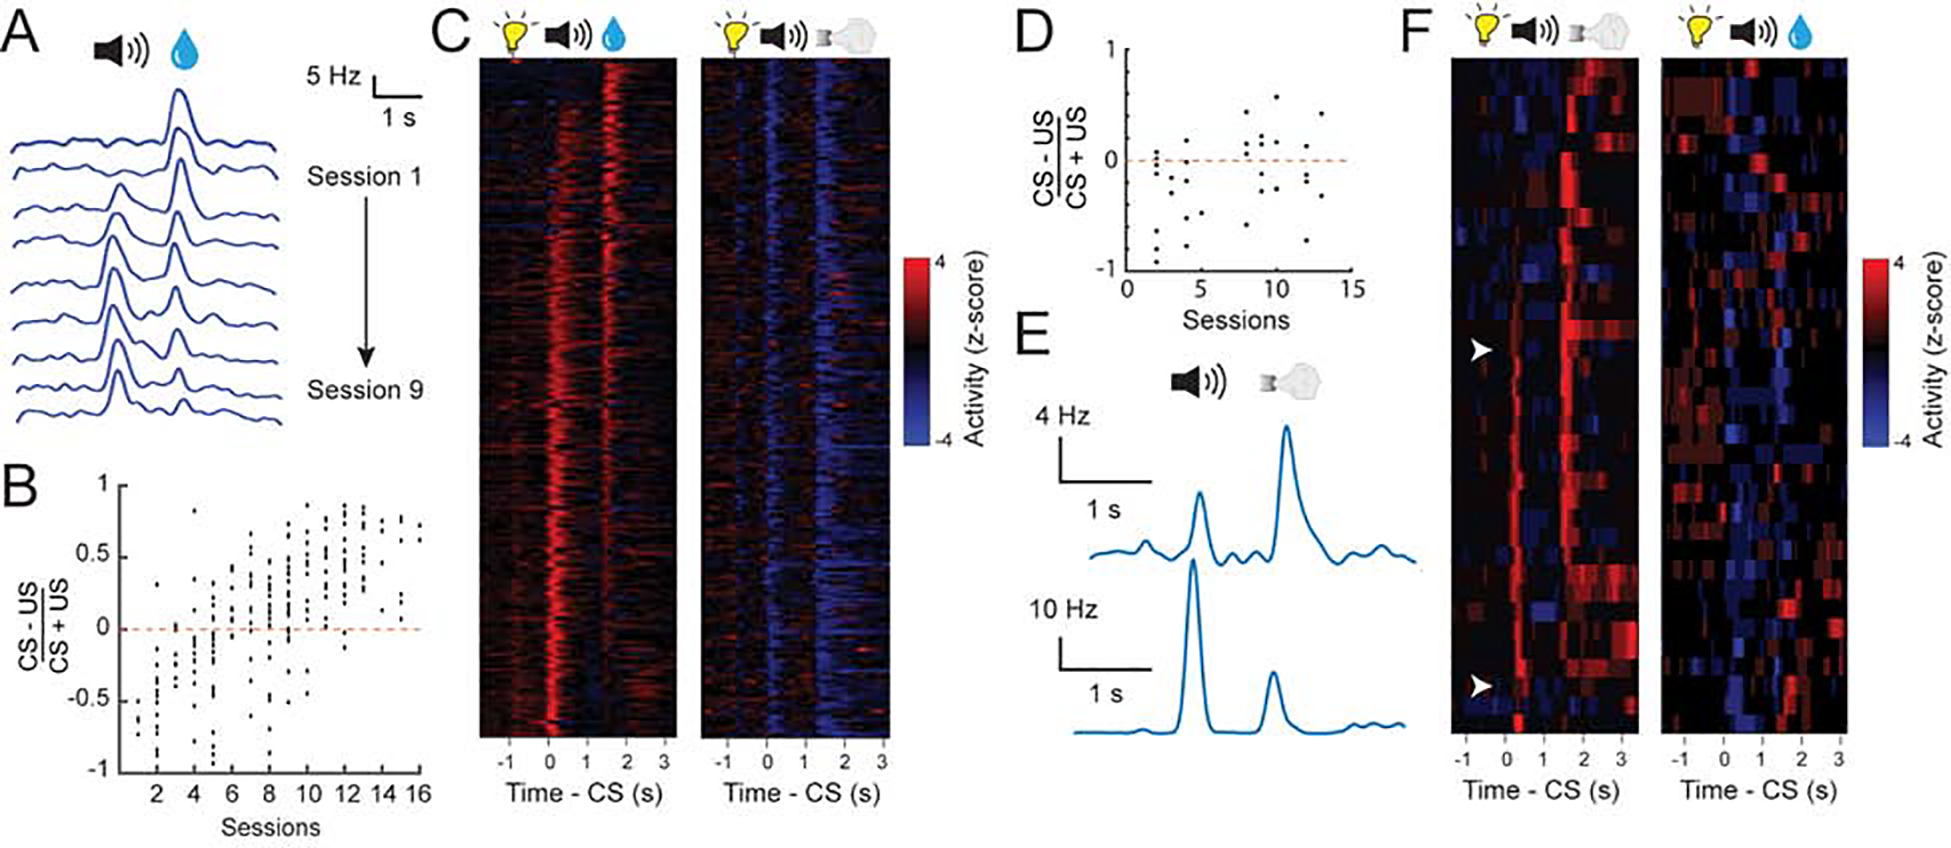
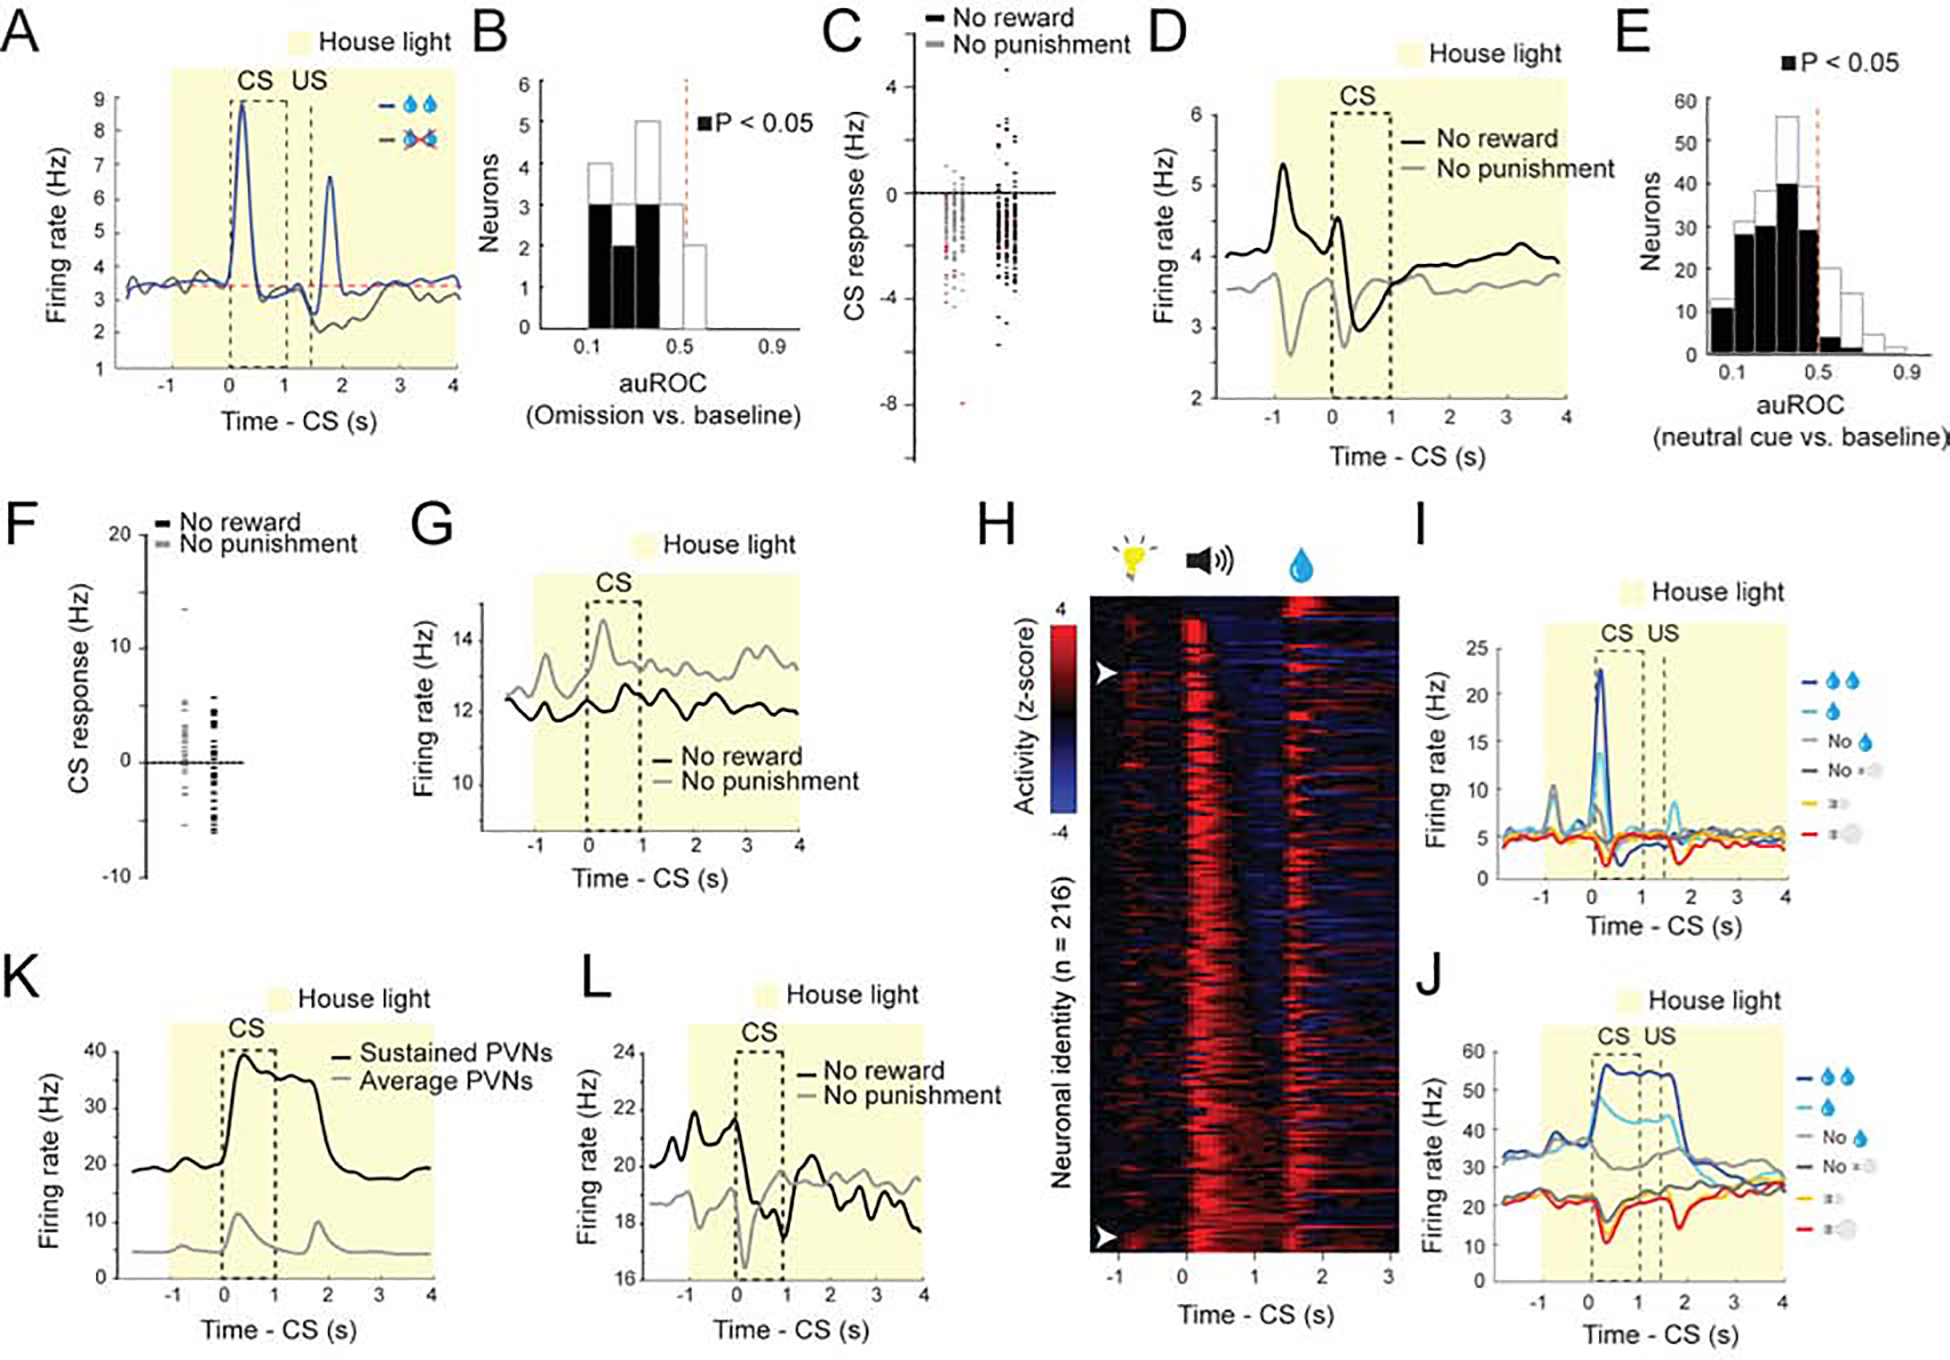
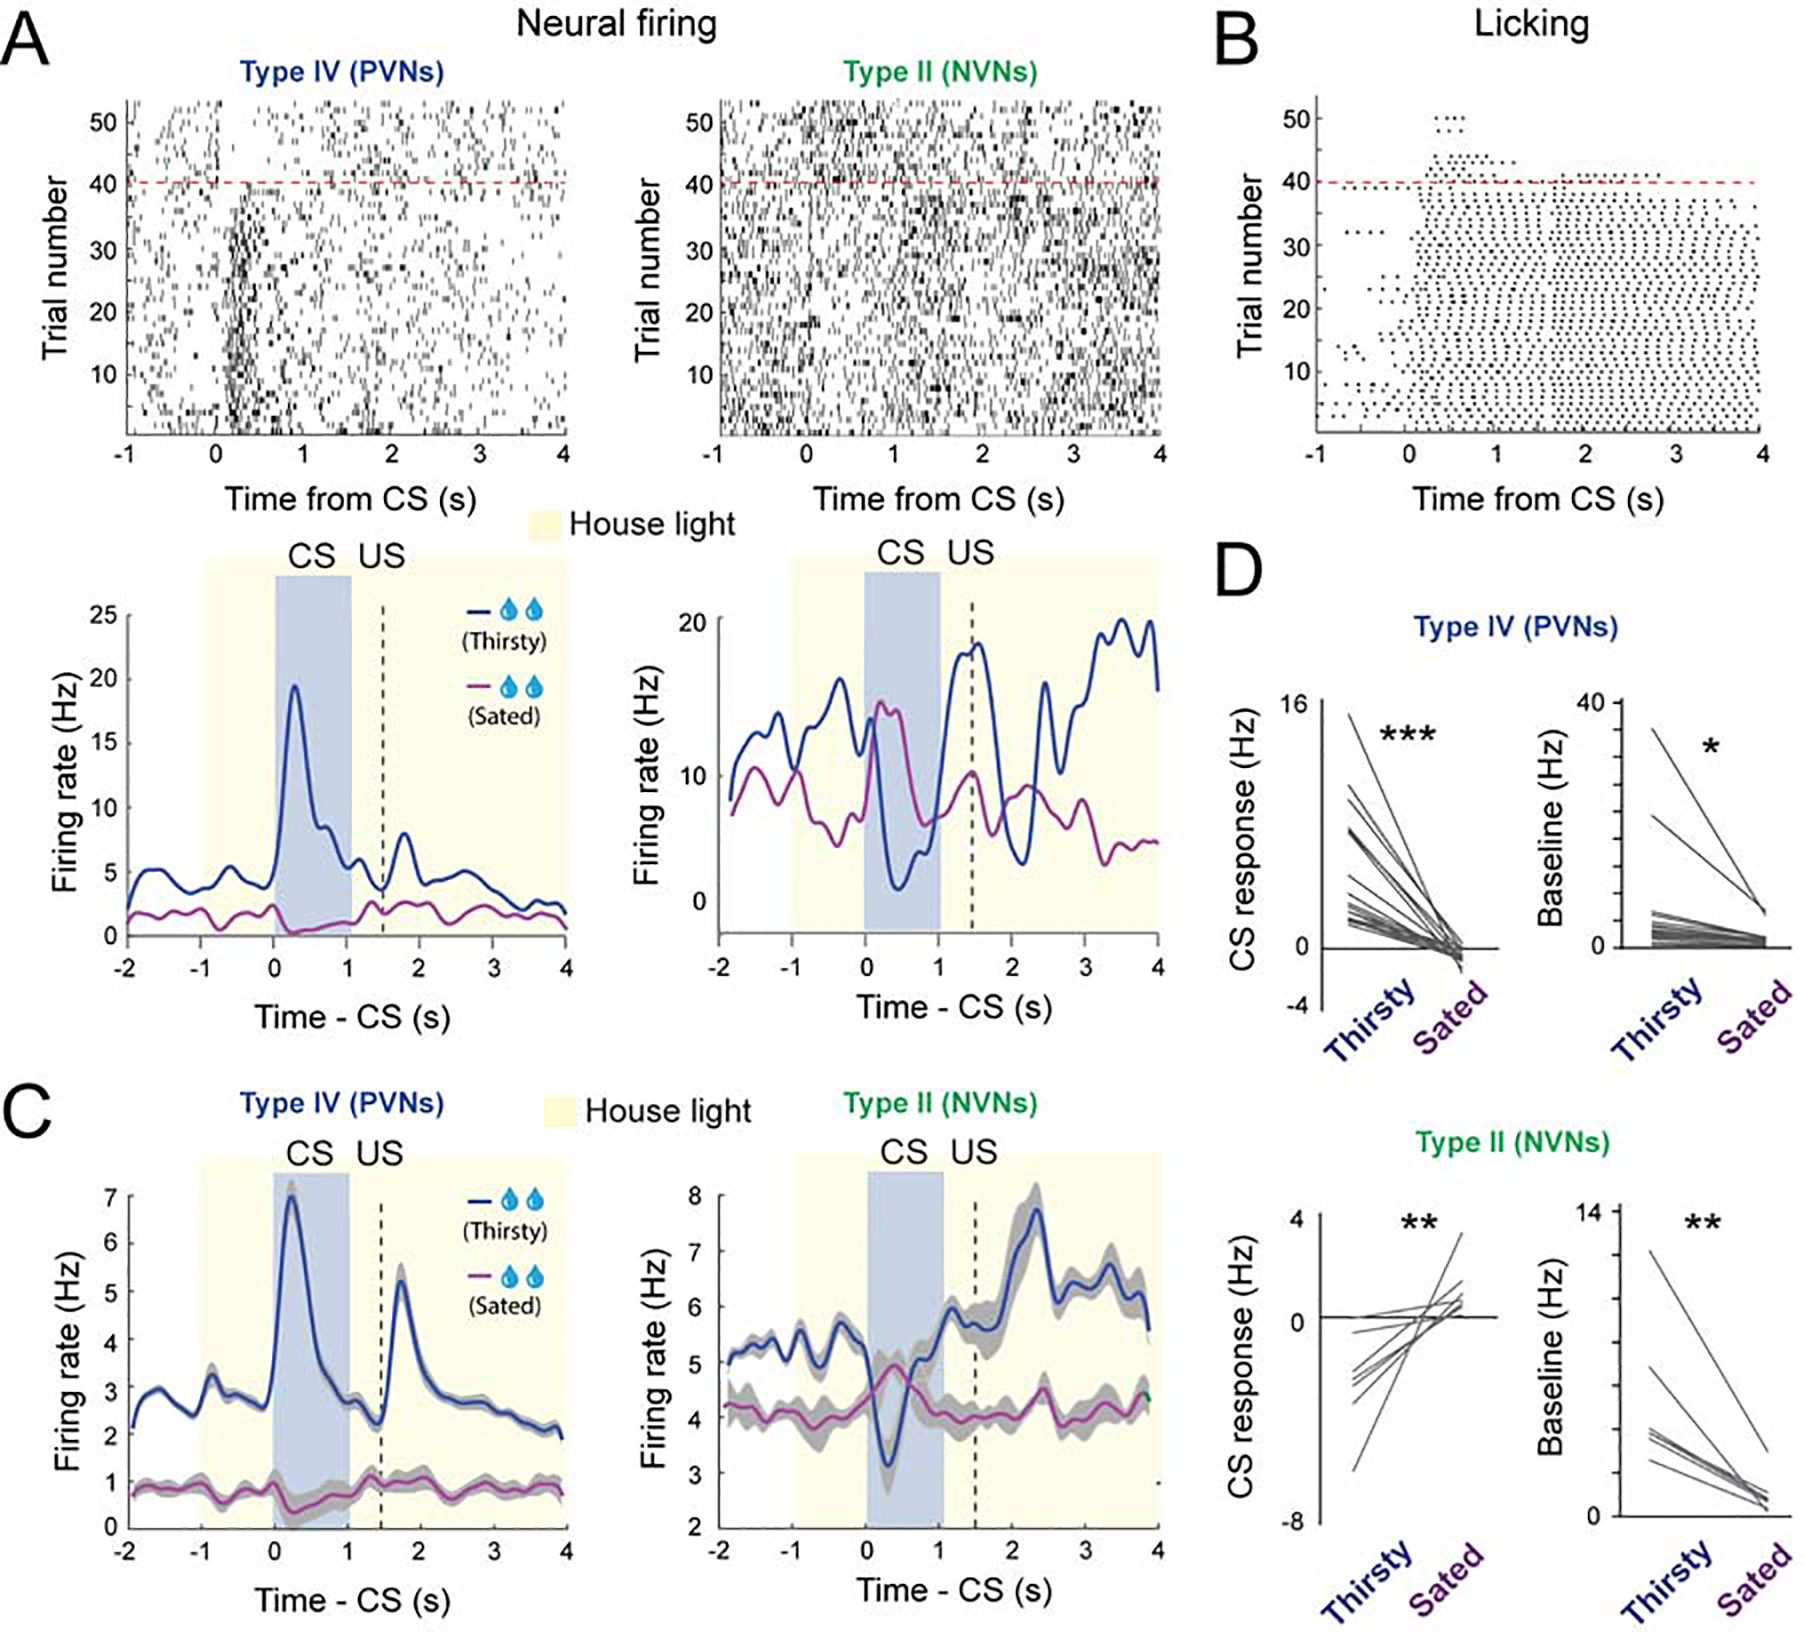
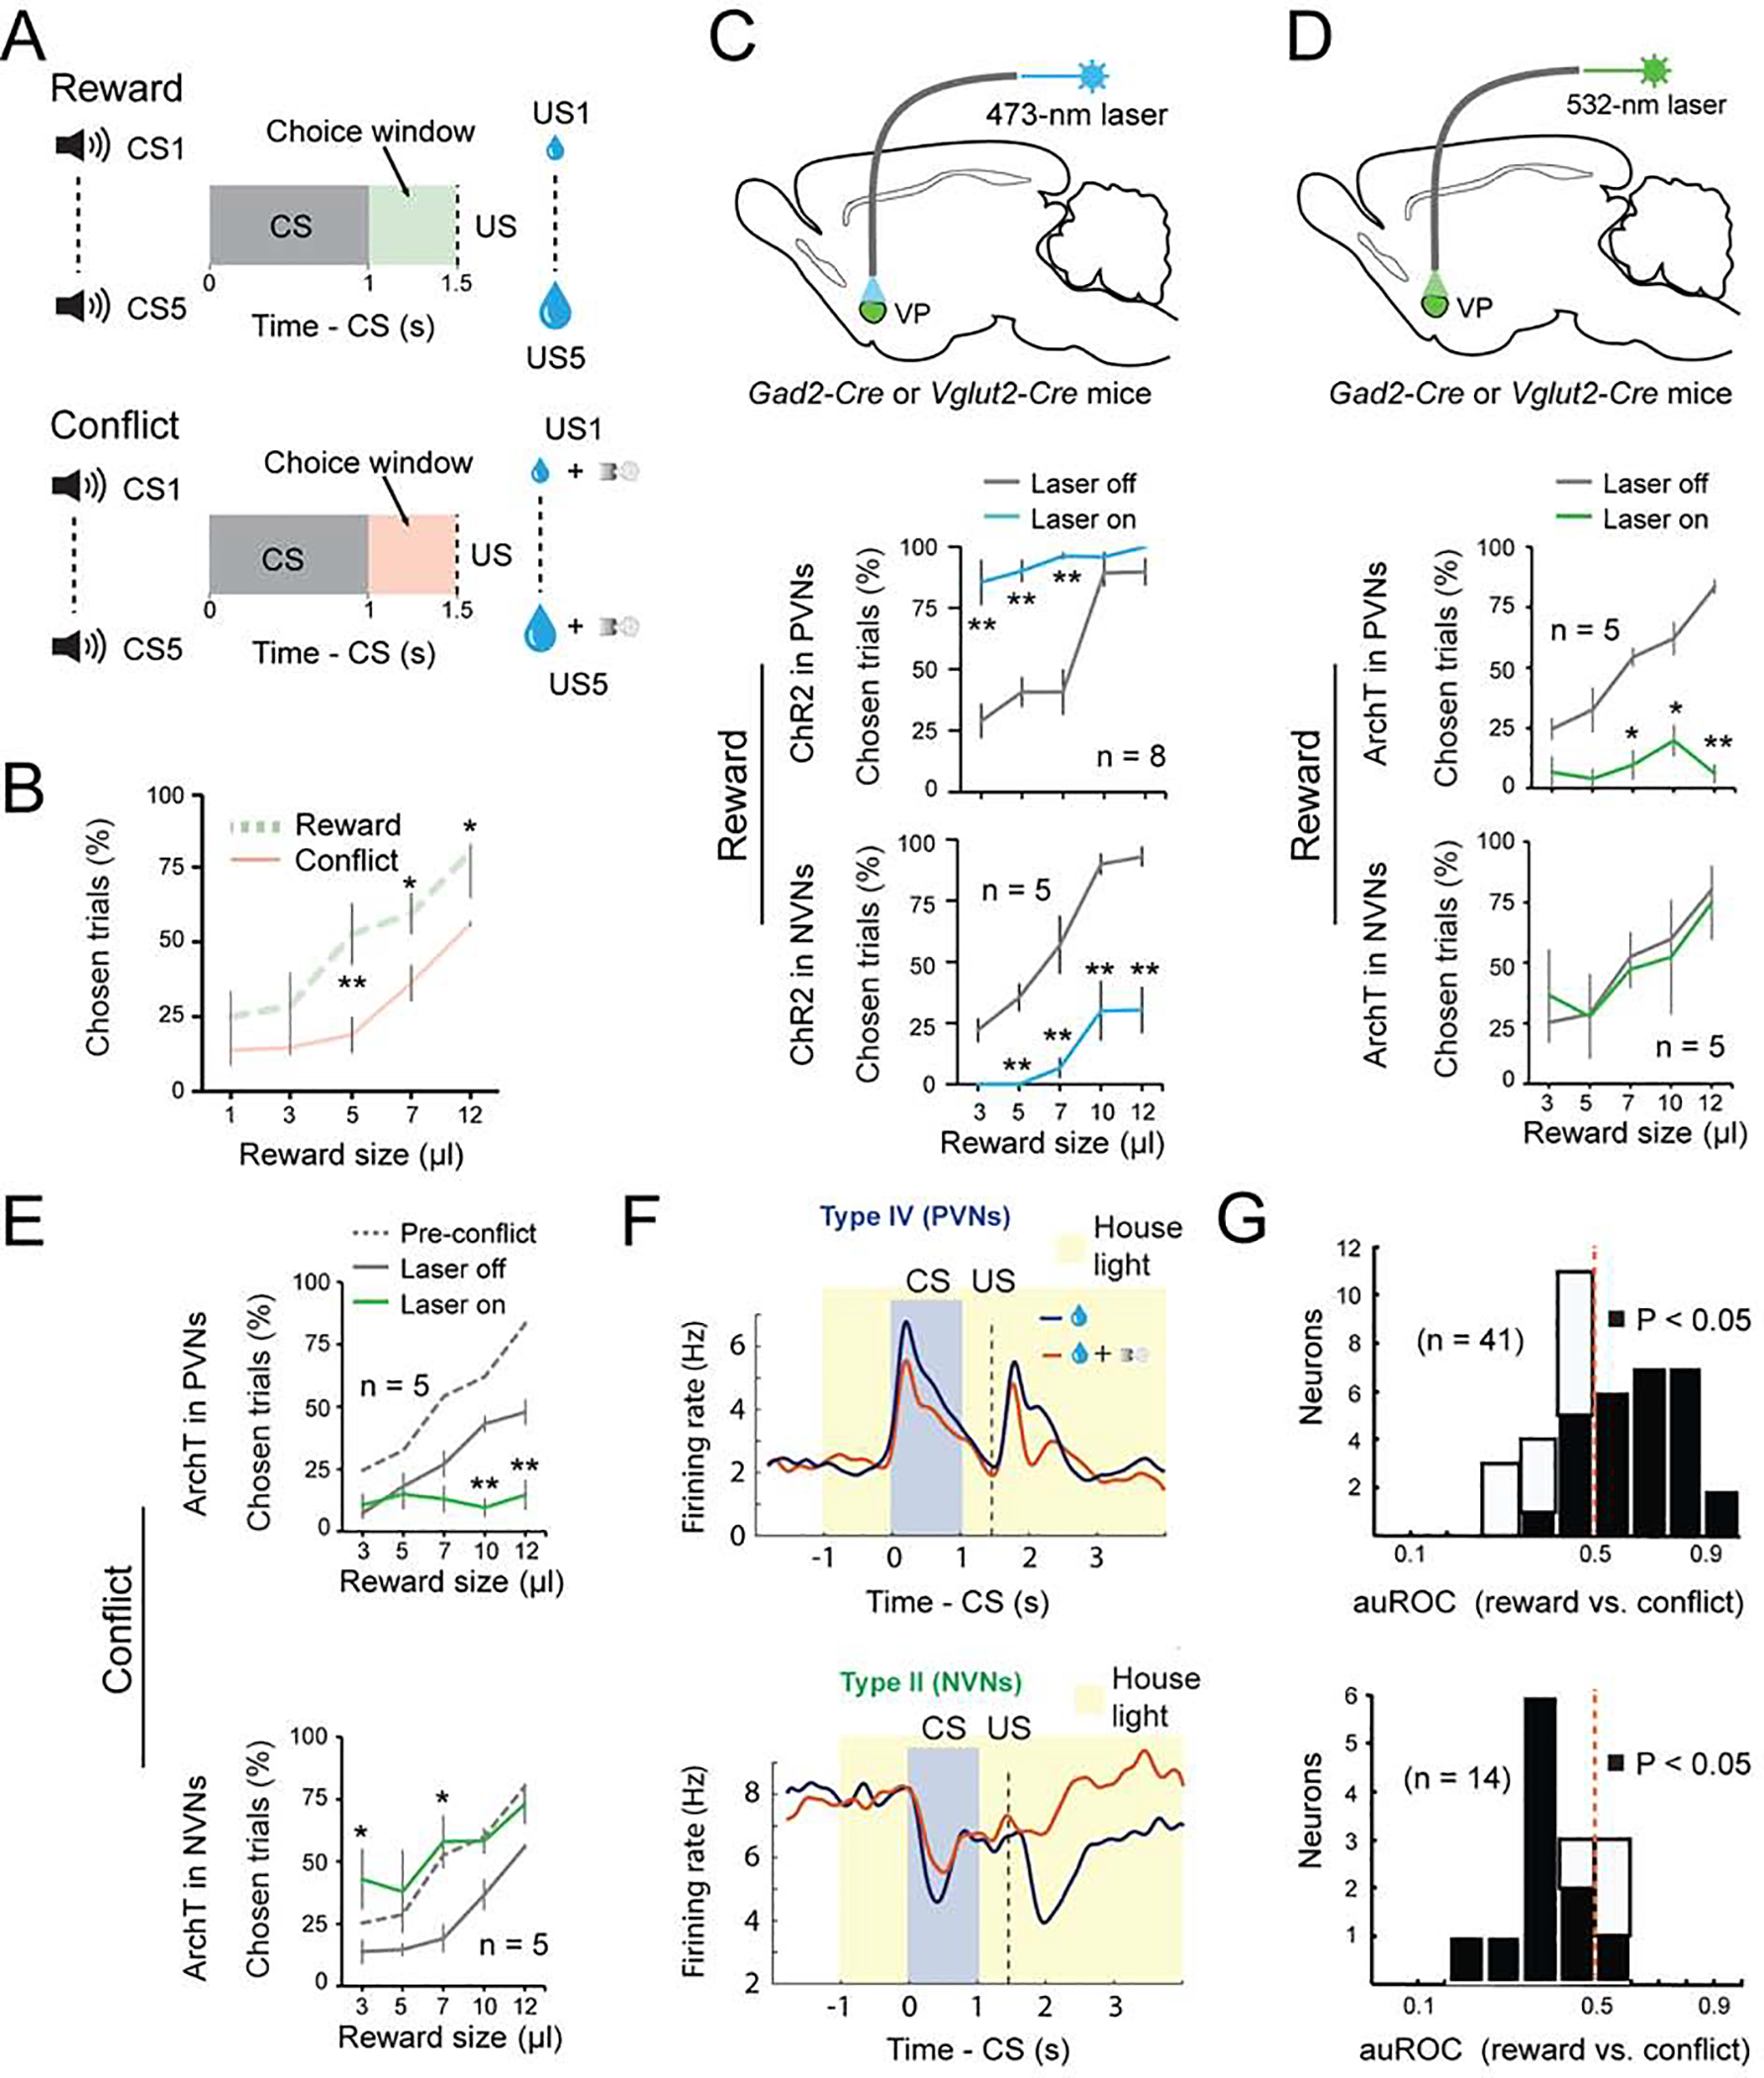
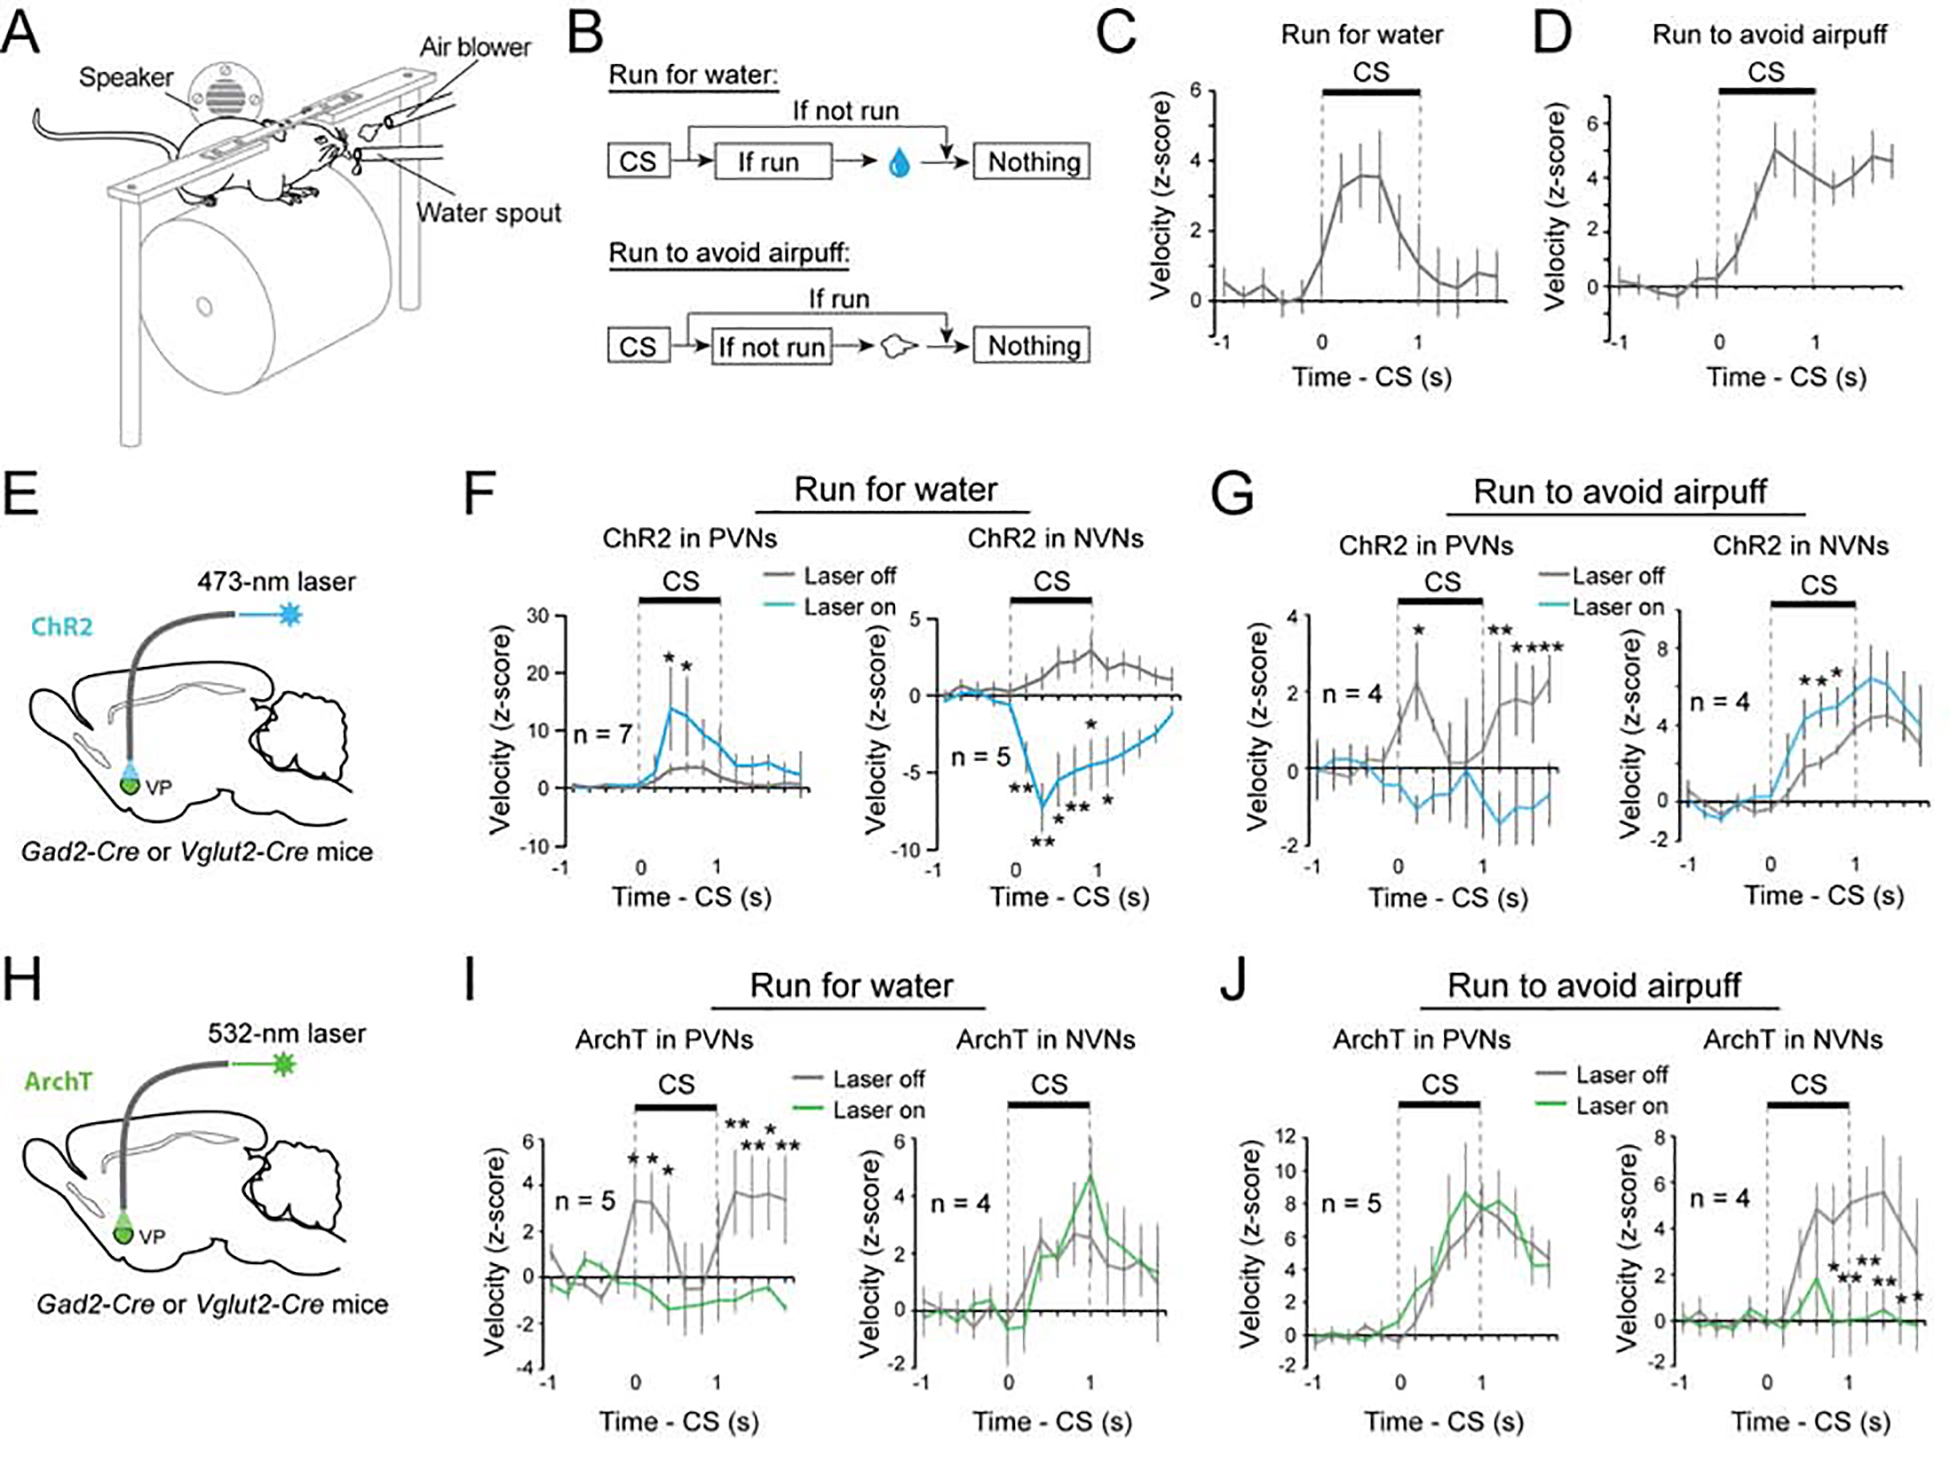
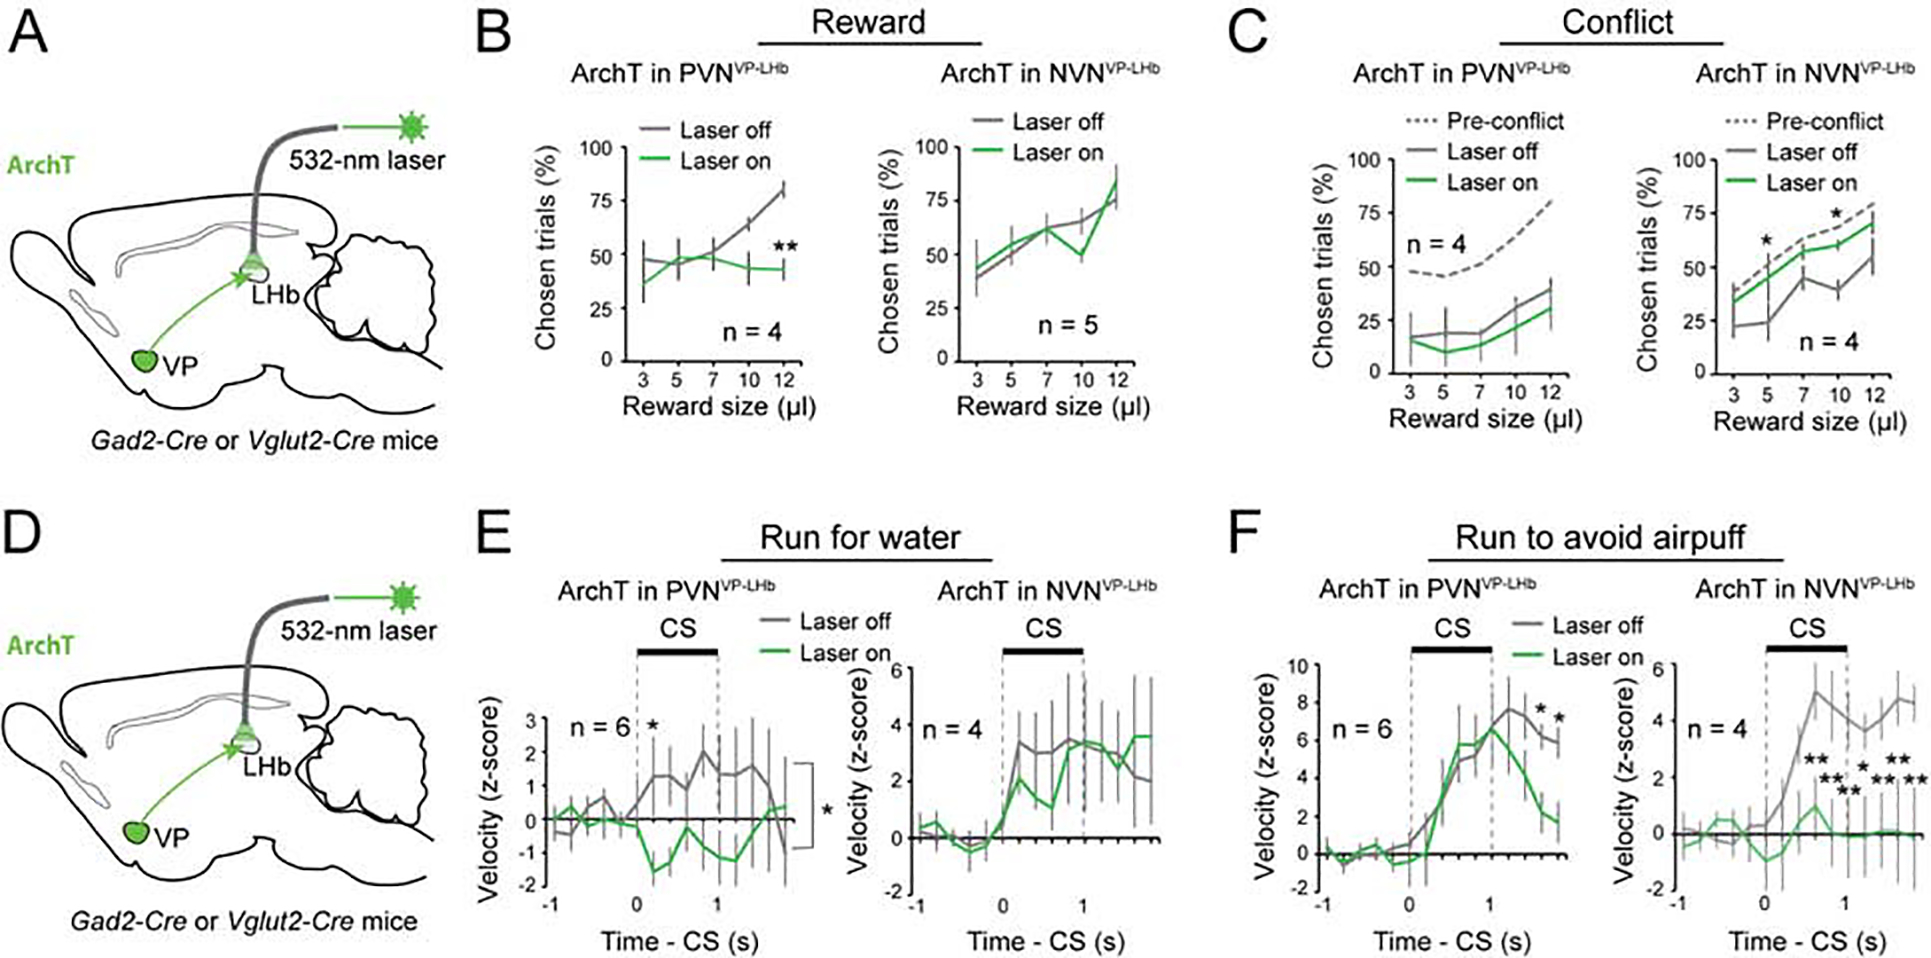
The ventral pallidum (VP) is critical for invigorating reward seeking and is also involved in punishment avoidance, but how it contributes to such opposing behavioral actions remains unclear. Here, we show that GABAergic and glutamatergic VP neurons selectively control behavior in opposing motivational contexts. In vivo recording combined with optogenetics in mice revealed that these two populations oppositely encode positive and negative motivational value, are differentially modulated by animal's internal state, and determine the behavioral response during motivational conflict. Furthermore, GABAergic VP neurons are essential for movements toward reward in a positive motivational context but suppress movements in an aversive context. In contrast, glutamatergic VP neurons are essential for movements to avoid a threat but suppress movements in an appetitive context. Our results indicate that GABAergic and glutamatergic VP neurons encode the drive for approach and avoidance, respectively, with the balance between their activities determining the type of motivational behavior.

Keywords: GABAergic neurons; glutamatergic neurons; negative motivation; positive motivation; punishment avoidance; reward seeking; ventral pallidum.


Conflict of interest statement

Declaration of Interests The authors declare no competing interests.

Figures

Figure 1.
Figure 1.. Separate VP populations opposingly encode motivational value and salience.
(A) Illustrations of experimental design of the reward and punishment classical conditioning tasks. The neutral CSs are the tones that predict nothing. (B) Z-score activity plots of the responses of all neurons recorded in the reward and punishment tasks. Red, increase from baseline; blue, decrease from baseline; each row represents one neuron. Green and purple dashes indicate neurons that were optogenetically tagged as being glutamatergic and GABAergic, respectively. (C) First three principle components (PC) and hierarchical clustering dendrogram showing the relationship of each neuron within the four clusters. (D) Average firing rates of the four types of neurons in the reward and punishment blocks, shown as spike density functions (n=331 from 6 mice). (E) Average CS response magnitude in the reward and punishment blocks for each of the four types of neurons. All comparisons between the average CS responses were significant (at least P<0.05; Wilcoxon signed-rank test) except between the two neutral CSs (which predict no reward and no punishment in the reward and punishment blocks, respectively, as indicated) in Type I, III and IV neurons. There was also no significant difference between the CS response predicting large and small punishments in Type III neurons. Data in D are presented as mean ± s.e.m.
Figure 2.
Figure 2.. Development of responses in VP neurons during learning.
(A) The responses to reward cue (CS) or reward (US) in an example PVN tracked over multiple sessions (S1-S9). Responses are shown as spike density plots. (B) CS-US (reward) response index for all PVNs across different stages of training (r2 = 0.69, P < 0.001 by linear regression). (C) Z-score activity plots of the responses of all PVNs during reward and punishment blocks. Each row represents the activities of one neuron. Neurons are sorted according to their CS/US response ratio. (D) The CS-US response index for all NVNs in the punishment block across different stages of training (r2 = 0.41, P < 0.05 by linear regression). (E) The CS and US responses of two example NVNs in the punishment block at different stages of training. Responses are shown as spike density plots. (F) Z-score activity plots of the responses of all NVNs during reward and punishment blocks. Each row represents the activities of one neuron. Neurons are sorted according to their CS/US response ratio.
Figure 3.
Figure 3.. VP neuron responses are modulated by expectation.
(A) Average firing rates of type IV neurons (PVNs) in response to reward omission, shown as spike density functions. (B) auROC analysis of difference in firing rate between baseline and reward omission trials (n = 15 from 2 mice). Filled bars, P<0.05, t-test (C) Graph showing the CS responses of all PVNs during the neutral cue trials in the reward and punishment blocks (reward block, mean, −1.26 Hz; punishment block, mean, −1.05 Hz). Data points in red come from PVN’s with sustained responses to the CS. (D) Average responses of PVNs during neutral trials in reward and punishments blocks. Responses are shown as spike density plots. (E) auROC analysis of difference in firing rate between baseline and neutral cue presentation in PVNs in the reward block (n = 221 from 6 mice). Filled bars, P<0.05, t-test. (F) Graph showing the CS responses of all NVNs during the neutral cue trials in the reward and punishment blocks (reward block, mean, −0.32 Hz; punishment block, mean, −1.96 Hz). (G) Average responses of NVNs during neutral trials in reward and punishments blocks. Responses are shown as spike density plots. (H) Z-score activity plots of the responses of all type IV neurons sorted for the duration of their CS response. (I, J) Two example neurons showing phasic (G) and sustained (H) responses to reward predicting cues. (K) Average responses of all PVNs and the PVNs with a sustained response to CS on large reward trials. Responses are shown as spike density plots. (L) Average responses of the ‘sustained’ PVNs, which showed sustained responses to the CS predicting large reward (see K), to the CS during neutral trials in reward and punishments blocks. Responses are shown as spike density plots.
Figure 4.
Figure 4.. The response of VP neurons to reward predicting CS depends on the internal motivational state.
(A) Top: raster plots showing the neural activity of a PVN (left) and a NVN (right) during large reward trials. Bottom: spike density plots showing the average response of the corresponding two neurons when the mouse was thirsty or sated. (B) Raster plot showing the licking behavior in the same behavioral session. (C) Average spike density plots showing the activity of PVNs (n = 19, from 2 mice) and NVNs (n = 7, from 2 mice) in thirsty and sated trials. (D) Left: graphs showing the average CS response of PVNs (top) and NVNs (bottom) when mice were thirsty or sated. Right: graphs showing the baseline firing rates of PVNs (top) and NVNs (bottom) when mice were thirsty or sated (*** P < 0.001, ** P < 0.01, * P < 0.05; paired t-test). Data in C are presented as mean ± s.e.m. (shaded areas).
Figure 5.
Figure 5.. The balance of activity between PVNs and NVNs controls reward seeking during motivational conflict.
(A) Schematics of the experimental design. (B) Motivational conflict reduced reward seeking (F(1, 9) = 35.19, p < 0.0001). **p < 0.01, *p < 0.05, two-way ANOVA followed by Tukey’s test. (C) Top: a schematic of the approach. Middle: activation of PVNs increased reward seeking (F(1, 15)= 92.32, p < 0.001). Bottom: activation of NVNs decreased reward seeking (F(1, 7) = 108.68, p < 0.001). **P < 0.01, two-way ANOVA followed by Tukey’s test. (D) Top: a schematic of the approach. Middle: inhibition of PVNs decreased reward seeking (F(1, 9) = 50.37, p < 0.0001). Bottom: inhibition of NVNs had no effect on reward seeking (F(1, 9) = 0.055, p = 0.82). **P < 0.01, *P < 0.05, two-way ANOVA followed by Tukey’s test. (E) Top: inhibition of PVNs further decreased reward seeking in the conflict task (F(1, 9) = 27.60, p < 0.0001). Bottom: inhibition of NVNs increased reward seeking to pre-conflict levels (F(1, 9) = 50.37, p < 0.0001). **p < 0.01, *p <0.05, two-way ANOVA followed by Tukey’s test. (F) Average response of PVNs (top; n = 41, from two mice) or NVNs (bottom; n = 14, from two mice) in reward or conflict trials, shown as spike density plots. (G) auROC analysis of difference in the CS response during reward and conflict trials. Top: PVNs (n = 41 from two mice); bottom: NVNs (n = 14, from two mice). Filled bars, P<0.05, t-test. Data are presented as mean ± s.e.m.
Figure 6.
Figure 6.. PVNs and NVNs switch roles in controlling actions when motivational context changes.
(A-D) The running tasks. (A) A schematic of the experimental design. (B) Schematics of the experimental procedure. (C) Behavioral performance of mice in the run-for-water task (n = 7). (D) Behavioral performance of mice in the run-to-avoid-air-puff task (n = 4). (E) Schematics of the approach. (F) Left: activation of PVNs increased running for water reward (F(1, 13) = 7.90, p = 0.0055). Right: activation of NVNs decreased running for water reward (F(1, 9) = 132.73, p <0.001). **P < 0.01, *P < 0.05, two-way ANOVA followed by Tukey’s test. (G) Left: activation of PVNs decreased running to avoid air puff (F(1,7) = 18.76, P < 0.0001). Right: activation of NVNs increased running to avoid air puff (F(1,7) = 11.61, P = 0.0010). **P < 0.01, *P < 0.05, two-way ANOVA followed by Tukey’s test. (H) Schematics of the approach. (I) Left: inhibition of PVNs decreased running for water reward (F(1,9) = 29.283, p < 0.0001). Right: inhibition of NVNs had no effect on running for water reward (F(1, 7) = 0.30, p = 0.59). **P < 0.01, *P < 0.05, two-way ANOVA followed by Tukey’s test. (J) Left: inhibition of PVNs had no effect on running to avoid air puff (F(1,9) = 1.30, p = 0.26). Right: inhibition of PVNs decreased running to avoid air puff (F(1, 7) = 22.06, p <0.001). **P < 0.01, *P < 0.05, two-way ANOVA followed by Tukey’s test. Data are presented as mean ± s.e.m.
Figure 7.
Figure 7.. PVNs and NVNs act via the VP-LHb pathway.
(A) A schematic of the approach. (B) Left: inhibition of PVNVP→LHb decreased reward seeking (F(1, 7) = 9.55, p = 0.0043). Right: inhibition of NVNVP→LHb had no effect on reward seeking (F(1, 9) = 0.0041, p = 0.95). **P < 0.01, two-way ANOVA followed by Tukey’s test. (C) Left: inhibition of PVNVP→LHb did not further decrease reward seeking in these mice in the conflict task (F(1, 7) = 1.39, p = 0.25). Right: inhibition of NVNVP→LHb increased reward seeking to pre-conflict levels (F(1, 7) = 13.17, p = 0.0010). **P < 0.01, *P < 0.05, two-way ANOVA followed by Tukey’s test. (D) A schematic of the approach. (E) Left: inhibition of PVNVP→LHb decreased running for water reward (F(1, 11) = 8.56, p = 0.004). Right: inhibition of NVNVP→LHb had no effect on running for water reward (F(1, 7) = 0.060, p = 0.81). *P < 0.05, two-way ANOVA followed by Tukey’s test. (F) Left: inhibition of PVNVP→LHb had no effect on running to avoid air puff during the cue, although it induced an earlier termination of the running response after the cue (F(1, 11) = 5.57, p = 0.020). Right: inhibition of NVNVP→LHb decreased running to avoid air puff (F(1, 9) = 40.72, p < 0.0001). **P < 0.01, *P < 0.05, two-way ANOVA followed by Tukey’s test. Data are presented as mean ± s.e.m.

Comment in

References

    1. Berridge KC (2012). From prediction error to incentive salience: mesolimbic computation of reward motivation. Eur J Neurosci 35, 1124–1143. - PMC - PubMed
    1. Callaway EM, and Luo L (2015). Monosynaptic Circuit Tracing with Glycoprotein-Deleted Rabies Viruses. J Neurosci 35, 8979–8985. - PMC - PubMed
    1. Cohen JY, Amoroso MW, and Uchida N (2015). Serotonergic neurons signal reward and punishment on multiple timescales. Elife 4. - PMC - PubMed
    1. Cohen JY, Haesler S, Vong L, Lowell BB, and Uchida N (2012). Neuron-type-specific signals for reward and punishment in the ventral tegmental area. Nature 482, 85–88. - PMC - PubMed
    1. Courtin J, Chaudun F, Rozeske RR, Karalis N, Gonzalez-Campo C, Wurtz H, Abdi A, Baufreton J, Bienvenu TC, and Herry C (2014). Prefrontal parvalbumin interneurons shape neuronal activity to drive fear expression. Nature 505, 92–96. - PubMed

Publication types

LinkOut - more resources