. 2020 Feb 19;40(8):1689-1700.
doi: 10.1523/JNEUROSCI.1545-19.2020. Epub 2020 Jan 16.

Activity-Dependent Calcium Signaling in Neurons of the Medial Superior Olive during Late Postnatal Development

Affiliations

Activity-Dependent Calcium Signaling in Neurons of the Medial Superior Olive during Late Postnatal Development

Delwen L Franzen et al. J Neurosci. .

Abstract

The development of sensory circuits is partially guided by sensory experience. In the medial superior olive (MSO), these refinements generate precise coincidence detection to localize sounds in the azimuthal plane. Glycinergic inhibitory inputs to the MSO, which tune the sensitivity to interaural time differences, undergo substantial structural and functional refinements after hearing onset. Whether excitation and calcium signaling in the MSO are similarly affected by the onset of acoustic experience is unresolved. To assess the time window and mechanism of excitatory and calcium-dependent refinements during late postnatal development, we quantified EPSCs and calcium entry in MSO neurons of Mongolian gerbils of either sex raised in a normal and in an activity altered, omnidirectional white noise environment. Global dendritic calcium transients elicited by action potentials disappeared rapidly after hearing onset. Local synaptic calcium transients decreased, leaving a GluR2 lacking AMPAR-mediated influx as the only activity-dependent source in adulthood. Exposure to omnidirectional white noise accelerated the decrease in calcium entry, leaving membrane properties unaffected. Thus, sound-driven activity accelerates the excitatory refinement and shortens the period of activity-dependent calcium signaling around hearing onset. Together with earlier reports, our findings highlight that excitation, inhibition, and biophysical properties are differentially sensitive to distinct features of sensory experience.SIGNIFICANCE STATEMENT Neurons in the medial superior olive, an ultra-fast coincidence detector for sound source localization, acquire their specialized function through refinements during late postnatal development. The refinement of inhibitory inputs that convey sensitivity to relevant interaural time differences is instructed by the experience of sound localization cues. Which cues instruct the refinement of excitatory inputs, calcium signaling, and biophysical properties is unknown. Here we demonstrate a time window for activity- and calcium-dependent refinements limited to shortly after hearing onset. Exposure to omnidirectional white noise, which suppresses sound localization cues but increases overall activity, accelerates the refinement of calcium signaling and excitatory inputs without affecting biophysical membrane properties. Thus, the refinement of excitation, inhibition, and intrinsic properties is instructed by distinct cues.

Keywords: activity dependence; calcium current; calcium influx; excitatory currents; medial superior olive; postnatal development.


Figures

Figure 1.
Figure 1.
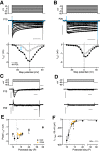
Developmental refinement of whole-cell calcium currents in MSO neurons. A, Top, Whole-cell calcium current in a P10 MSO neuron. Calibration: 100 ms, 1 nA. Blue trace represents the whole-cell current at a step potential of −35 mV. Bottom, Current–voltage relationship of the whole-cell calcium current. Blue arrow indicates the low voltage-activated T-type component at a step potential of −35 mV. Step potential was increased in 7 mV increments. Black circles represent peak current. Open circles represent steady-state current. Calcium currents were pharmacologically isolated with 1 μm TTX, 2 mm 4-AP, 10 mm tetraethylammonium chloride, 50 μm ZD 7288, 20 μm DNQX, 50 μm d-AP5 or 10 μm R-CPP, 0.5 μm strychnine, and 10 μm SR 95531 in the presence of 2.5 mm CaCl2 and 0.5 mm MgCl2. Calcium currents were P/x corrected. B, Same as in A, but in a P20 MSO neuron. Calibration: 100 ms, 1 nA. C, Whole-cell calcium current evoked by a step command to −55 mV (incremented in 5 mV steps) when preceded by a prepulse to −85 mV to remove steady-state inactivation in a P10 (top) and P20 (bottom) MSO neuron. Calibration: 10 ms, 500 pA. D, Whole-cell calcium current evoked by a step command to −55 mV (incremented in 5 mV steps) without a prepulse in a P10 (top) and P20 (bottom) MSO neuron. Calibration: 10 ms, 500 pA. E, Change in the maximal peak whole-cell calcium current extracted from the protocol in A during late postnatal development in gerbils raised in an NAE (black symbols) and gerbils raised in OWN (yellow symbols). Maximal currents were evoked by a step potential to −7, 0, or 7 mV. Dashed line indicates hearing onset (P12). F, Development of the T-type calcium current at a step potential of −35 mV, measured with a subtraction protocol during late postnatal development in gerbils raised in an NAE (black symbols) and in gerbils raised in OWN (yellow symbols). A sigmoid was fitted to the data. Sigmoid half value for NAE is at postnatal day 11.1. Dashed line indicates hearing onset (P12). Symbols represent the median. Error bars indicate the first and third quartiles. *p < 0.05.
Figure 2.
Figure 2.
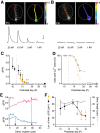
Developmental downregulation of dendritic calcium influx triggered by action potentials is accelerated by noise rearing. A, Dendritic calcium transient induced by a train of 25 somatically evoked action potentials at 10% above current threshold in a P13 MSO neuron. Top, Dendrite filled with OGB-1 as visualized during recordings (left) and color mapped for ΔFgreen/Fred (right). White circle represents the location of the circular field stop. Bottom, Dendritic calcium transients (ΔFgreen/Fred) in response to trains of 25, 10, and 3 action potentials (100 Hz) and in response to 1 action potential in the same P13 neuron. The calcium signal was averaged over the length of the visible dendrite. Calibration: 500 ms, 0.1 ΔFgreen/Fred. B, Same as in A, but in a P18 neuron. A detectable calcium transient could only be evoked in response to a train of 10 and 25 action potentials. C, Development of the dendritic calcium influx (ΔFgreen/Fred) evoked by 25 action potentials at 10% above the current threshold in gerbils raised in an NAE (black symbols) and in gerbils raised in OWN (yellow symbols). Dashed line indicates hearing onset (P12). D, Percentage of cells that display a dendritic calcium event in response to 25 action potentials throughout late postnatal development. Black symbols represent NAE. Yellow symbols represent OWN. Dashed line indicates hearing onset (P12). E, Amplitude of dendritic calcium transients (ΔFgreen/Fred) along the dendrite of a P11 (top, pink) and P15 (bottom, blue) neuron (NAE) in response to 25 action potentials. In both cases, dendritic location “0 μm” represents the soma. Dashed arrows indicate the dendritic location corresponding to the maximal ΔFgreen/Fred value. F, Developmental change in the dendritic location of the maximum ΔFgreen/Fred value in response to 25 action potentials in P10–P16 cells that displayed a calcium event. Dendritic location “0 μm” indicates the soma. Dashed lines indicate the median dendritic lengths of the dataset. Black symbols represent NAE. Yellow symbols represent OWN. Filled symbols represent the median. Error bars indicate the first and third quartiles. *p < 0.05.
Figure 3.
Figure 3.
Noise rearing does not affect the development of action potential and resting membrane parameters. A, Shape of the action potential at 10% above the current threshold throughout late postnatal development (P10–P18) and at maturity (P60). Calibration: 1 ms, 10 mV. B, Development of the depolarizing after potential (DAP) or after-hyperpolarizing potential (AHP). C, Developmental change in the action potential size (from baseline). D, E, Change in the input resistance (Rin) and membrane time constant as a function of postnatal day. All symbols represent the median. Error bars indicate the first and third quartiles. B–E, Black symbols represent NAE. Yellow symbols represent OWN. Gray dashed line indicates hearing onset (P12).
Figure 4.
Figure 4.
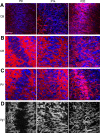
Synaptic marker proteins reveal large morphological rearrangements during synaptic development. A, Calbindin (red) and MAP-2 (blue) labeling of P9, P14, and P20 MSO sections shows the rearrangement of presumably glycinergic inputs. Scale bar, 40 μm. B, Calretinin (red) and Nissl (blue) labeling of P9, P14, and P20 MSO sections shows the rearrangement of presumably glutamatergic inputs. Scaled as in A. C, Parvalbumin (red) and Nissl (blue) labeling of P9, P14, and P20 MSO sections shows the increase in postsynaptic expression of calcium buffer. Scaled as in A. D, Vesicular glutamate transporter 1 (here abbreviated as Vg1) labeling shows the rearrangement of glutamatergic inputs to MSO neurons during late postnatal development at P9, P14, and P20. Scale bar, 40 μm.
Figure 5.
Figure 5.
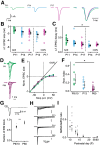
Development of excitatory inputs to MSO neurons is slightly accelerated by noise rearing. A, Left, Synaptic response to a minimal fiber stimulation protocol in an MSO neuron at P11, P14, and P17. Right, Overlay of the normalized synaptic responses in left image, highlighting the difference in decay kinetics. B, Single-fiber EPSC size during late postnatal development in gerbils raised in an NAE (left) and in OWN (right). C, The decay kinetics of the single-fiber EPSC during late postnatal development in gerbils raised in an NAE (left) and in OWN (right). *p < 0.05. D, Example traces of the current–voltage relationship of the AMPAR-mediated EPSC at P9 (top) and P60 (bottom) normalized to the current recorded at the most negative step potential. E, Normalized current–voltage relationship of AMPAR currents. Black line indicates the expected response for GluR2 only AMPARs. F, RI of the AMPAR-mediated EPSC at P9/10, P13, and P60. The RI was calculated by dividing the peak EPSC at 50 mV with the corresponding value of a line fitted to the first four values (E, black line). Filled symbols represent the median. Error bars indicate the first and third quartiles. *p < 0.05. G, Single-fiber EPSC (top) before (black) and after (gray) application of 60 μm IEM-1460. Bottom, The fraction of EPSC block between control and drug conditions. Open symbols represent individual cells. Closed symbols represent the median with quartiles. *** p < 0.001. H, Synaptic currents of multiple inputs recorded in <0 Mg2+ external concentration at different developmental stages. In adult animals, the slow inward, presumably NMDAR-mediated current is absent. Calibration: 2 nA. I, NMDA/AMPA ratio extracted from currents exemplified in H as a function of postnatal day.
Figure 6.
Figure 6.
Synaptic inputs evoke calcium transients in juvenile and mature MSO dendrites under physiological conditions. A–C, Left, OGB-1-loaded dendrite of a P12 MSO neuron. Right, EPSPs evoked by train stimulations of afferent fibers. Left, Red circle represents the region from where the calcium transients in B were taken. B, Local dendritic calcium transients in response to a 25-pulse stimulation (black trace) and a 10-pulse stimulation (gray trace). C, The maximal ΔFgreen/Fgreen values from 8 dendrites (black lines and circles) and in addition the background signal (gray dashed line and circles). D–F, Same as in A–C, but for 5 dendrites from gerbils older than P60. D, Right, Gray inset, Magnified, first EPSP in the stimulation train.
Figure 7.
Figure 7.
NMDAR contribution to synaptically evoked calcium transients in NAE- and OWN-reared animals. A, Examples of dendritic calcium transients evoked by synaptic stimulation at several postnatal stages. The ROI is colored for ΔF/F (ΔFgreen/Fgreen). White points indicate the out-of-focus part of the dendrite. Scale bar, 10 μm. B, Example kymograph in a P14 neuron (shown in A) illustrating synaptically evoked calcium influx over time along the imaged dendritic ROI. Dotted white lines indicate the region from which the calcium signal was summed. C, Overall decrease in the sum ΔF/F evoked by synaptic stimulation (25 pulses at 100 Hz) in gerbils raised in an NAE (black symbols) and in gerbils raised in OWN (yellow symbols). Dashed line indicates hearing onset (P12). Filled symbols represent the median. Error bars indicate the first and third quartiles. *p < 0.05. D, The relative contribution of AMPARs and NMDARs toward the overall calcium influx during postnatal development assessed with pharmacology. Blue bars represent NAE. Yellow bars represent OWN. Open circles represent the NMDAR contribution (%) to the calcium influx of individual cells, estimated by bath application of DNQX.

Similar articles

Cited by

References

    1. Ammer JJ, Grothe B, Felmy F (2012) Late postnatal development of intrinsic and synaptic properties promotes fast and precise signaling in the dorsal nucleus of the lateral lemniscus. J Neurophysiol 107:1172–1185. 10.1152/jn.00585.2011 - DOI - PubMed
    1. Autret L, Mechaly I, Scamps F, Valmier J, Lory P, Desmadryl G (2005) The involvement of Cav3.2/alpha1H T-type calcium channels in excitability of mouse embryonic primary vestibular neurones. J Physiol 567:67–78. 10.1113/jphysiol.2005.089342 - DOI - PMC - PubMed
    1. Bazwinsky-Wutschke I, Härtig W, Kretzschmar R, Rübsamen R (2016) Differential morphology of the superior olivary complex of Meriones unguiculatus and Monodelphis domestica revealed by calcium-binding proteins. Brain Struct Funct 221:4505–4523. 10.1007/s00429-015-1181-x - DOI - PubMed
    1. Bellingham MC, Lim R, Walmsley B (1998) Developmental changes in EPSC quantal size and quantal content at a central glutamatergic synapse in rat. J Physiol 511:861–869. 10.1111/j.1469-7793.1998.861bg.x - DOI - PMC - PubMed
    1. Berridge MJ. (1998) Neuronal calcium signaling. Neuron 21:13–26. 10.1016/S0896-6273(00)80510-3 - DOI - PubMed

Publication types

LinkOut - more resources