. 2020 Jan 16;11(1):313.
doi: 10.1038/s41467-019-14125-x.

Genomic programming of IRF4-expressing human Langerhans cells

Affiliations

Genomic programming of IRF4-expressing human Langerhans cells

Sofia Sirvent et al. Nat Commun. .

Abstract

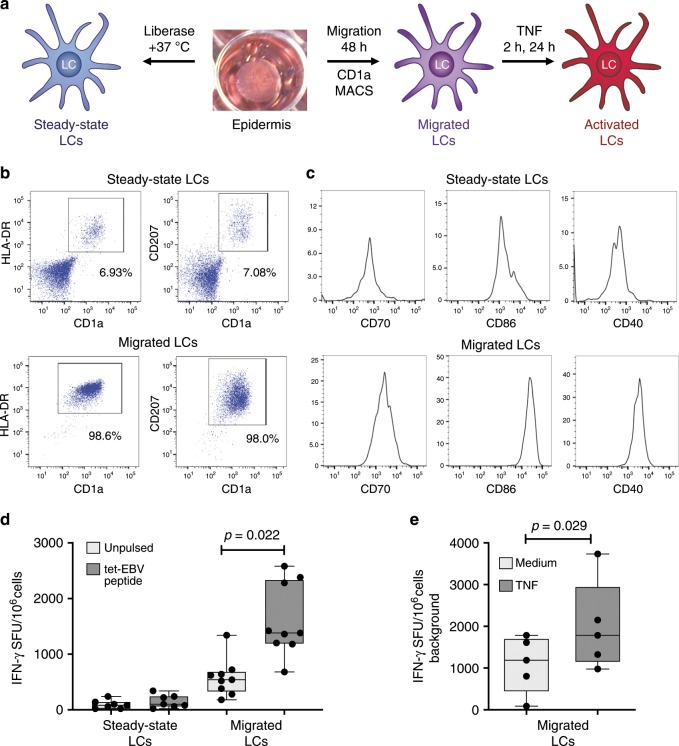
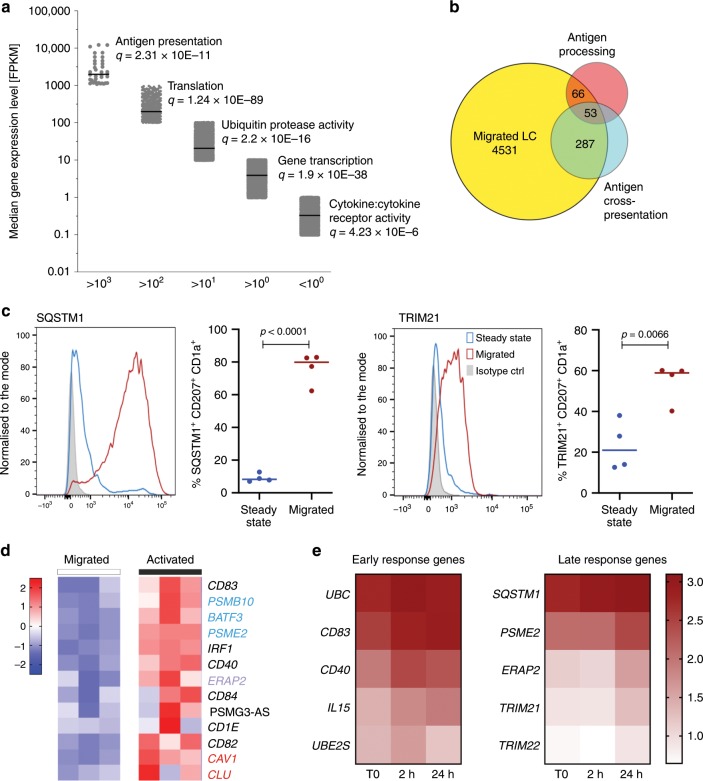
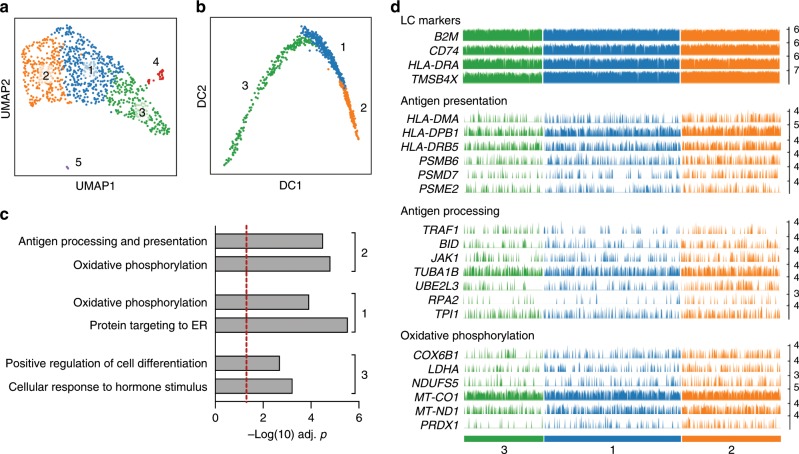
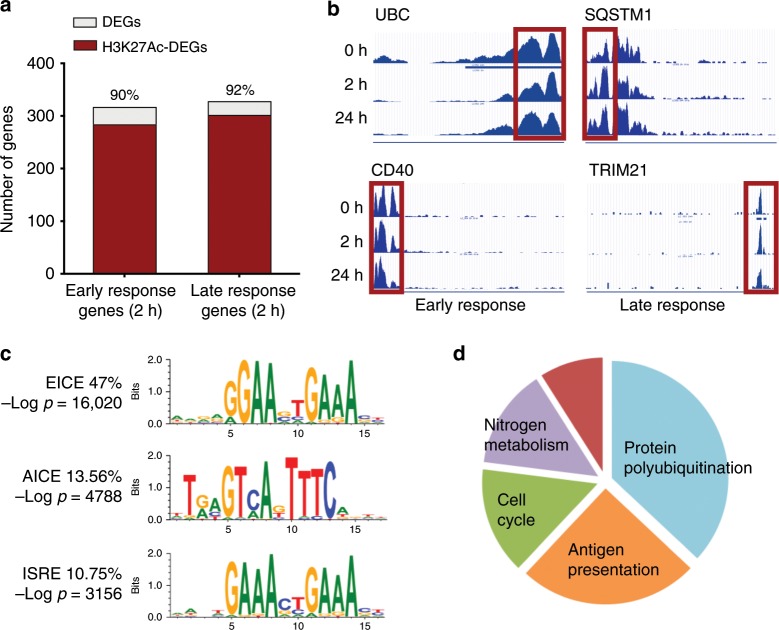
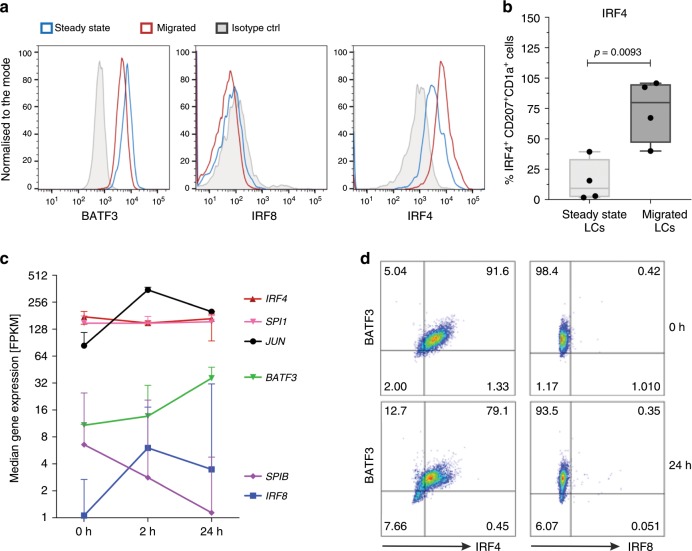
Langerhans cells (LC) can prime tolerogenic as well as immunogenic responses in skin, but the genomic states and transcription factors (TF) regulating these context-specific responses are unclear. Bulk and single-cell transcriptional profiling demonstrates that human migratory LCs are robustly programmed for MHC-I and MHC-II antigen presentation. Chromatin analysis reveals enrichment of ETS-IRF and AP1-IRF composite regulatory elements in antigen-presentation genes, coinciding with expression of the TFs, PU.1, IRF4 and BATF3 but not IRF8. Migration of LCs from the epidermis is accompanied by upregulation of IRF4, antigen processing components and co-stimulatory molecules. TNF stimulation augments LC cross-presentation while attenuating IRF4 expression. CRISPR-mediated editing reveals IRF4 to positively regulate the LC activation programme, but repress NF2EL2 and NF-kB pathway genes that promote responsiveness to oxidative stress and inflammatory cytokines. Thus, IRF4-dependent genomic programming of human migratory LCs appears to enable LC maturation while attenuating excessive inflammatory and immunogenic responses in the epidermis.


Conflict of interest statement

The authors declare no competing interests.

Figures

Fig. 1
Fig. 1. System for analysing human LCs and control of antigen cross-presentation.
a Schematic depicting isolation of primary human LCs. Split healthy skin was treated with dispase for 20 h to dissociate epidermis. Steady-state LCs were isolated from the epidermis by digestion with liberase TM or migrated from the epidermal sheets for 48 h in cell culture medium and stimulated with TNF (24 h) to induce their activation. b Flow cytometry assessment of steady-state and migrated LC. LCs were enumerated as CD207/CD1a/HLA-DR high cells. A representative example of n > 5 independent donors. c Flow cytometry assessment of activation markers expressed by steady-state and migrated LC. Co-stimulatory molecules critical for T-cell activation during antigen presentation (CD70, CD86 and CD40) were analysed in CD207/CD1a/HLA-DR high cells. A representative example of n > 5 independent donors. d IFN-γ secretion by an EBV-specific CD8 T-cell line stimulated with antigen presenting LCs in the context of MHC-I HLA-A2. Steady-state or migrated LCs were pulsed with 30-amino acid peptides containing EBV epitope (dark grey). Pulsed or unpulsed (light grey) LCs were stimulated with TNF and then assayed for IFN-γ secretion. ELISpot assay, n = 5 independent experiments in triplicate, paired t test, box and whiskers show min and max value, line at median. Source data are provided as a Source Data file. e IFN-γ secretion by EBV-specific CD8 T-cell line stimulated by migrated LCs pulsed as in panel d. IFN-γ secretion was measured with (black) or without (grey) TNF stimulation. ELISpot assay, n = 5 independent experiments in triplicate, paired t test, box and whiskers show min and max value, line at median. Source data are provided as a Source Data file.
Fig. 2
Fig. 2. Transcriptional programming of migrated human LCs.
a Dominant biological processes and pathways enriched in genes expressed at varying levels in steady-state migrated LCs. Gene ontology analysis for each expression level (Fragments Per Kilobase of transcript per Million mapped reads, FPKM) interval determined by RNA-seq was performed using ToppGene on-line tool. Line denotes median value in the interval. Top unique Biological processes are shown for each interval, significance denoted by FDR (Benjamini-Hochberg) corrected P-value is shown. The x-axis shows consecutive cut-offs for each interval in gene expression levels. Source data are provided as a Source Data file. b Overlaps between reported cross-presentation (373 genes) and antigen processing (212 genes) signatures, and genes expressed in migrated LC > 10 FPKM. c Intracellular expression of SQSTM1 and TRIM21 measured by flow cytometry. Steady-state (blue) and migrated (red) LCs. Representative histograms followed by quantitative analysis n = 4 independent donors, unpaired t test, line denotes median value. Source data are provided as a Source Data file. d TNF stimulation (24 h) of human LCs induces genes involved in antigen trafficking (red), processing (purple) and cross-presentation (blue). Expression levels of three biological replicates (TMM normalised gene expression levels, scaled in rows). Source data are provided as a Source Data file. e Enrichment of immune activation genes upregulated during a time course of TNF stimulation: left: early induced genes, peak expression at 2 h, Cluster 3, right: late induced genes, peak expression at 24 h. Median of three biological replicates, normalised expression levels. Stars denote genes belonging to antigen presentation in class I, MSigBD, Broad Institute. Source data are provided as a Source Data file.
Fig. 3
Fig. 3. scRNA-seq analysis of migrated human LCs.
a UMAP plot of 950 migrated LCs (ScanPy, Leiden r = 0.2, n_pcs = 4, n_neighbours = 10, 2464 highly variable genes (min_mean = 0.0125, max_mean = 6, min_disp = 0.6) defines three major clusters of LCs. b Pseudotrajectory analysis of the transcriptomes of 950 migrated LCs (ScanPy, diffmap: Leiden r = 0.2, n_pcs = 4, n_neighbours = 10). Cells are colour coded for clusters as in panel a. c Gene ontology analysis for marker genes (n = 100) representative of indicated cluster, performed using ToppGene. –log(10) Benjamini-Hochberg corrected P-values are shown for cluster-specific processes. Source data are provided as a Source Data file. d Barplots displaying frequency and amplitude expression of indicated gene transcripts. Bars are colour coded for cells as in panel a. Representative uniformly expressed genes characteristic of LCs (top panel), genes involved in antigen presentation and processing (middle panels) and genes functioning in oxidative phosphorylation (bottom panel) are displayed. Each bar shows CPTT (counts per ten thousand) normalised expression level of indicated transcript in a given LC.
Fig. 4
Fig. 4. Chromatin landscape of migrated LCs enriches for EICE, AICE and ISRE motifs.
Human steady-state migrated LCs were subjected to whole-genome chromatin profiling of H3K4me3 and H3K27Ac. a Proportion of DEG with H3K27Ac mark at 2 h in clusters of co-expressed genes upregulated early (2 h, clusters 3) and late (24 h, cluster 2) following stimulation with TNF. Changes in H3K27Ac acetylation were calculated using MANorm algorithm embedded in BioWardrobe tool. Genes were filtered to include unique common entry across the biological replicates (consensus value from n = 3 independent donors). Genes with detected changes in acetylation were intersected with DEGs identified by EdgeR analysis. Source data are provided as a Source Data file. b UCSC genome browser tracks of H3K27Ac mark changes in human migrated LCs over the time course of stimulation with TNF. Early ubiquitin C, UBC (top) and CD40 (bottom) and late sequestosome SQSTM1 (top) and TRIM21 (bottom) induced genes. Red rectangle denotes promoter site, a representative example. c Promoter sites of genes acetylated at H3K27 in migrated human LCs are enriched in IRF-binding composite DNA elements. EICE is the top human motif enriched at steady-state LCs (HOMER de novo motif detection analysis, median –log P-value shown). d Peaks H3K4Me3 and H3K27Ac T0 datasets were scanned for ISRE/AICE/EICE binding motifs. In total, 1193 consensus transcripts (present in all three biological replicates with both chromatin marks) were identified. Biological processes enriched in those genes were detected using ToppGene based on FDR-corrected P-values for GO categories and collapsed to overarching categories. Source data are provided as a Source Data file.
Fig. 5
Fig. 5. Human LCs upregulate expression of IRF4 upon migration, but lack IRF8.
a IRF4, but not IRF8, protein expression is upregulated in BATF3-positive LC during migration from the epidermis. A representative FACS analysis of 3–5 independent donors, gates set using isotype controls for each antibody (nuclear staining for IRF4, IRF8 and BATF3). b IRF4 protein expression in steady-state vs migrated LCs. IRF4+ LCs (%) as measured by flow cytometry, median ± range, n = 4, three paired samples from independent donors, unpaired t test, box and whiskers show min and max value, line at median. Source data are provided as a Source Data file. c Transcript levels of key transcription factors in migrated LCs before and after TNF stimulation (2 h, 24 h). FPKM values, median ± range of three biological donors are shown. Source data are provided as a Source Data file. d Expression of IRF4 and BATF3 in response to TNF signalling (24 h). Representative graphs of five independent donors, gates set using isotype controls for each antibody (Nuclear staining for IRF4, IRF8 and BATF3).
Fig. 6
Fig. 6. IRF4-mediated transcriptional programming of human LCs.
Knockdown (KD) of IRF4 using CRISPR-Cas9 editing. An IRF4 guide–CAS9 complexes were introduced by nucleofection into migrated LCs. Indicated analyses were performed 48 h after nucleofection. a Intranuclear expression levels of IRF in CRISPR-Cas9 edited (orange) and control (blue) migrated LCs measured using flow cytometry in CD207+ CD1a+ live LCs. A representative example of n = 3 independent donors. b Quantification of the intranuclear expression levels of IRF4 in CRISPR-Cas9 edited (orange) and control (blue) migrated LCs. Mean fluorescence intensity (MFI) of IRF4-expressing CD207+ CD1a+ live LCs shown, n = 3 independent donors, paired t test, box and whiskers show min and max value, line at median. Source data are provided as a Source Data file. c scRNA-seq analysis of WT and IRF4 KD migrated LCs. UMAP plot of 1484 LCs (WT:617 cells, blue, KD, 867 cells, orange) (filtering setting gene count 500–10,000 per cell, expression of mitochondrial genes <0.2, Leiden r = 0.2). d GO processes and pathways differentially enriched in control LC (WT, left) versus IRF4 CRISPR-Cas9 edited LCs (IRF4 KD, right). DEG analysis was performed using Single TK package, scDiffExlimma algorithm, scnorm data, FDR-corrected P-value used as a significance measure. Gene ontology enrichment: ToppGene tool, Biological Processes and Molecular Function. Source data are provided as a Source Data file. e Barplots of genes expressed at higher levels in WT LCs. Each bar shows CPTT normalised expression level of indicated gene in a given WT LC cell (blue) or IRF4 CRISPR-Cas9 edited LC (orange). IRF4 plus top five genes by FDR-corrected P-value and five genes representative for biological processes enriched in WT are displayed. f Barplots of genes expressed at higher levels in IRF4 KD LCs. Each bar shows CPTT normalised expression level of indicated gene in a given WT LC cell (blue) or IRF4 CRISPR-Cas9 edited LC (orange). Top five genes by FDR-corrected P-value and five genes representative for biological processes enriched in KO are displayed.

References

    1. van der Vlist M, et al. Human Langerhans cells capture measles virus through Langerin and present viral antigens to CD4(+) T cells but are incapable of cross-presentation. Eur. J. Immunol. 2011;41:2619–2631. doi: 10.1002/eji.201041305. - DOI - PubMed
    1. Polak ME, et al. CD70-CD27 interaction augments CD8+ T-cell activation by human epidermal Langerhans cells. J. Investig. Dermatol. 2012;132:1636–1644. doi: 10.1038/jid.2012.26. - DOI - PubMed
    1. Ribeiro CM, et al. Receptor usage dictates HIV-1 restriction by human TRIM5alpha in dendritic cell subsets. Nature. 2016;540:448–452. doi: 10.1038/nature20567. - DOI - PubMed
    1. van Dalen, R. et al. Langerhans cells sense staphylococcus aureus wall teichoic acid through langerin to induce inflammatory responses. mBio10, 10.1128/mBio.00330-19 (2019). - PMC - PubMed
    1. Seneschal J, Clark RA, Gehad A, Baecher-Allan CM, Kupper TS. Human epidermal Langerhans cells maintain immune homeostasis in skin by activating skin resident regulatory T cells. Immunity. 2012;36:873–884. doi: 10.1016/j.immuni.2012.03.018. - DOI - PMC - PubMed

MeSH terms