. 2020 Jan 16;11(1):331.
doi: 10.1038/s41467-019-14044-x.

Trapped ion mobility spectrometry and PASEF enable in-depth lipidomics from minimal sample amounts

Affiliations

Trapped ion mobility spectrometry and PASEF enable in-depth lipidomics from minimal sample amounts

Catherine G Vasilopoulou et al. Nat Commun. .

Abstract

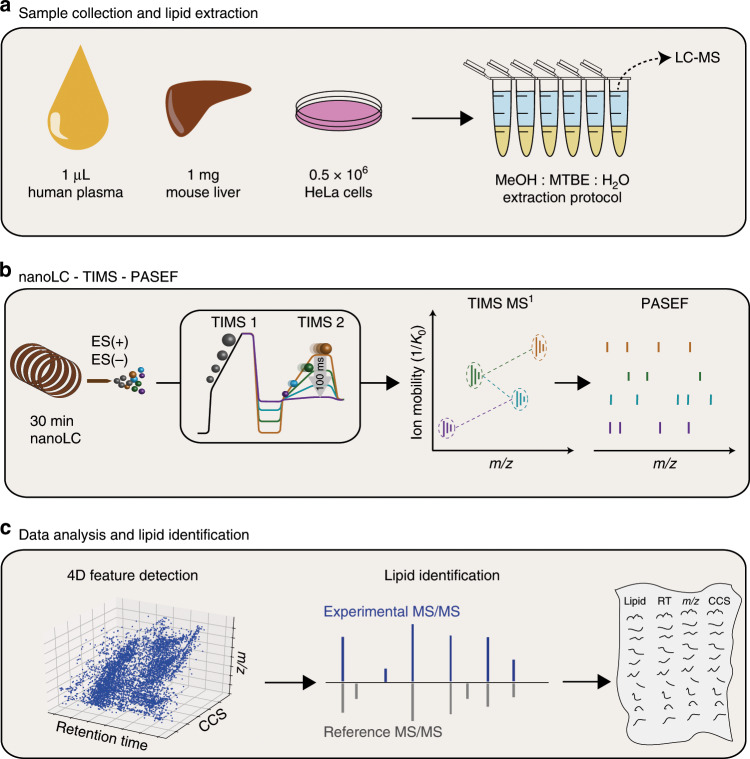
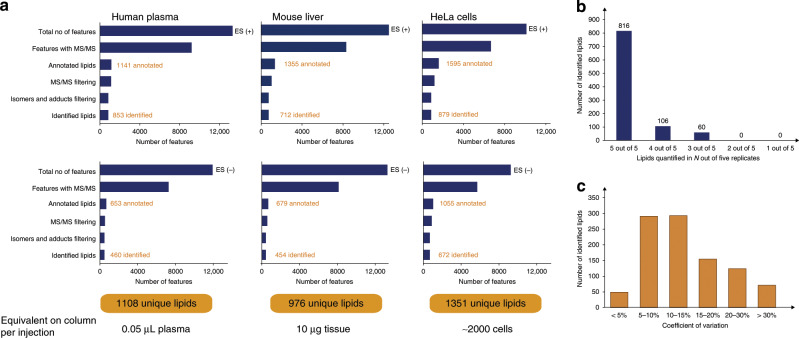
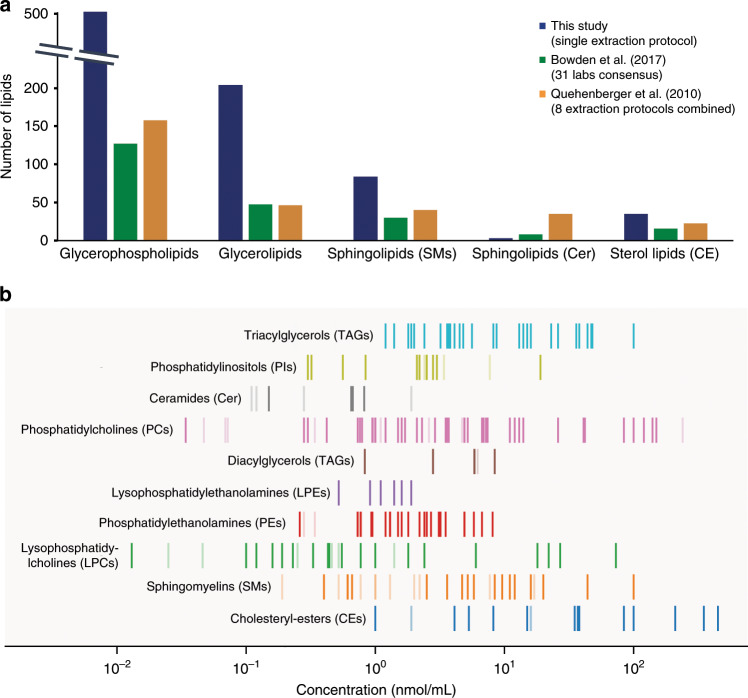
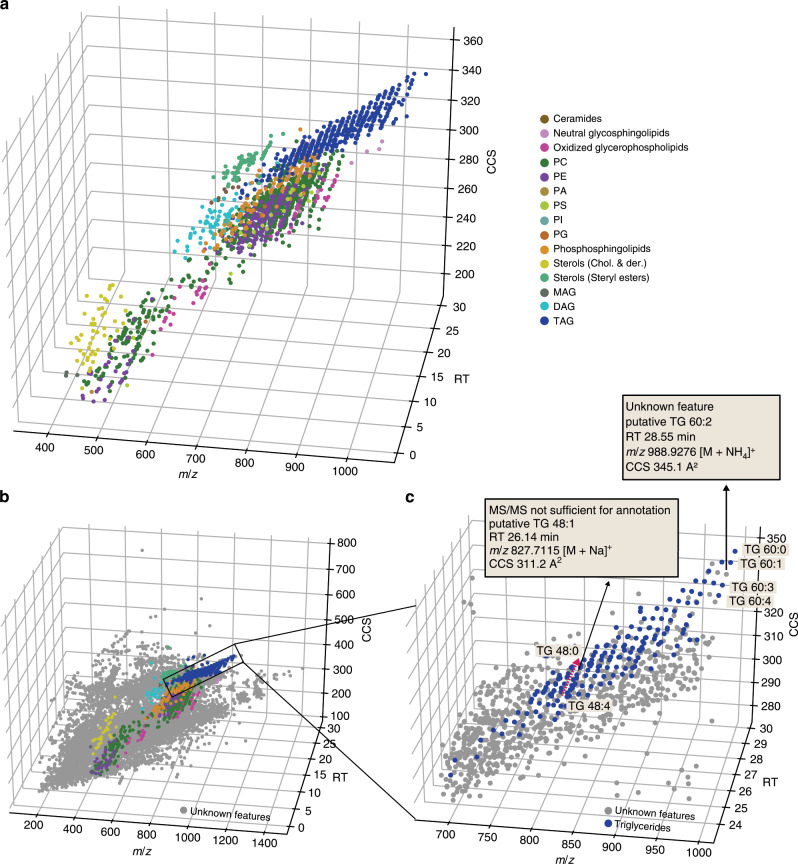
A comprehensive characterization of the lipidome from limited starting material remains very challenging. Here we report a high-sensitivity lipidomics workflow based on nanoflow liquid chromatography and trapped ion mobility spectrometry (TIMS). Taking advantage of parallel accumulation-serial fragmentation (PASEF), we fragment on average 15 precursors in each of 100 ms TIMS scans, while maintaining the full mobility resolution of co-eluting isomers. The acquisition speed of over 100 Hz allows us to obtain MS/MS spectra of the vast majority of isotope patterns. Analyzing 1 µL of human plasma, PASEF increases the number of identified lipids more than three times over standard TIMS-MS/MS, achieving attomole sensitivity. Building on high intra- and inter-laboratory precision and accuracy of TIMS collisional cross sections (CCS), we compile 1856 lipid CCS values from plasma, liver and cancer cells. Our study establishes PASEF in lipid analysis and paves the way for sensitive, ion mobility-enhanced lipidomics in four dimensions.


Conflict of interest statement

The following authors state that they have potential conflicts of interest regarding this work: U.S.H., S.M., and A.B. are employees of Bruker, the manufacturer of the timsTOF Pro, and N.S.M. is employee of PREMIER Biosoft, the vendor of the SimLipid software. The other authors declare no competing interests.

Figures

Fig. 1
Fig. 1. Nanoflow lipidomics with trapped ion mobility spectrometry.
a Lipids from various biological sources, such as body fluids, tissues and cells, are analyzed using a single MeOH:MTBE extraction. b The crude extract is injected into a nanoflow liquid chromatography (LC) system coupled online to a high-resolution TIMS quadrupole time-of-flight mass spectrometer (timsTOF Pro). In the dual TIMS analyzer, ions are accumulated in the front part (TIMS 1), while another batch is released as a function of ion mobility from the TIMS 2 analyzer. PASEF synchronizes precursor selection and ion mobility separation, which allows fragmenting multiple precursors in a single TIMS scan at full sensitivity. c Features are extracted from the four-dimensional (retention time, m/z, ion mobility, intensity) data space and assigned to PASEF MS/MS spectra for automated lipid identification and compilation of comprehensive lipid CCS libraries. MeOH = methanol, MTBE = methyl-tert-butyl ether, CCS = collisional cross section.
Fig. 2
Fig. 2. Evaluating PASEF in lipidomics.
Heat-map visualization of a representative trapped ion mobility resolved mass spectrum of human plasma at an elution time of 9.2 min. Red dots indicate precursors selected for MS/MS fragmentation in the subsequent 100 ms PASEF scan in a, standard TIMS-MS/MS mode and b TIMS-PASEF mode. The dashed line indicates the positioning of the quadrupole. c Distribution of the number of precursors per PASEF scan in an LC-MS analysis of human plasma lipid extract (n = 1). d Total number of 4D features extracted from 30 min runs of human plasma (n = 5), mouse liver (n = 5), and human cancer cells (n = 5) in positive ion mode without (TIMS-MS/MS, red) and with PASEF (TIMS-PASEF, blue). The fraction of features with assigned MS/MS spectra is indicated by a darker color.
Fig. 3
Fig. 3. Lipid identification and quantification.
a Sequential data analysis steps from the total number of detected 4D features to unique lipids for human plasma, mouse liver, and human cancer cells in both ionization modes. b Number of lipids quantified in N out of five replicate injections of liver tissue extract. c Coefficients of variation for 976 lipids quantified in at least three out of five replicate injections of liver tissue extract.
Fig. 4
Fig. 4. Analysis of 1 µL NIST SRM 1950 human plasma.
a Number of identified lipids from major lipid classes in this study and two reference studies from the same standard material,. b Mapping of lipids identified with our PASEF lipidomics workflow to absolute plasma concentrations reported in . Vertical lines indicate the abundance range of reported lipids from different lipid classes and dark color indicates commonly identified lipids in both studies.
Fig. 5
Fig. 5. Precise and accurate determination of lipid TIMSCCS values.
a Cross-instrument and cross-laboratory TIMSCCS measurement of a mixture of standard compounds (source data provided in Supplementary Data 8). Data labels indicate the coefficient of variation (CV) (n = 4 instruments). b CVs of TIMSCCS values for lipids commonly identified in replicate injections of a human plasma sample (n = 5 replicates, n = 1 instrument). c Pair-wise correlation of lipid TIMSCCS values from human plasma SRM 1950 measured on four different timsTOF Pro instruments. Relative deviation of experimental TIMSCCS values in this study (d) from literature reports, and e machine learning predictions.
Fig. 6
Fig. 6. The conformational landscape of lipid ions in TIMS.
a Three-dimensional (RT, m/z, CCS) distribution of 1856 lipids from various classes from three biological samples (plasma, liver, HeLa) in positive ion mode. b Overlay of unidentified (gray) and identified MS features detected in a human plasma sample. c Zoom into the data cuboid and putative assignment of two previously unidentified lipids based on their relative position in the data space. PC = Phospatidylcholine, PE = Phospatidylethanolamine, PA = Phosphatidic acid, PI = Phospatidylinositol, PG = Phospatidylglycerol, PS = Phospatidylserine, MAG = Monoacylglycerol, DAG = Diacylglycerol, TAG = Triacylglycerol.

Comment in

  • Reply to "Quality control requirements for the correct annotation of lipidomics data".
    Vasilopoulou CG, Sulek K, Brunner AD, Meitei NS, Schweiger-Hufnagel U, Meyer SW, Barsch A, Mann M, Meier F. Vasilopoulou CG, et al. Nat Commun. 2021 Aug 6;12(1):4772. doi: 10.1038/s41467-021-24985-x. Nat Commun. 2021. PMID: 34362889 Free PMC article. No abstract available.
  • Quality control requirements for the correct annotation of lipidomics data.
    Köfeler HC, Eichmann TO, Ahrends R, Bowden JA, Danne-Rasche N, Dennis EA, Fedorova M, Griffiths WJ, Han X, Hartler J, Holčapek M, Jirásko R, Koelmel JP, Ejsing CS, Liebisch G, Ni Z, O'Donnell VB, Quehenberger O, Schwudke D, Shevchenko A, Wakelam MJO, Wenk MR, Wolrab D, Ekroos K. Köfeler HC, et al. Nat Commun. 2021 Aug 6;12(1):4771. doi: 10.1038/s41467-021-24984-y. Nat Commun. 2021. PMID: 34362906 Free PMC article. No abstract available.

References

    1. Shevchenko A, Simons K. Lipidomics: coming to grips with lipid diversity. Nat. Rev. Mol. Cell Biol. 2010;11:593–598. doi: 10.1038/nrm2934. - DOI - PubMed
    1. Röhrig F, Schulze A. The multifaceted roles of fatty acid synthesis in cancer. Nat. Rev. Cancer. 2016;16:732–749. doi: 10.1038/nrc.2016.89. - DOI - PubMed
    1. Parker BL, et al. An integrative systems genetic analysis of mammalian lipid metabolism. Nature. 2019;567:187–193. doi: 10.1038/s41586-019-0984-y. - DOI - PMC - PubMed
    1. Han X, Gross RW. Global analyses of cellular lipidomes directly from crude extracts of biological samples by ESI mass spectrometry. J. Lipid Res. 2003;44:1071–1079. doi: 10.1194/jlr.R300004-JLR200. - DOI - PubMed
    1. Schwudke D, Schuhmann K, Herzog R, Bornstein SR, Shevchenko A. Shotgun lipidomics on high resolution mass spectrometers. Cold Spring Harb. Perspect. Biol. 2011;3:1–13. doi: 10.1101/cshperspect.a004614. - DOI - PMC - PubMed

Publication types