. 2020 Jan 16;11(1):333.
doi: 10.1038/s41467-019-14085-2.

Melanoblast transcriptome analysis reveals pathways promoting melanoma metastasis

Affiliations

Melanoblast transcriptome analysis reveals pathways promoting melanoma metastasis

Kerrie L Marie et al. Nat Commun. .

Abstract

Cutaneous malignant melanoma is an aggressive cancer of melanocytes with a strong propensity to metastasize. We posit that melanoma cells acquire metastatic capability by adopting an embryonic-like phenotype, and that a lineage approach would uncover metastatic melanoma biology. Using a genetically engineered mouse model to generate a rich melanoblast transcriptome dataset, we identify melanoblast-specific genes whose expression contribute to metastatic competence and derive a 43-gene signature that predicts patient survival. We identify a melanoblast gene, KDELR3, whose loss impairs experimental metastasis. In contrast, KDELR1 deficiency enhances metastasis, providing the first example of different disease etiologies within the KDELR-family of retrograde transporters. We show that KDELR3 regulates the metastasis suppressor, KAI1, and report an interaction with the E3 ubiquitin-protein ligase gp78, a regulator of KAI1 degradation. Our work demonstrates that the melanoblast transcriptome can be mined to uncover targetable pathways for melanoma therapy.


Conflict of interest statement

The authors declare no competing interests.

Figures
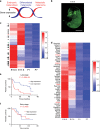
Fig. 1
Fig. 1. Discovery of metastasis development (MetDev) genes.
a Schematic depicting the experimental hypothesis: genes whose expression is upregulated in melanoblasts and metastatic melanoma, but downregulated in differentiated melanocytes (red line), may drive cellular functions that promote melanoma metastasis (MetDev genes). b Confocal imaging of iDct-GFP embryo at embryonic day 15.5 (E15.5) is magnification ×5, scale bars, 5 mm. c RNA-seq expression of mouse developing melanocytes: 467 embryo-specific genes shown. Black arrows: 42 genes identified from Cox proportional hazards model. Green arrows: genes functionally validated. Red arrow: Kdelr3. Kdelr3 validated both in Cox proportional hazards model and functionally validated. Embryonic days 15.5 and 17.5 (E15.5 and E17.5, respectively). Postnatal day 1 and postnatal day 7 (P1, P7, respectively). d RNA-seq expression of 46 genes in mouse developing melanocytes: Black text: 42 genes identified from Cox proportional hazards model. Red text: four genes functionally validated. Kdelr3 validated both in Cox proportional hazards model and functionally validated. e, f Cox proportional hazards modeling (GSE19234) yielded a 43-gene MetDev signature. Patients’ risk assessed in GSE8401 patient cohort. Late stage: stage III/IV metastatic melanomas. Early stage: stage I/II primary tumors. High expression: high expression of gene signature. Low expression: low expression of gene signature. Log-rank test. Late stage, high (N = 23) vs. low (N = 24), P = 3.486e − 05. Early stage, high (N = 14) vs. low (N = 13), P = 0.7655. c, d Color scales represent gene expression z scores.
Fig. 2
Fig. 2. Melanoblast gene expression in melanoma.
a KDELR3 (red) and GFP (green) staining in E17.5 iDct-GFP mouse skin. White arrows depict co-localization. Magnification, ×40. Scale bars, 20 µm. Representative image of 100 cells analyzed taken from one mouse. b Pan-cancer RNA expression of KDEL receptors in human cell lines (NCI60, CellMiner analysis); KDELR3 expression in melanoma (black line). c KDELR3 expression in human nevus and melanoma lymph node metastasis (red intercellular staining), magnification, ×10. Scale bar represents 200 µm. d H score of KDELR3 immunohistochemistry in human tumor microarrays. Unpaired two-tailed Student’s t test with Welch’s correction, P = 0.0003, d.f. = 47.9, t = 3.936. N = 21 (nevus) and N = 75 (melanoma). e KDELR3 expression in benign nevi and malignant melanoma (GSE3189; 204017_at probeset). Unpaired two-tailed Student’s t test with Welch’s correction, P < 0.0001, d.f. = 47.39, t = 6.035. N = 18 (benign nevi) and N = 45 (malignant melanoma). d, e Line and error bars represent mean ± s.e.m.
Fig. 3
Fig. 3. KDELR3 mediates melanoma metastatic potential.
ad Soft agar colony formation assay with a, b overexpression of KDELR3 (KDELR3 OE) in human SK-MEL-28 cells vs. parental cell, unpaired two-tailed Student’s t test, P = 0.0015, d.f. = 10, t = 4.307. Six wells were analyzed per group. N = 6 (Control) and N = 6 (KDELR3 OE). c, d shRNA KDELR3 knockdown (KDELR3 KD) in human WM-46 cells vs. non-targeting control, unpaired two-tailed Student’s t test, P = 0.0324, d.f. = 10, t= 2.483. N = 6 wells analyzed per group. e, f Western blot and qPCR analysis of exogenously expressed FLAG-tagged KDELR3-001; ENST00000216014 (N) and KDELR3-001Mu (Mu) in WM-46 (e) and 1205Lu (f) cells, transduced with non-targeting control (shControl/Cont./Control) or KDELR3-targeted (KD) shRNAs. Total KDELR3-001 RNA (KDELR3-001 and KDELR3-001Mu) (f). g Rescue of soft agar colony formation in KDELR3-001Mu cells (WM-46), Kruskal–Wallis with Dunn’s multiple comparison test. Five to six wells were analyzed per group. h, i Tail vein metastasis of Kdelr3 siRNA knockdown (Kdelr3 KD) in mouse B16 cells. Unpaired two-tailed Student’s t test with Welch’s correction, P = 0.0499, d.f. = 10.83, t = 2.207. N = 11 (siControl) and N = 11 (Kdelr3 KD). j Tail vein metastasis of KDELR3 siRNA-mediated knockdown in human 1205Lu cells transduced with Ferh-luc-GFP. Unpaired two-tailed Student’s t test with Welch’s correction, P = 0.0075, d.f. = 12.57, t = 3. N = 11 (siControl) and N = 11 (KDELR3 KD). b, d Bars and error bars depict mean ± s.e.m. g Bars and error bars depict mean ± SD. i, j Lines and error bars depict mean ± s.e.m. af, hj Representative of three independent experiments. g Representative of two independent experiments. e β-tubulin loading control.
Fig. 4
Fig. 4. KDELR3 and the ER stress response in metastatic melanoma.
a Scatter plot of Eif2ak3 (Perk) RNA expression vs. Kdelr3 RNA expression. Linear regression analysis, R2 = 0.3936, P < 0.0001. b Scatter plot of Ppp1r15a (Gadd34) RNA expression vs. Kdelr3 RNA expression. Linear regression analysis, R2 = 0.1137, P = 0.03. a, b Data from four independent mouse models of melanoma (see Methods). Each dot represents one mouse. M1, N = 9 mice; M2, N = 6 mice; M3, N = 12 mice; M4, N = 13 mice. c Western blot analysis of PERK and eIF2α signaling (1205Lu cells). Non-targeting control (shControl, C) and KDELR3 knockdown (shKDELR3, KD) in cells were untreated or treated with 3 µg/ml tunicamycin (TM) or DMSO control for the indicated time. Immunoblot with antibodies specified, β-tubulin loading control. d Live/dead violet cell stain in KDELR3-knockdown 1205Lu cells. Untreated, DMSO, and tunicamycin (2.5 μg/ml) treatment groups were treated 18 h before collection. The right-hand peak on the graph indicates the percentage of dead cells. Representative of three independent experiments (c, d).
Fig. 5
Fig. 5. KDELR3 regulates expression and processing of the metastasis suppressor KAI1.
a Screen of known melanoma metastasis suppressor expression following KDELR3 knockdown (3 days post knockdown). P, parental; C, siControl; K3, siKDELR3. b qPCR of KAI1 RNA expression (CD82 gene) in siRNA-knockdown cells (indicated), 3 days post knockdown. ce KAI1 protein (c) and RNA (d, e) expression in 1205Lu cells transfected with CD82/KAI1 overexpression (KAI1) or PCMV6-AC control vector (Vec.), KDELR3 transcript 1 with DDK tag (K3_1), KDELR3 transcript 2 with DDK tag (K3_2), or PCMV6 control vector (Vec.1). They were harvested 3 days post transfection. Equal protein amounts subjected to immunoblot analysis with an anti-KAI1 and anti-DDK antibody and anti-vinculin loading control (c). f 1205Lu cells parental (P), and 1205Lu cells transiently transfected with control siRNA (C), and KDELR3 siRNA (K3), harvested 3 days post transfection and equal protein amounts subjected to immunoblot analysis with an anti-KAI1 and anti-gp78 antibody. Red arrow indicates high-molecular-weight KAI1. g KAI1 protein expression in siRNA-knockdown (indicated) 1205Lu cells harvested 3 days post transfection and treated with deglycosylation enzymes (De-G). h qPCR of gp78 RNA expression (AMFR gene) in siRNA-knockdown cells (indicated), 4 days post knockdown. f, g Anti-vinculin antibody used to control for protein loading. i qPCR of KDELR3 RNA expression in siRNA-knockdown cells (indicated), 4 days post knockdown. j Co-immunoprecipitation of endogenous gp78 and mCherry-tagged gp78 (gp78-mCh) with FLAG-tagged KDELR3 (K3-DDK) in stably transduced 1205Lu cells. k pol2 > KDELR3-GFP (green) co-localizes with pol2 > gp78-mCherry (red) in 1205Lu metastatic melanoma cells. Scale bars, 50 µm. l Schematic of the KDELR3–KAI1 axis in melanoma metastasis. a Representative of four independent experiments. bf, h, jk Representative of three independent experiments. g, i Representative of two independent experiments. b, d, e, h, i Bars and error bars represent mean ± s.e.m. N = 3 (representative of three independent experiments). a, c, f, g Square brackets depict KAI1 molecular weights. j Square bracket depicts all forms of gp78, including endogenous and mCherry-tagged gp78.
Fig. 6
Fig. 6. KDELR3 expression correlates with advanced metastatic disease in patients.
a KDELR3-001 and KDELR3-002 patient expression data. Empirical Bayes moderated t-statistic (unpaired two-tailed test); KDELR3-001, ENST00000216014, P = 0.0202, t = 2.36, d.f. = 102.17; KDELR3-002, ENST00000409006, P = 0.87, t = 0.16, d.f. = 102.17. Boxplots of patient expression data from TCGA-SKCM dataset, depicting the 25th, 50th (median), and 75th percentile, and extreme values of the transcript expression. “Early” stage (stages I/II, N = 62 patients). “Late” stage (stages III/IV, N = 39 patients). n.s., not significant. b Kaplan–Meier estimated survival curves according to KDELR3 expression in early-stage (GSE8401; n = 27, stages I/II) and late-stage (GSE8401; n = 47, stages III/IV) melanomas. Log-rank test. c Association of KDELR3 expression and survival in metastatic melanoma (GSE19234, n = 38; GSE8401, n = 47, stages III/IV); HR = 1.62 (P = 0.028) and HR = 1.49 (P = 0.032) for GSE19234 and GSE8401, respectively. No significant association was found in the primary tumors (GSE8401, n = 27, stages I/II); HR = 0.76 (P = 0.509). Cox regression model was used to test the association.
Fig. 7
Fig. 7. KDELR1 knockdown increases lung colonization in tail vein metastasis assays.
a GSEA of gene co-expression within skin cutaneous melanoma patients of the TCGA (n = 479). Top 10 KDELR1-associated GO pathways represented, FDR <0.0001. GO pathways in order: Organelle inner membrane; Mitochondrial matrix; Amide biosynthetic process; Oxidative phosphorylation; Structural constituent of ribosome; Respiratory chain; Ribosome; Mitochondrial protein complex; Inner mitochondrial membrane protein complex; Ribosomal subunit. b GSEA of gene co-expression within skin cutaneous melanoma patients of the TCGA (n = 479). Top 10 KDELR3-associated GO pathways represented, FDR <0.0001. GO pathways in order: Extracellular structure organization; Extracellular matrix; Pigment granule; Lytic vacuole; Vesicle membrane; Response to topologically incorrect protein; Organelle inner membrane; Nucleoside monophosphate metabolic process; Response to endoplasmic reticulum stress; Nucleoside triphosphate metabolic process. c, d Tail vein metastasis of KDELR1 siRNA-mediated knockdown (N = 15) human 1205Lu cells transduced with Ferh-luc-GFP. Parental (N = 10), siControl (N = 13), and siKDELR3 (N = 15) were used as controls. Images of whole mouse lung were taken at 1× magnification. ANOVA with Tukey’s multiple comparison test; siControl vs. siKDELR1, P = 0.0013 [mean difference (95% CI): −312.5 (−521.7, −103.4)]; siKDELR3 vs. siKDELR1, P < 0.0001 [mean difference (95% CI): −415.3 (−616.8, −213.7)]. d.f. = 49, F = 10.8. CI, confidence interval of differences. Line and error bars represent mean ± s.e.m. e KDELR1-001 and KDELR1-002 patient expression data. Empirical Bayes moderated t-statistic (unpaired two-tailed test); KDELR1-001, ENST00000330720, P = 0.73, t = 0.35, d.f. = 102.17; KDELR1-002, ENST00000597017, P = 0.39, t = −0.86, d.f. = 102.17. Boxplots of patient expression data from TCGA-SKCM dataset, depicting the 25th, 50th (median), and 75th percentile, and extreme values of the transcript expression. “Early” stage (stages I/II, N = 62 patients). “Late” stage (stages III/IV, N = 39 patients). n.s., not significant.

Similar articles

Cited by

References

    1. Virchow, R. Die cellularpathologie in ihrer begründung auf physiologische und pathologische gewebelehre (Hirschwald, Berlin, 1858). - PubMed
    1. Hendrix MJ, et al. Reprogramming metastatic tumour cells with embryonic microenvironments. Nat. Rev. Cancer. 2007;7:246–255. doi: 10.1038/nrc2108. - DOI - PubMed
    1. Hardy KM, et al. Regulation of the embryonic morphogen Nodal by Notch4 facilitates manifestation of the aggressive melanoma phenotype. Cancer Res. 2010;70:10340–10350. doi: 10.1158/0008-5472.CAN-10-0705. - DOI - PMC - PubMed
    1. White RM, et al. DHODH modulates transcriptional elongation in the neural crest and melanoma. Nature. 2011;471:518–522. doi: 10.1038/nature09882. - DOI - PMC - PubMed
    1. Kaufman CK, et al. A zebrafish melanoma model reveals emergence of neural crest identity during melanoma initiation. Science. 2016;351:aad2197. doi: 10.1126/science.aad2197. - DOI - PMC - PubMed

Publication types

MeSH terms